Yesterday’s price action was very bearish yet again and we are patiently waiting for a counter trend pullback to happen. While three are some good looking plays out there I really do not want to get long until the market clears the air with a bout or three of strong selling. Remember 3:4 stocks follow the market and the odds of picking a commodity or ETF that bucks the trend is unlikely. If you are interested in powerful stocks & ETFs the buck the trend check out my FREE Trading Ideas live Go Here: https://stockcharts.com/public/1992897

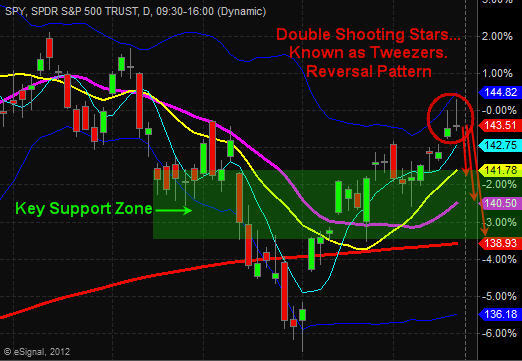
SP500 / Broad Stock Market:

We have seen a bug run up in stocks this month and things are looking a little long in the teeth. A large number of stocks are trading above their upper Bollinger band and the broad market is testing that key resistance level also. Typically when a Bollinger band is reached we see price reverse for a couple days at minimum.

While the equities market is in a new uptrend as seen by the moving averages I pullback seems imminient. The last two days has formed reversal candles and are pointing to lower prices.

Dec12SPY


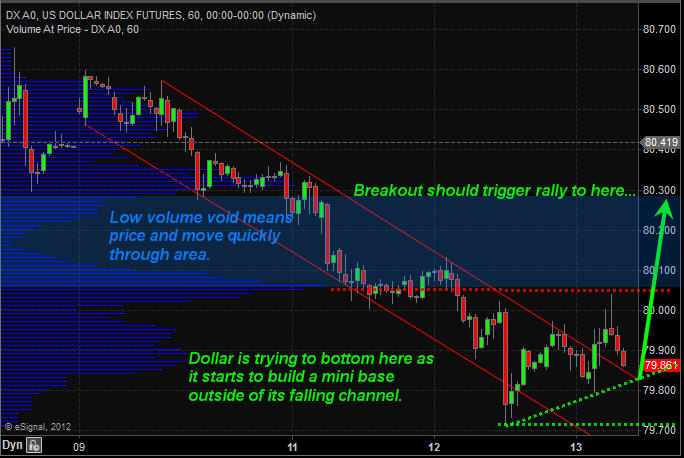
Dollar Index Hourly Chart:

This chart shows a possible bottom forming in the dollar pointing to a 3-8 day pullback in stocks.

Dec13DXBottom


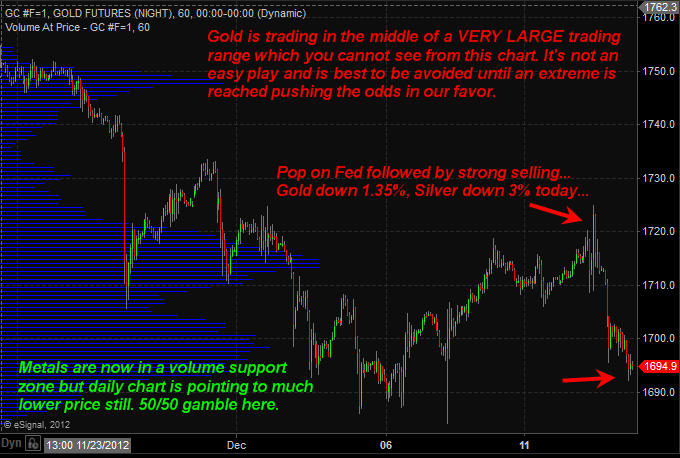
Gold Futures Hourly Chart:

Dec13Metals


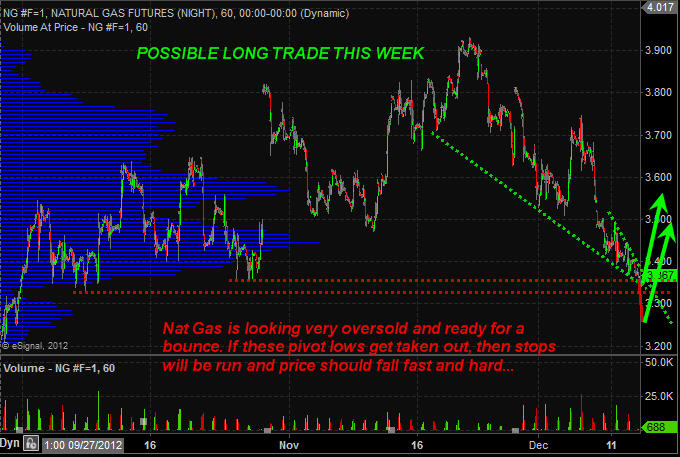
Natural Gas Hourly Chart:

Dec13NatGas


Morning Trading Conclusion:

Looking at the charts on several different time frames, not all shown here, technical analysis shows a pullback in stocks is highly likely. This is what we are currently positioned for.

The US dollars downward momentum is slowing and if it can find a bid today it should trigger strong selling in both stocks and commodities. Gold and silver are down sharply along with miners.

We have been watching natural gas for a few months and know that it has been trading inverse to what stocks do. This bodes well for a bounce in natural gas if stocks start a sell off. That being said, natural gas is trading at a key tipping point that could spark a very fast and hard drop. This knife can fall at a speed that will take a slice out of your trading account if not traded and managed properly (tiny position and use of a stop). I actually like natural gas the more it moves down and could issue a buy alert on it today or this week. I would like to see volume decline at this level showing the momentum is slowing…

Get My ETF Trade Alerts Now: www.TheGoldAndOilGuy.com

Chris Vermeulen

Good Morning,
Looks like today will be an exciting with stocks and commodities jumping in price up 1-3% as the US dollar pulled back in overnight trading. The SP500 is setting up for another short play which is showed in the video.

Yesterday our protective stop was triggered on the SP500 which was set at the previous day’s high. We locked in quick 7% on that position in only 5 trading sessions. You should be in cash at the moment.

Pre-Market Analysis Points:
    Dollar index has pulled back and is now at support. Looks as though it may bounce or rally any day now which means more selling in stocks and commodities.
–    Oil is trading at major support on the weekly chart but overall the intraday price and volume action remains bearish at this time.
–    Natural gas has bounced the past three sessions and is not trading at resistance. Lower prices are to be expected though Nat Gas is more of a wild card.
–    Gold, Gold miners and Silver are moving higher by 1-3% this morning but volume is not behind the move and higher highs and lows have not yet been formed.
–    Bonds have pulled back the past few sessions and could bounce or consolidate for a few more days yet. Price is floating in no-man’s land so it’s more of a wild card at this time.
–    SP500 just continued to move higher in overnight trading up over 1%. This is going to put stocks in an overbought market condition at the open. Sellers may step in today or tomorrow and force prices back down for a 1-2% drop as talked about in the morning video.

Chris Vermeulen

Good Morning,
I wanted to publish today’s video cause there is a lot going on. It’s going to be WILD so hold on to your hat!

Economic news was terrible and everyone is talking about a recession the past two days and with today’s data its clear we are in one or darn close. I’m sure there is some regulation that Obama made that says no one can use the word “Recession”. They will think of a new word for this.

If you are still short the SP500 like I am it would be wise to take a partial profits this morning or exit your position to lock in the gains. The market typically moves in certain percentage waves and we have just reach an extreme level where bounce may take place. We have made the easy money on this one and will be more than happy to reload at higher prices. We are up over 6% in 3 days.

Anyways, the video shows what has unfolded this morning and what my thoughts are going forward.

Morning Market Analysis Points:
–    Economic News was all TERRIBLE
–    Money is moving into gold and gold miners
–    Silver is trading slightly higher but gold is key safe haven.
–    The dollar is higher but not at much as one may think. The data today was on the USA so it’s not that bullish for the dollar but money is still coming out of equities and going into the dollar.
–    Bonds are up over 1.5% rocketing higher and almost reaching our measured move goal.
–    Oil is down 3.3%, Nat Gas is down 2.8% both starting to get close to major support.
–    SP500 was down over 2% but is starting to bounce and now down 1.8%

.
I also wanted to mention that on Sunday we close down our 30 day trial to our trading and investing video newsletter so if you want to know what is happening in the market and where your money should be each day/week then join our service. You get both Chris Vermeulen’s and JW Jones’ trading videos valued at $155 per month to test drive for a buck, then only $19.99 a month – www.TradersVideoPlaybook.com
.
Chris Vermeulen

Over the weekend I had an interesting conversation with a local trader. We typically meet a few times a year to share our market outlooks, new trading tools and techniques, and usually finish our session off in a debate about the US market manipulation and how to trade around it.

Talking about market manipulation always opens up a can of worms and sparks some interesting theories… And while everyone has their own views and opinion on this subject I thought I would briefly share the main points I pulled from our conversation.

I did talk about the dollar index last week, but the recent price action unfolding today is important so I’m going to recap on it again.


My Weekend Conversation Key Thoughts:

Point form thoughts supporting Lower Equity prices and a Higher Dollar:

–          Dollar index looks ready for a major rally (high dollar means lower stocks)

–          SP500 may have just formed a double top

–          SP500 closed strongly below the 20 day moving average

–          First week of May for the past two years have been intermediate market tops

Points supporting Higher Equity prices and a Lower Dollar:

–          Countries around the globe are trying to keep their currency value low including the United States.

–          Presidential cycle strongly favors higher stocks prices which means the dollar should not rally until Nov.

What do all these points mean? Let’s take a look at the dollar charts below…


4 Hour Dollar Index Chart:

This chart time frame allows us to see all intraday price action while being able to zoom out several months for patterns along with key support and resistance levels.

As you can see over the past few months the dollar has been consolidating sideways. Within this consolidation it has formed two bullish falling wedges with the most recent one breakout last week right on queue.

Using this 24 hour futures dollar index chart we can see where things are trading through the weekend. On Friday the dollar index closed around the 79.50 level. As you can see the dollar has surged Sunday night by more than half a penny breaking through its down trend line.

The next few weeks will continue to be exciting ones as strong moves in the dollar will create wild movements in stocks and commodities.


Long Term Weekly Dollar Index Chart:

If you zoom WAY OUT using the weekly chart this shows you the two major areas where the dollar index is likely to reach come November. Also with these levels are my SP500 price points which are simply numbers I pulled from the charts using basic analysis. I say this because I’m not into long term forecasting but rather shorter term price movements. A lot can change between now and then.

So, if the dollar index rallies to the 86 – 88 level then I would expect the SP500 to be trading back down at the 1000 level. If this takes place, the Fed will likely issue QE3 to jam the dollar back down and boost equities.

The flip side of the coin is that the dollar rolls over here and gets pulled down. This will boost stock prices in favor for the president’s election. After that the dollar would likely rally which in turn would put a major top in the stock market, kick starting a bear market.


The big question…

Do you short the market in anticipation of rising dollar and falling stock prices? OR do you buck the trend and stick with the theory of a lower dollar value and presidential cycle?

The charts above clearly show how we are entering a major tipping point for the market and the next couple months are likely going to provide some big price swings for stocks, commodities and currencies.

If you want to get my thoughts and market ideas each morning before the opening bell be sure to join my video newsletter www.TheGoldAndOilGuy.com

Chris Vermeulen

Investors and traders just can’t seem to catch a break when it comes to economic news. For example Tuesday in the United States we saw strong ISM manufacturing numbers which surprised the market. The numbers were way above expectations and it triggered a feeding frenzy in US based investments like stocks and the green back.

The following session Italy reported terrible PMI and unemployment rate numbers which took most of the wind out the European and US stocks. One day the data is great, next day it’s bad…

The strong numbers in the US have everyone including myself thinking that this week’s jobless claims (unemployment rate) will be down. If this is the case then we will see stocks jump along with the dollar, much like what we saw trader do last Tuesday which is what Jim Cramer says best – BUY BUY BUY.

Normally we do not see the dollar index rally along with stocks but if EU continues to show signs of weakness then it is very likely the dollar and equities inverse relationship could decouple. Reason being investors around the globe will focus their money on the more stable US investments like the dollar and US stocks.

You can learn how to trade economic news with my free Economic Indicator Trading Tool: http://www.thetechnicaltraders.com/economic-indicators.pdf    


The Dollar is Trading at a Major Tipping Point – Weekly Chart

The dollar index is something that I watch very closely on a daily basis. Focusing on the weekly and 8 hour charts I look for support and resistance levels along with price patterns.

As you can see from the weekly dollar chart below, a large bull flag has formed. This pattern typically means higher prices and in this case the price target is between the 86 and 88 level.


There are few wild cards to toss into the game on what will unfold next:

  1. Currency manipulation seems to be strong and if the US wants a low dollar value then it’s likely it will stay low. This bodes well for stocks and commodities.
  2. Depending on what happens and how things unfold in Euro-land the dollar/stock relationship could decouple meaning they could start to rise together. If we get neutral economic data out of the EU and positive data out of the US it will likely boost the value of stocks and the dollar. But strong negative data out of the EU will more than likely just sent the dollar higher and spooking investors and triggering a selloff in stock prices.

Dollar Index Investing


Dollar Index 4 Hour Chart

I find the dollar index to be a great trading tool in helping me time short term reversals in the equities market.

Taking a look at the 8 hour chart below you can see recurring bullish falling wedge patterns. The most recent brake out was this week and I anticipate the 79.50+ levels to be reached in the near term. If the dollar does continue to move higher then I expect sideways to lower stock prices for a couple more sessions.

That being said, the mixed economic data between the US and EU is going to cause this scenario to be unpredictable. Depending on the jobless claims this week stocks could actually rally while the dollar moves higher. Unfortunately, this week’s mixed data does not provide any trading opportunities that I feel comfortable making.

Dollar Index Trading


Mid-Week Market Conclusion:

In short, I feel a higher dollar is likely to happen. As for stock prices, well they are more of a wild card at this time but my analysis slightly favors higher prices.

To quickly touch on precious metals, they are likely to be under pressure for a few sessions simply because of the rising dollar.

I hope my analysis helps paint a picture of what to expect in the coming days.

Happy Trading,
Chris Vermeulen
www.GoldAndOilGuy.com – ETF Trading Analysis & Alerts