
Gold and silver have taken more of a back seat over the past 12 months because of their lack of performance after topping out in 2011. Since then prices have been trading sideways/lower with declining volume. The price action is actually very bullish from a technical standpoint. My chart analysis and forward looking forecasts show $3,000ish for gold and $90ish for silver in the next 18-24 months.
Now don’t get too excited yet as there is another point of view to ponder…
My non-technical outlook is more of a contrarian thought and worth thinking about as it may unfold and catch many gold bugs and investors off guard costing them a good chunk of their life savings. While I could write a detailed report with my thinking, analysis and possible outcomes I decided to keep it simple and to the point for you.
Bullish Case: Euro-land starts to crumble, stocks fall sharply sending money into gold and silver which are trading at these major support levels which in the past triggered multi month rallies.
Bearish Case: Greece, Spain and Italy worth through their issues over the next few months while metals bounce around or drift higher because of uncertainty. But once things have been sorted out and financial stability (of some sort) has been created and the END OF THE FINANCIAL COLLAPSE has been avoided money will no longer want to be in precious metals but rather move into risk-on.
Take a look at the gold and silver charts below for an idea of what may happen and where support levels are if we do see money start to rotate out of metals in the next 3-6 months.


Over the next few months things will slowly start to unfold and shed some light on what the next big move is likely going to happen to gold and silver.
The price movements we have seen for both gold and silver indicate were are just warming up for something really big to happen. It could be a massive parabolic rally to ridiculous new highs in 2012/2013 or it could be a huge unwinding of the safe havens as countries sort out their issues and the big money starts moving out of metals and into currencies and stocks.
Only time will tell and that is why I analyze the market multiple times per week to stay on top of both long term and short term trends. So if you want to keep up with current trends and trades for gold, silver, oil, bonds and the stocks market checkout TGAOG at: http://www.thegoldandoilguy.com/free-preview.php
Chris Vermeulen
Good Morning,
Looks like today will be an exciting with stocks and commodities jumping in price up 1-3% as the US dollar pulled back in overnight trading. The SP500 is setting up for another short play which is showed in the video.
Yesterday our protective stop was triggered on the SP500 which was set at the previous day’s high. We locked in quick 7% on that position in only 5 trading sessions. You should be in cash at the moment.
Pre-Market Analysis Points:
– Dollar index has pulled back and is now at support. Looks as though it may bounce or rally any day now which means more selling in stocks and commodities.
– Oil is trading at major support on the weekly chart but overall the intraday price and volume action remains bearish at this time.
– Natural gas has bounced the past three sessions and is not trading at resistance. Lower prices are to be expected though Nat Gas is more of a wild card.
– Gold, Gold miners and Silver are moving higher by 1-3% this morning but volume is not behind the move and higher highs and lows have not yet been formed.
– Bonds have pulled back the past few sessions and could bounce or consolidate for a few more days yet. Price is floating in no-man’s land so it’s more of a wild card at this time.
– SP500 just continued to move higher in overnight trading up over 1%. This is going to put stocks in an overbought market condition at the open. Sellers may step in today or tomorrow and force prices back down for a 1-2% drop as talked about in the morning video.

Chris Vermeulen
Good Morning,
I wanted to publish today’s video cause there is a lot going on. It’s going to be WILD so hold on to your hat!
I wanted to publish today’s video cause there is a lot going on. It’s going to be WILD so hold on to your hat!
Economic news was terrible and everyone is talking about a recession the past two days and with today’s data its clear we are in one or darn close. I’m sure there is some regulation that Obama made that says no one can use the word “Recession”. They will think of a new word for this.
If you are still short the SP500 like I am it would be wise to take a partial profits this morning or exit your position to lock in the gains. The market typically moves in certain percentage waves and we have just reach an extreme level where bounce may take place. We have made the easy money on this one and will be more than happy to reload at higher prices. We are up over 6% in 3 days.
Anyways, the video shows what has unfolded this morning and what my thoughts are going forward.
Morning Market Analysis Points:
– Economic News was all TERRIBLE
– Money is moving into gold and gold miners
– Silver is trading slightly higher but gold is key safe haven.
– The dollar is higher but not at much as one may think. The data today was on the USA so it’s not that bullish for the dollar but money is still coming out of equities and going into the dollar.
– Bonds are up over 1.5% rocketing higher and almost reaching our measured move goal.
– Oil is down 3.3%, Nat Gas is down 2.8% both starting to get close to major support.
– SP500 was down over 2% but is starting to bounce and now down 1.8%

.
I also wanted to mention that on Sunday we close down our 30 day trial to our trading and investing video newsletter so if you want to know what is happening in the market and where your money should be each day/week then join our service. You get both Chris Vermeulen’s and JW Jones’ trading videos valued at $155 per month to test drive for a buck, then only $19.99 a month – www.TradersVideoPlaybook.com
.
Chris Vermeulen
“You can’t understand what lays ahead if you don’t understand the past”
~ Satellite, Rise Against ~
Members of my service as well as long time readers know that I do a lot of analysis based on the past. I am constantly looking at long-term historical price charts and data. As a trader, I am always looking for an edge.
Obviously the keys to long-term success involve proper position sizing, risk management mechanisms, and ultimately leveraging probability. Professional traders are masters of these tenets. These characteristics are what separate successful traders from average traders over the long haul.
Sometimes through my rigorous analysis I come across price charts and oscillators that help put together a picture that helps shape my view of the marketplace. The past few months have been some of the most difficult market conditions that I have seen in some time.
The “wall of worries” permeates the financial landscape as risk at present seems unprecedented. The list of macroeconomic concerns ranges from the European sovereign debt crisis to escalation of military action in the Middle East.
I could probably write an entire article about the various risks that plague global financial markets at present, but I try to focus on the positive in any situation. Right now remaining optimistic is a daily battle amid the constant barrage of depressed economic data. Instead of focusing on all of the various risks, I focus on finding opportunities where probabilities are favorable based primarily on historical price data, cycle analysis, and tape reading.
Back on April 9th I proffered an article that discussed my expectation that the U.S. Dollar Index would rally while risk assets such as equities and oil prices would collapse. Additionally I commented on my expectations for weakness in gold, silver, and the entire mining complex. I was wrong about the timing of the U.S. Dollar’s advance, but the ultimate price action analysis was correct.
The following quote came from that article, “As shown above, I believe that short term targets to the downside are likely somewhere in the 1,475 – 1,525 price range. I think gold will find a major bottom near these levels and a strong bounce will play out.” (Click here to view the entire article)
When I originally wrote that article referring to a decline in gold prices gold futures were trading around 1,630 an ounce. Price rallied sharply higher after my article went public, but fast forward to today and my concerns appear to be well founded. I am a long-term gold bull and I ultimately believe that new highs will occur in the future. However, gold and gold miner’s may have further to fall before they find major support.
As stated above, my original expectations for the Dollar Index did not happen in the time frame I was anticipating. However, the belief that a rally was forthcoming proved to be accurate as can be seen from the price chart of the U.S. Dollar Index shown below.
U.S. Dollar Index Daily Chart

As can be seen above, the price action is confirming serious strength. The weekly close on Friday saw the Dollar close above a key short-term resistance level. Additionally I would point out the double bottom that has been carved out on the chart above which is also bullish. Should resistance near 80.76 give way to higher prices a test of the recent highs is quite possible.
The technical picture suggests higher prices in the near term for the greenback. From a fundamental viewpoint, recent economic data also suggests that higher prices may await as one the largest weekly debt issuance of 2012 among sovereigns within the Eurozone will transpire next week. If any of the debt auctions go poorly it will reflect negatively on the Euro currency and help push the Dollar higher.
Most of the debt issuance is outside of the 3 year maturity window so the LTRO justification to encumber risk does not apply. Next week we will find out just how serious investors are about accepting default risk on European debt instruments. I would be shocked if the ECB sits idly by, but the sheer amount of capital required to safeguard debt issuance next week is extreme, even for a major central bank.
The Euro currency continues to fall and has broken key resistance around the 1.30 price level on the EUR/USD currency pair. Price is not collapsing as of yet, but we are seeing a slow and steady slog lower for the Euro. This price action serves to boost the Dollar which ultimately places downward pressure on risk assets such as equities and oil. Additionally, it reduces the valuation of gold. The daily chart of gold futures is shown below.
Gold Futures Daily Chart

The recent price action in gold has been quite ugly and price is resting at key support stemming from an intermediate-term descending channel shown above. Should the lower bound break to the downside a sharp move lower could play out.
It is important to remember that gold is coming off a monster multi-year bull run and it only serves to make sense that a nasty pullback that shakes out the bulls would be forthcoming. I continue to believe that strong support and buyers will come back into gold around the 1,450 – 1,550 price range as significant long-term support levels should hold up prices. The key support zone is clearly illustrated in the chart above.
I continue to wait for price to reach that key support level and based on the current proximity those support levels are magnetizing price toward them. When long-term support / resistance levels are near price a test is a common occurrence. The most important question to ask is whether the support zone shown above will hold, or will even lower prices ultimately play out?
Gold and silver both are starting to become oversold on the daily time frame. While the gold bugs have been feeling pain the past few weeks, the gold miners have been taken out back to the woodshed for a good whipping. The miners have been absolutely crushed in 2012 .
My long term analysis revealed something quite extraordinary on the longer term weekly chart of the HUI gold mining index which I believe is critical for readers to watch and monitor. We are nearing valuation levels based on the true strength index that have not been seen since the market crash that took place back in 2008. The weekly chart of the gold bugs index is shown below.
Gold Bugs Index Weekly Chart
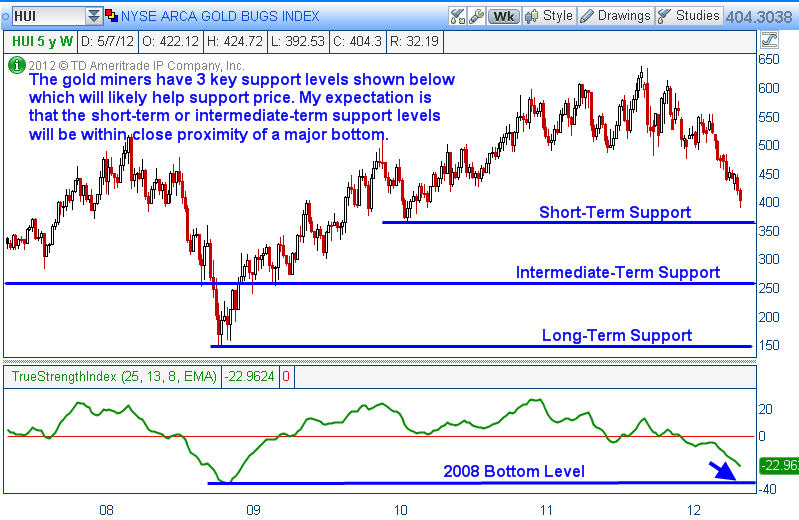
As can be seen above, the Gold Bugs Index (HUI) has been under considerable selling pressure since early September of 2011. However, note how low the True Strength Index is based on 5 years of price data. We are nearing the same level that we saw back in 2008 which marked a major bottom that ultimately resulted in a monster move to the upside for the gold miners.
I am of the opinion that this chart demonstrates quite clearly that a great buying opportunity for gold, silver, and the miners is likely going to present itself in the near future. I will be watching this price relationship over the next few weeks waiting for a strong entry point for a longer-term purchase. After this pullback concludes, the potential returns that could occur in gold, silver, and the miners could be breathtaking.
With 3 clear support levels, a defined risk approach could be used in order to scale in or to reduce market risk should prices continue to move below each support level. While the time is not right just yet, more than likely a solid long-term risk / reward trade may very well present itself in the precious metals and mining space. I am likely a bit early, but the ultimate end game as it relates to fiat currency is documented throughout history. The final result has a finality that few truly comprehend.
If you enjoyed this article and analysis, you can get our detailed trading analysis videos every Sunday, Monday, Wednesday and Thursday here risk free: http://tradersvideoplaybook.com/risk-free-30-day-trial/
Happy Trading and Investing!
JW Jones & Chris Vermeulen
This material should not be considered investment advice. J.W. Jones is not a registered investment advisor. Under no circumstances should any content from this article or the OptionsTradingSignals.com website be used or interpreted as a recommendation to buy or sell any type of security or commodity contract. This material is not a solicitation for a trading approach to financial markets. Any investment decisions must in all cases be made by the reader or by his or her registered investment advisor. This information is for educational purposes only.
The past couple months investors have been focusing on the equities market. And rightly so with stocks running higher and higher. Unfortunately most money managers and hedge funds are under performing or negative for the first quarter simply because of the way prices have advanced. New money has not been able to get involved unless some serious trading rules have been bent/broken (buying into an overbought market and chasing prices higher). This type of market is when aggressive/novice traders make a killing cause they cannot do anything wrong, but 9 times out of 10 that money is given back once the market starts trading sideways or reverses.
While everyone is currently focusing on stocks, its important to research areas of the market which are out of favor. The sector I like at the moment is precious metals. Gold and silver have been under pressure for several months falling out of the spot light which they once held for so long. After reviewing the charts it looks as though gold, silver and gold miner stocks are set to move higher for a few weeks or longer.
Below are the charts of gold and silver charts. Each candle stick is 4 hours allowing us to look back 1-2 months while still being able to see all the intraday price action (pivot highs, pivot lows, volume spikes and price patterns).
The 4 hour chart is one time frame most traders overlook but from my experience I find it to be the best one for spotting day trades, momentum trades and swing trades which pack a powerful and quick punch.
As you can see below with the annotated charts gold, silver and gold miner stocks are setting up for higher prices over the next 2-3 weeks. That being said we may see a couple days of weakness first before they start moving up again.
4 Hour Momentum Chart of Gold:

4 Hour Momentum Chart of Silver:

Daily Chart of Gold Miner Stocks:
Gold miner stocks have been under performing precious metals for over a year already. Looking at the daily chart we are starting to see signs that gold miner stocks could move up sharply at the trade down at support, oversold and with price/volume action signaling a possible bottom.

Daily Chart of US Dollar Index:
The US Dollar index has formed a possible large Head & Shoulders pattern meaning the dollar could fall sharply any day. The size of this chart pattern indicates that if the dollar breaks down below its support neckline the we should expect the dollar to fall for 2-3 weeks before finding support.
Keep in mind that a falling dollar typically means higher stock and commodity prices. If this senario plays out then we should see the market top late April which falls inline with the saying “Sell In May and Go Away”.

Precious Metals Conclusion:
Looking forward 2-3 weeks precious metals seem to be setting up for higher prices as we go into earning season and May. Overall the market is close to a top so it could be a bumpy ride as the market works on forming a top in April.
Chris Vermeulen
www.GoldAndOilGuy.com
By: Chris Vermeulen – www.GoldAndOilGuy.com
The past two months we have seen all the focus from traders and investors be on the equities market. And rightly so and stocks run higher and higher. But there are two commodities that look ready to explode being gold and oil (actually three if you count silver).
Below are the charts of gold futures and crude oil 4 hour charts. Each candle stick is 4 hours allows us to look back 1-2 months while still being able to see all the intraday price action (pivot highs, pivot lows, strong volume spikes and if they were buyers or sellers…).
The 4 hour chart is one time frame most traders overlook but from my experience I find it to be the best one for spotting day trades, momentum trades and swing trades which pack a powerful yes quick punch.
As you can see below with the annotated charts both gold and silver are setting up for higher prices in the next 1-2 weeks from a technical point of view. That being said we may see a couple days of weakness first before they start moving up again.
4 Hour Momentum Charts of Gold & Oil:

Watch Full Video Analysis:
By: Chris Vermeulen – www.GoldAndOilGuy.com
This week may provide some trading opportunities for us if all goes well now that most traders are investors are all giddy about stocks again. Last week we saw money move out of bonds and into stocks and the bullishness vibe in the air reminds of many market peaks just before a 5%+ correction in stocks.
Depending how the SP500 unfolds we may be going long or short equities, long precious metals, long bonds, and our VXX trade may spike in our favor.

Bonds: After last week’s strong move down in bonds as the HERD moved out of bonds and into stocks it may be providing us an opportunity to catch a dip or bounce in the price of bonds. If the stock market sees strong selling this week money will run back into bonds.

Looking at precious metals it looks as though gold, gold miners and silver may still head lower this week. The charts are still bearish and pointing to another multi percent drop in value. Gold will look bullish around $1600, Gold miners (GDX) around $48, and Silver around $30 but we need to see one more wave of strong distribution selling for that to take place.

Crude oil has recovered nicely from its 5 wave correction which shook us out of the trade for a profit. I still like the chart for higher prices but with it trading at resistance and a high possibility of sellers stepping back in at this level I am not getting involved here.

The SP500 made a new high last night but has run into sellers early this morning taking prices straight back down. The chart in pre-market looks as though we will see lower stock prices later today and with any luck the fear index (VIX) will continue to rise in our favor.

Watch Live Video Analysis: http://www.thetechnicaltraders.com/ETF-trading-videos/
Chris Vermeulen
http://www.GoldAndOilGuy.com
Over the past 5 months we have seen volatility steadily decline as stocks and commodities rise in value. The 65% drop in the volatility index is now trading at a level which has triggered many selloffs in the stock market over the years as investors become more and more comfortable and greedy with rising stock prices.
Looking at the market from a HERD mentality and seeing everyone run to buy more stocks for their portfolio has me on edge. We could see a strong wave of fear/selling hit the S&P 500 Index over the next two weeks catching the masses with their hand in the cookie jar . . . again.
If you don’t know what the volatility index (VIX) is, then think of it as the fear index. It tells us how fearful/uncertain investors are or how complacent they are with rising stock prices. Additionally a rising VIX also demonstrates how certain the herd is that higher prices should continue.
The chart below shows this fear index on top with the SP500 index below and the correlation between the two underlying assets. Just remember the phrase “When the VIX is low it’s time to GO, When the VIX is high it’s time to BUY”.
Additionally the Volatility Index prices in fear for the next 30 days so do not be looking at this for big picture analysis. Fear happens very quickly and turns on a dime so it should only be used for short term trading, generally 3-15 days.
Volatility Index and SP500 Correlation & Forecast Daily Chart:

Global Issues Continue To Grow But What Will Spark Global Fear?
Everyone has to admit the stock market has been on fire since the October lows of last year with the S&P 500 Index trading up over 26%. It has been a great run, but is it about to end? Where should investors focus on putting their money? Dividend stocks, bonds, gold, or just sit in cash for the time being??
I may be able to help you figure that out.
Below is a chart of the Volatility index and the gold exchange traded fund which tracks the price of gold bullion. Notice how when fear is just starting to ramp up gold tends to be a neutral or a little weak but not long after investors start selling their shares of securities we see money flow into the shiny yellow safe haven.
Gold & Fear Go Hand-In-Hand: Daily Chart
Looking at the relationship between investor fear/uncertainty and gold you will notice scared money has a tendency to move out of stocks and into safe havens.

Trading Conclusion Looking Forward 3 months…
In short, I feel the financial markets overall (stocks, commodities, and currencies) are going to start seeing a rise in volatility meaning larger daily swings which inherently increased overall downside risk to portfolios and all open positions.
To give you a really basic example of how risk increases, look at the daily potential risk the SP500 can have during different VIX price levels:
Volatility index under 20.00 Low Risk: Expect up to 1% price gaps at 9:30am ET, and up to 5% corrections from a previous high.
Volatility index between 20 – 30 Medium Risk: Expect up to 2% price gaps at 9:30am ET, and up to 15% corrections from recent market tops or bottoms.
Volatility index over 30 High Risk: Expect 3+% price gaps at 9:30am ET, and possibly another 5-15% correction from the previous VIX reading at Medium Risk
Note on price gaps: If you don’t know what I am talking about a price gap is simply the difference between the previous day’s close at 4:00pm ET and the opening price at 9:30am ET.
To continue on my market outlook, I feel the stock market will trade sideways or possibly grind higher for the next 1-2 weeks, during this time volatility should trade flat or slightly higher because it is already trading at a historically low level. It is just a matter of time before some bad news hits the market or sellers start to apply pressure and either of these will send the fear index higher.
I hope you found this info useful and if you would like to get these reports free every week delivered to your inbox be sure to join my FREE NEWSLETTER HERE: www.GoldAndOilGuy.com
Chris Vermeulen
This morning we are seeing the US Dollar index move higher retesting a short term breakdown resistance level. What this means is that the dollar fell below support and is not slowing drifting back up to test the breakdown level. As we all know once a support level is broken it then becomes resistance. So if that holds true with the current move in the dollar we should see stocks and commodities find a short term bottom and continue higher today or tomorrow from the looks of things.

Gold has been pulling back the past couple trading session on light volume which healthy price action. It has done the opposite of what the dollar did above. Gold broke through a key resistance level and is slowly drifting back down to test the breakout level to see if it is support. If so then gold should continue higher in the coming days.

Both silver and gold miner stocks are lagging he price of gold. They have yet to break through their key resistance levels. That being said it could happen an day now as they have both been flirting with that level for a couple trading sessions now.

Crude oil continues to hold up strong and is headed straight for its key resistance levels without any real pullback. Chasing price action like this is not something do often because risk: reward is not in your favor. I am staying on the sidelines for oil until I see a setup that has more potential and less risk.

The equities market remains in a strong uptrend at this time. I do feel a 1-3 weeks pause/pullback could take place at any time but in the grand scheme of things we could be only half way through this runaway stock market rally as noted in the video.

The equities market is going to gap down this morning which is typical in a bull market. Remember. in an uptrend the stock market tends to gap lower at the open and close higher into the close. And it’s the opposite in a down trend with stocks gapping higher and sell off through the trading session.
Watch my detailed video analysis for this week: http://www.thetechnicaltraders.com/ETF-trading-videos/
Chris Vermeulen
www.TheGoldAndOilGuy.com