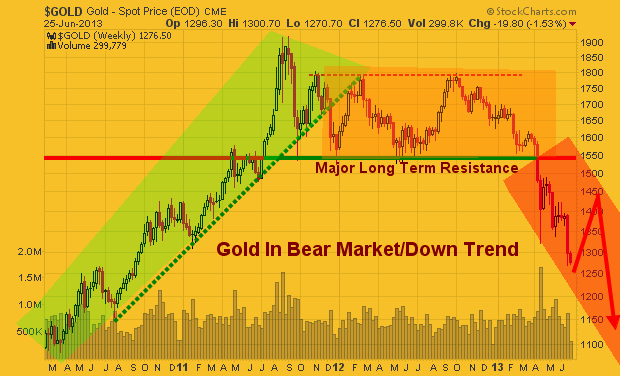
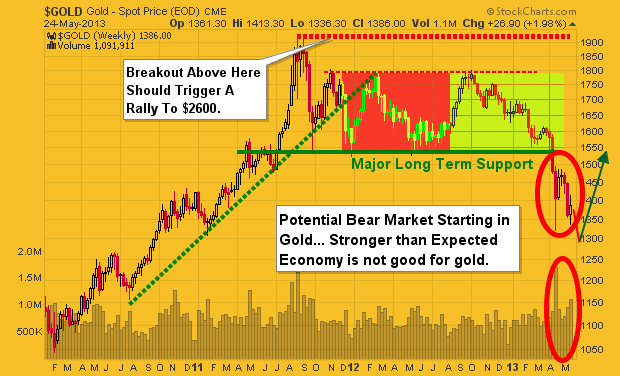
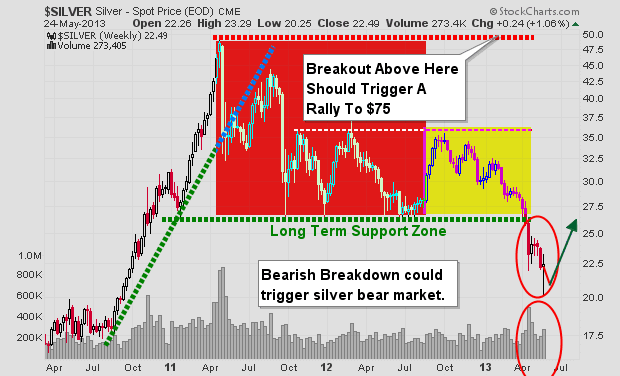
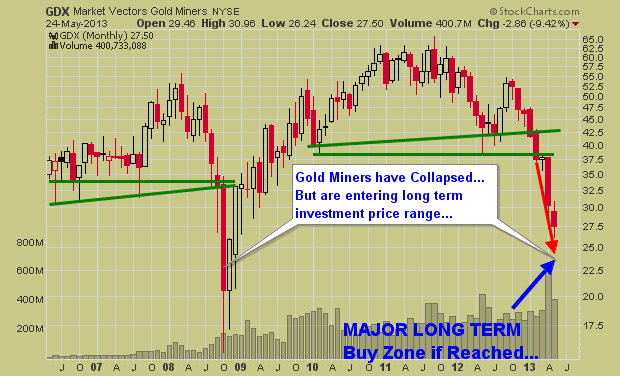
It does not matter what your specialty is for trading is we all have our own little trading secrets to help use better time our trades. While many day traders focus on individual stocks like aapl, goog, tsla etc… I like to focus on day trading gold.

Years ago I shared this little secret on how I get an edge day trading gold and it still amazes me how many of those people still use it today, including myself.

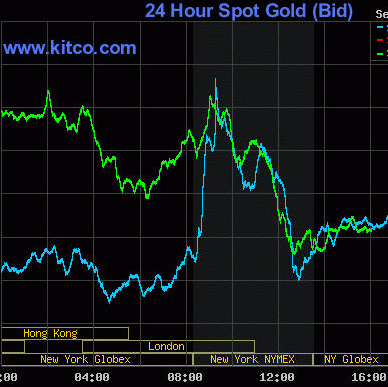
Time and time again gold traders are given great insight on how and when to day trade gold. I use the free 24hour Kitco gold chart which is shown below, and I watch it like a hawk.

It is easy to get a feel for how gold moves each day with this chart. Once you get a feel for it and see price patterns repeat themselves week after week, these opportunities quickly become an easy way to add a few trades to your day trading routine.

This Kitco day trading gold chart is an amazing tool for observing the price of gold over a 3 day time frame. What I’m going to show you is how it can provide opportunities for day trading gold.

While this chart may not look like a quality trading tool it does provides very detailed information for daytrading gold and for swing traders as they get ready to enter or exit positions. Looking at the chart below you will notice that price has similar price patterns and turning times throughout the day. Often enough the movements are very similar allowing us to take advantage of these price patterns to day trade precious metals, silver included.

Free Day Trading Gold Charts – By Kitco

Day Trading Gold


Gold Day Trading

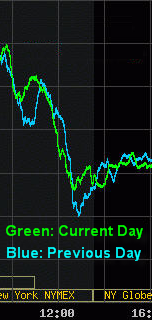
Close Up Of Spot Gold Chart

The chart below is regular trading hours only 9:30am – 4:00pm ET. You can see the price action following the previous day’s movements. Blue is the previous trading day and Green is the Current day.

When there are large price movements in gold during these hours I like to take advantage of them using the previous days price action as my guide. If you didn’t notice the Green line (Today) makes the move before the previous days move. Why? Looks to me like there are a lot of other traders out there like me getting ready for these opportunities and because its human nature to want to be first they cause the moves to happen slightly sooner than the previous day. You should factor this into your trading and be ready to take action when price looks to be starting a predicted move.


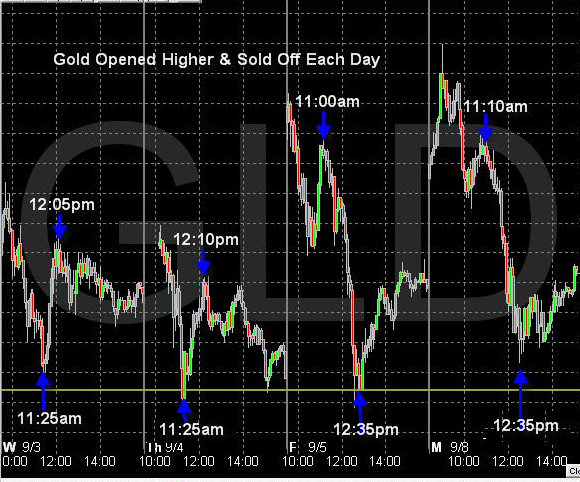
Intraday Trading Gold Chart via GLD

The chart below shows the last 4 intraday sessions for gold using the GLD ETF. As you can see these sessions had very similar price movement. This is a 5 minute chart of gold using GLD. I trade it using the 3 minute chart as it allows the best timing for entering and exiting positions and this 5 minute chart keeps my head clear for the key turning points because it is easy to get caught up in the one minute chart noise and miss the important patterns.

If you prefer trading spot golc via FOREX/CDF/Spread Betting and you are not a US resident you can use the firm which I have been using for nearly 8 years and the broker is AVAFX. The nice thing about trading this way is that you can trade 24/7, you get a lot of leverage, its commission free trading, and they have 100% signup bonuses to match the amount you deposit.


Best Gold Day Trader


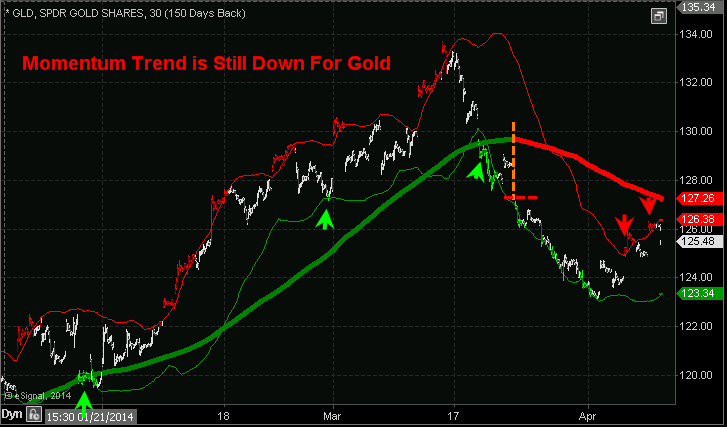
 Example Day Trading Gold Chart

Gold Trading Newsletter

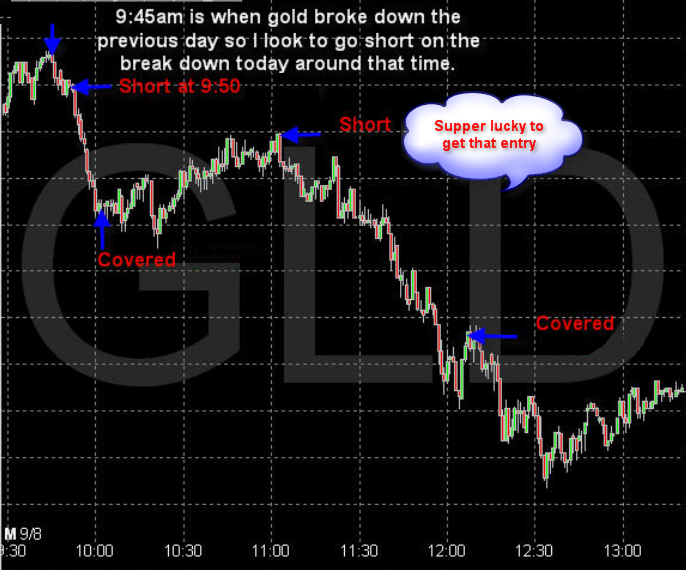
Above is the chart of GLD ETF and some actual trades. I am a very conservative trader and I like to lock in profits once I am satisfied with a move or if the chart shows any indication it may go against my position. I tend to exit trades a little too early but my focus is on catching the middle section of a trend because they are the safest areas to trade I think.

When there are no swing trading setups I focus on finding these intraday day trading gold patterns along with SP500 index and Nasdaq day trades to generate my weekly income.

My main focus for trading is swing trading ETFs and I have an automated trading system which i developed and it trades most of my capital on autopilot.

To sum things up I wait for a trend reversal or continuation pattern to form before I enter and exit positions. I am a firm believer of using breakeven stops, meaning once a position moves a certain amount in my favor I move my exit order to my entry price so that I have a risk free trade running. My swing trading goal for GLD ETF is 2-5% per trade which would last 2-10 days.

Get My Free Weekly Trade Idea Alerts: www.GoldAndOilGuy.com

Chris Vermeulen


I did a short video a while back on momentum trading gold and wanted to share it and post it in the members area of the website for you to view. It’s short and basic, but useful.

Current snap shot of gold trend…

Gold - ETF Trading Newsletter


Learn More & Trade With My Alerts with my ETF Trading Newsletter

Chris Vermeulen

The precious metal market has been stuck in a strong down trend since 2012. But the recent chart, volume and technical analysis is starting to show some signs that a bottom may have already taken place.

This report focused on the weekly and monthly charts which allow us to see the bigger picture of where the precious metals sector stands in terms of its trend.

Let’s take a look at a few charts below for a quick overview, but if you want more interesting ones visit: https://stockcharts.com/public/1992897

Gold Spot Price – Weekly Chart

This chart clearly shows the trends which gold has gone through in the last three years. With simple technical analysis trend lines, clearly price is nearing a significant apex which will result in a strong breakout in either direction.

Remember, this is the weekly chart, so we could still have another month or three of sideways chatter to work through. But a breakout in either direction will trigger a large move.

goldtrend


Silver Spot Price – Weekly Chart

Silver is also stuck in a similar pattern.  Currently the odds still favors lower prices and for the upper resistance trend line to reject price and send it lower. But if we keep out eye on the leading indicators like gold miners, we may be able to catch a breakout or traded the rejection of resistance in the next month or so.

silvertrend


Gold Mining Stock ETF – Monthly Chart

Gold miners have a very sloppy looking chart. Price is extremely volatile and the recent price action in 2013 could go either way VERY quickly. I have a gut feeling GDX in the coming months could have a washout bottom and tag the $20 price level. While I hope I am wrong for many investors sake, if it does happen, it will be a very strong investment level to accumulate a position.

gdxtrend


Precious Metals Bigger Picture Outlook:

In short, I remain neutral – bearish for this sector.  In the next 1-3 months we are likely to see some strong price action which will be great. We need a breakout or bottoming pattern to form before we get involved at this level.

I know everyone is dying to get involved in precious metals again for another huge rally… but sometimes it’s just best to wait for the big picture chart to catch up with your bias before taking a position of size.

Get My Free Weekly Trading Sector Reports
Delivered To Your Inbox: www.GoldAndOilGuy.com

It has been a bumpy ride for precious metal investors over the past couple of years and it unfortunately I do not think its over just yet.

The good news is that the bottom has likely been put in for gold, silver and gold miners BUT the recent rally in these metals and miner looks to be coming to an end. While we could see another pop in price over the next week or so the price, volume and momentum see to be stalling out.

What does this mean? It means we should expect short term weakness and lower prices over the next month or two.

Below are three charts I posted several months ago on my free stockcharts list. These forecast were based off simple technical analysis using cycles, Fibonacci and price patterns. As you can see we are not trading at my key pivot level which I expect selling pressure to start to increase and eventually overpower the buyers sending the prices lower.


Gold Trading Weekly Chart:

Here you can see that gold is technically in a bear market when viewing it on the weekly chart. If you were to pull up a daily chart you would likely notice how the price of gold is trading at a key resistance level on the chart and has reached its full flag measured move.

What does this mean? It means the odds are pointing to lower prices for gold in the next few weeks. Keep in mind though I do feel as though a major bottom has been put in place for the precious metals sector. So buyers are likely to step back in around the $1300 area.

goldoverbought


Silver Trading Weekly Chart:

Silver has a little bit different looking chart but the same analysis applies here as it did in gold.

silveroverbought


Gold Miners Trading Monthly Chart:

Gold miners may have bottomed on this monthly investing timeframe chart but the daily chart which you will see next clearly shows short term weakness has started.

GDXLongtermBottom


Gold Miners Trading Daily Chart:

This daily chart really shows my thinking for miners and the overall precious metals sector as a whole. The recent weakness in gold miners to the down side point to distribution of shares. This is very negative for the price of physical gold and silver as gold mining stocks tend to lead physical metals.

The yellow box shows a possible major stage 1 basing pattern forming. If this is the case, then we will have a great opportunity in the coming months when the precious metals down trend completes a reversal and start heading higher.

gdxoverbought


How to Trade Precious Metals & Gold Miners Conclusion:

In short, I think that staying in cash or shorting metals is the play for the next couple weeks. After that anything can happen and until price breaks down or finally completes the basing pattern and confirms a market bottom I would be very cautious trading here.

In the last week members of my trading newsletter took profits on our short SP500 trade and we closed a long trade in natural gas for a quick 6.5% gain. Join our community of traders and have your money on the right side of the market!

Chris Vermeulen
www.GoldAndOilGuy.com


The life cycle of most things not matter what it is (living, product, service, ideas etc…) go through four stages and the stock market is no different. Those who recently gave in and bought gold, silver, mining stocks, coins will be enter this stage of the market in complete denial. They still think this is a pullback and a recover should be just around the corner.

Well the good news is a recovery bounce should be nearing, but if technical analysis, market sentiment and the stages theory are correct then a bounce is all it will be followed by years of lower prices and dormancy.

I really do hate to be a mega bear or mega bull on anything long term but the charts have painted a clear picture this year for precious metals and I want to share what I see. Take a look at the chart below which shows a typical investment life cycle using the four stage theory.

The Four Stages Theory

Classic economic theory dissects the economic cycle into four distinct stages: Accumulation, Markup, Distribution, and Decline.  Stock, index or commodities are no different, and proceeds through the following cycle:

  • Stage 1 – Accumulation: After a period of decline a stock consolidates at a contracted price range as buyers step into the market and fight for control over the exhausted sellers.  Price action is neutral as sellers exit their positions and buyers begin to accumulate.
  • Stage 2 – Markup: Upon gaining control of price movement buyers overwhelm sellers and a stock enters a period of higher highs and higher lows.  A bull market begins and the path of least resistance is higher.  Traders should aggressively trade the long side, taking advantage of any pullback or dips in stock price.
  • Stage 3 – Distribution: After a prolonged increase in share price the buyers now become exhausted and the sellers again move in.  This period of consolidation and distribution produces neutral price action and precedes a decline in stock price.
  • Stage 4 – Decline: When the lows of Stage 3 are breached a stock enters a decline as sellers overwhelm buyers.  A pattern of lower highs and lower lows emerges as a stock enters a bear market.  A well-positioned trader would be aggressively trading the short side, taking advantage of the often quick decline in share price.

Stages1


Gold Price Weekly Chart – Stages Overlaid

gold11


Silver Price Weekly Chart – Stages Overlaid

silver11


Gold Mining Stocks – Monthly Chart

This chart is a longer term picture using the monthly chart. I wanted to show you the 2008 panic selling washout bottom in miners which I think is about to happen again. While physical gold and silver are in a bear market and should be some a long time, gold mining stocks will likely find support and possibly have a strong rally in the coming months.

Many gold stocks pay high dividends and are wanted by large institutions and funds. The lower prices go the higher the yield is making them more attractive. So I figure gold miners will bottom before physical metals do. A bounce is nearing but at this point selling pressure and momentum continue to plague the entire PM sector.

gdx11


Precious Metals Investing Conclusion:

In short, I feel with Quantitative Easing (QE) likely to be trimmed back later this year, and with economic numbers slowly improving along with solid corporate earnings the need or panic to buy gold or silver is diminishing around the globe.

While there are still major issues and concerns internationally they do not seem to have any affect on precious metals this year. Long terms trends like the weekly and monthly charts shown in this report tends to lead news/growth/lack of growth by several months. So lower precious metals prices may be telling us something very positive.

The precious metals sector is likely to put in a strong bounce this summer but after sellers will likely regain control to pull prices much lower yet.

Get My Daily Analysis and Trade Alerts: www.TheGoldAndOilGuy.com

Chris Vermeulen

The two most popular investments a few years ago have been dormant and out of the spot light. But from looking at the price of both gold and oil charts their time to shine may be closer than one may thing.

Seasonal charts allow us to look at what the average price for an investment does during a specific time of the year. The gold and oil seasonal charts below clearly show that we are entering a time which price tends to drift higher.

While these chart help with the overall bias of the market keep in mind they are not great at timing moves and should always be coupled with the daily and weekly underlying commodity charts.

Now, let’s take a quick look at what the god father of technical/market analysis shows in terms of market cycles and where I feel we are trading… As I mentioned last week, a picture says a thousand words so why write when I can show it visually.


John Murphy’s Business Cycle:

JMCycle

Mature Stock Market:

cycletop

Commodity Index Looks Bullish and Should Rise:

GCC

Gold & Silver Seasonality, Price Charts w/ Analysis:

 Precious Metals like gold and silver are nearing a bounce and possible major rally in the second half of this year.

GoldSeason

cycletop GCC GoldSeason i2y8euv0


Crude Oil Seasonality, Price Chart w/ Analysis:

Crude oil has been a tough one to trade in the last year. The recent 15 candles have formed a bullish pattern and with the next few months on the seasonal chart favoring higher prices it has been leaning towards the bullish side.

OilSeason

oil1


Commodity, Gold & Oil Cycle and Seasonality Conclusion:

In short, I feel the equities market is nearing a significant top in the next couple weeks. If this is the case money will soon start flowing into commodities in general as more of the safe haven play. To support this outlook I am also factoring in a falling US dollar. Based on the weekly dollar index chart it looks as though a sharp drop in value is beginning. This will naturally lift the price of commodities especially gold and silver.

It is very important to remember that once a full blown bear market is in place stocks and commodities including gold and silver will fall together. I feel we are beginning to enter a time with precious metals will climb but it may not be as much as you think before selling takes control again.

Final thought, This could be VERY bullish for the Canadian Stock Market (Toronto Stock Exchange) as it is a commodity rich index. While the US may have a pullback or crash Canadian stocks may hold up better in terms of percentage points.

FATHERS DAY SPECIAL: 25% Off Membership Today!

Get My Daily Video, Updates & Alerts Here: www.TheGoldAndOilGuy.com

Chris Vermeulen

It has been a very long couple of years for the precious metal bugs. The price of gold, silver and their related mining stocks have bucked the broad market up trend and instead have been sinking to the bottom in terms of performance.

Earlier this week I posted a detailed report on the broad stock market and how it looks as though it‘s uptrend will be coming to an end sooner than later. The good news is that precious metals have the exact flip side of that outlook. They appear to be bottoming as they churn at support zones.

While metals and miners remain in a down trend it is important to recognize and prepare for a reversal in the coming weeks or months. Let’s take a look at the charts for a visual of where price is currently trading along with my analysis overlaid.

Weekly Price of Gold Futures:

Gold has been under heavy selling pressure this year and it still may not be over. The technical patterns on the chart show continued weakness down to the $1300USD per once which would cleanse the market of remaining long positions before price rockets towards $1600+ per ounce.

There is a second major support zone drawn on the chart which is a worst case scenario. But this would likely on happen if US equities start another major leg higher and rally through the summer.

PriceOfGold


Weekly Price of Silver Futures:

Silver is a little different than gold in terms of where it stands from a technical analysis point of view. The recent 10% dip in price which shows on the chart as a long lower candle stick wick took place on very light volume. This to me shows the majority of weak positions have been shaken out of silver. Gold has not done this yet and it typically happens before a bottom is put in.

While I figure gold will make one more minor new low, silver I feel will drift sideways to lower during until gold works the bugs out of the chart.

PriceOfSilver


Silver Mining Stock ETF – Weekly Chart:

Silver miners are oversold and trading at both horizontal support and its down support trendline. Volume remains light meaning traders and investors are not that interested in them down where and it should just be a matter of time (weeks/months) before they build a basing pattern and start to rally.

SilverMiningStocksETF


Gold Mining Stock ETF – Weekly Chart:

Gold mining stocks continue to be sold by investors with volume rising and price falls. Fear remains in control but that may not last much longer.

GOldMiningStocksETF

Gold Junior Mining Stock ETF – Weekly Chart:

Gold junior miners are in the same boat with the big boys. Overall gold and gold miners are still being sold while silver and silver stocks are firming up.

GoldJuniorMiningStocksETF


Precious Metals Trading Conclusion:

In the coming weeks we should see the broad stock market top out and for gold miners along with precious metals bottom. There are some decent gains to be had in this sector for the second half of the year but it will remain very dicey at best.

If selling in the broad market becomes intense and triggers a full blown bear market money will be pulled out of most investments as cash is king. Gold is likely to hold up the best in terms of percentage points but mining stocks will get sucked down along with all other stocks for a period of time. This scenario is not likely to be of any issue for a few months yet but it’s something to remember.

Get My Daily Precious Metals Report Each Morning And Profit!
www.TheGoldAndOilGuy.com
Chris Vermeulen

Precious metals and their related mining stocks continue to underperform the broad market. This year’s heavy volume breakdown below key support has many investors and trader’s spooked creating to a steady stream of selling pressure for gold and silver bullion and mining stocks.

While the technical charts are telling me prices are trying to bottom we must be willing to wait for price to provide low risk entry points before getting involved. Precious metals are like any other investment in respect to trading and investing in them. There are times when you should be long, times to be in cash and times to be short (benefit from falling prices). Right now and for the last twelve months when looking at precious metals cash has been king.

Since 2011 when gold and silver started to correct the best position has been to move to cash or to sell/write options until the next trend resumes. This is something I have been doing with my trading partner who focuses solely on Options Trading who closed three winning positions last week for big gains.

In 2008 we had a similar breakdown in price washing the market clean of investors who were long precious metals. If you compare the last two breakdowns they look very similar. If price holds true then we will see higher prices unfold at the end of 2013.

The key here is for the price to move and hold above the major resistance line. A breakout would trigger a rally in gold to $2600 – $3500 per ounce. With that being said gold and silver may be starting a bear market. Depending what the price does when the major resistance zone is touched, my outlook may change from bullish to bearish. Remember, no one can predict the market with 100% accuracy and each day, week and month that passes changes the outlook going forward.

The chart below is on I drew up on May 3rd. I was going to get a fresh chart and put my analysis on it but to be honest my price forecast/analysis has been spot on thus far and there is no need to update.

LongTermWeeklyGold

Gold Daily Technical Chart Showing Bottoming Process:

Major technical damage has been done to the chart of gold. Gold is trying to put in a bottom but still needs more time. I feel gold will make a new low in the coming month then bottom as drawn on the chart below.

Gold27

Silver Daily Technical Chart Showing Bottoming Process:

Silver is in a similar as gold. The major difference between gold and silver is that silver dropped 10% early one morning this month which had very light volume. The fact that silver hit my $20 per ounce level and it was on light volume has me thinking silver has now bottomed.

But, silver may flounder at these prices or near the recent lows until its big sister (gold) puts in a bottom.

SIlver27

Gold Mining Stocks Monthly Investing Zone Chart:

Gold mining stocks broke down a couple months ago and continue to sell off on strong volume. If precious metals continue to move lower then mining stocks will continue their journey lower.

This updated chart which I originally drew in February warning of a breakdown below the green support trend lines would signal a collapse in stock prices, which is exactly what has/is taking place. While I do not try to pick bottoms (catch falling knives) I do like to watch for them so I am prepared for new positions when the time and chart turn bullish or provide a low risk probing entry point.

While I focus more on analysis, forecasts and ETF trading another one of my trading partners who focuses on Trading Stocks and 3x Leveraged ETF’s has been cleaning up with gold miners.

GDX27

Gold, Silver and Mining Stocks Conclusion:

Precious metals continue to be trending down and while they look to be trying to bottom it is important to remember that some of the biggest percent moves take place in the last 10% of a trend. So we may be close to a bottom on the time scale but there could be sharply lower prices yet.

The time will come when another major signal forms and when it does we will be getting involved. The exciting this is that it could be just around the corner. So if you want to keep current and take advantage of the next major moves in the market be sure to join our newsletters.

Join My Newsletter Memorial Day Special 50% Discount: http://www.TheGoldAndOilGuy.com/

Chris Vermeulen