Protecting Yourself with GOLD, Oil and Index ETF’s

Chris-VIn 2009 I shared my big picture analysis, investment forecast and strategy in a book called “NEW WORLD ORDER ECONOMICS – What you can do to protect yourself”.  In January 2009 I forecasted that the Dow Jones Industrial Average was going to make a bottom within a couple months which it did. I also predicted the price of gold to start another major rally, and for crude oil to bottom and rally for years, which were also correct.

You can call it luck, skill or a mix of both… but the truth is that the markets cannot be predicted with 100% certainty. With that said, the US stock market, gold and oil look to be setting up for their NEXT BIG multiyear moves.


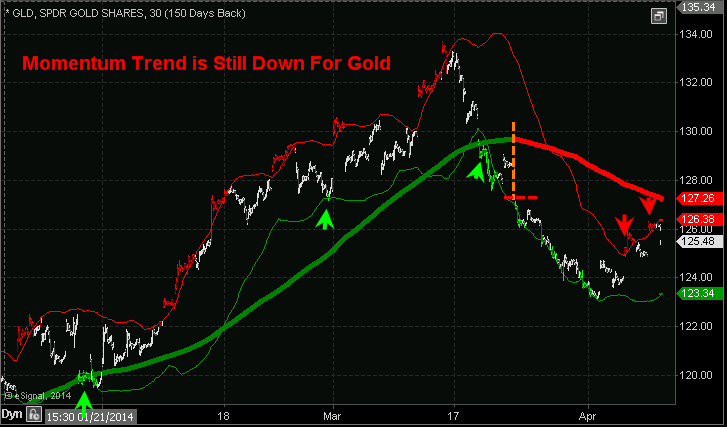
GOLD BEAR MARKET IS ABOUT TO END

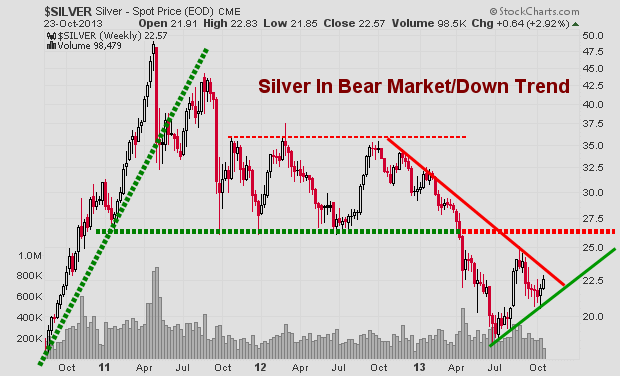
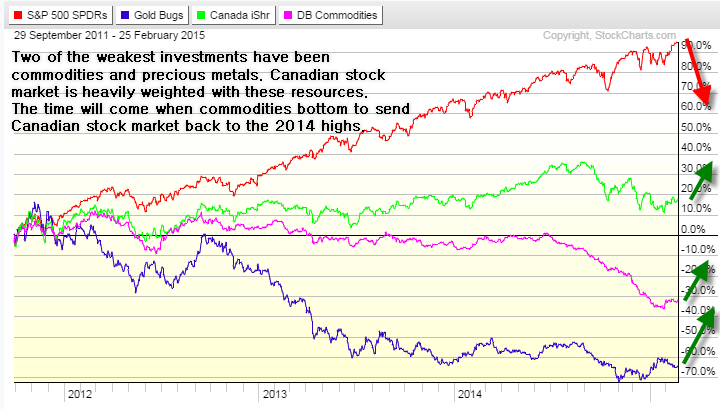
Gold and silver have a little trickier of a situation to navigate and invest for maximum returns over the next 2+ years.

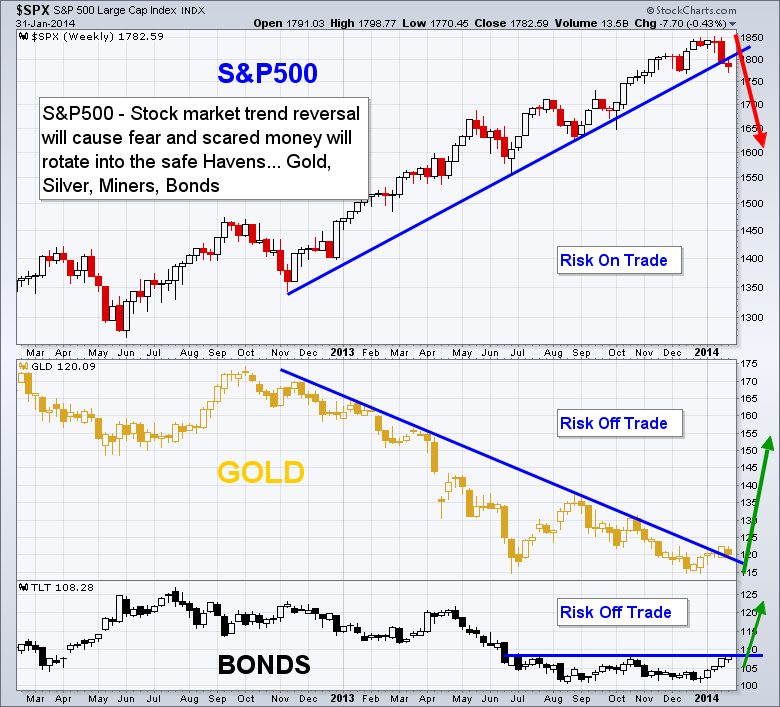
The most important thing to realize is that when a full blown bear market starts virtually all stocks and commodities drop including gold, silver and oil. Knowing that, investors must be aware that when the stock market starts its bear market the fear will rise and investors will inevitably sell their holdings and this means we could see gold and oil continue to fall much further from these levels before a true bottom is in place.

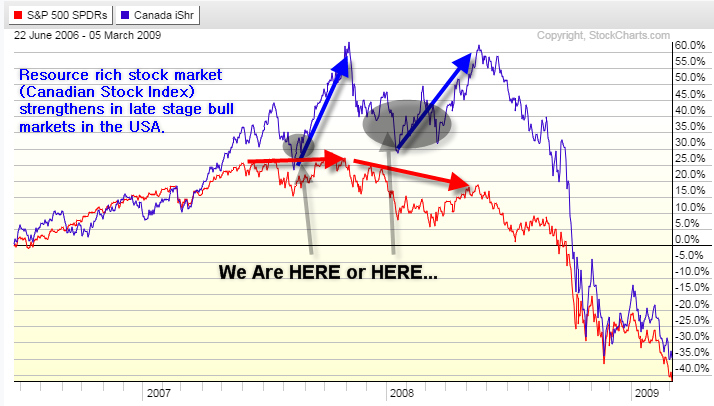
Is this time different than the 2008/09 bear market? Yes, this time we have possible wars starting, oil pipelines overseas being cut off, counties and currencies failing and even negative bond yields in some parts of the world – it’s a mess to say the least. There are a lot of things unfolding, most seem to be negative for the economy.

The currency problems and possible war breakout will be bullish for gold and oil. So if a bear market starts in equities, and a war or currency fails gold and oil should rally while stocks fall.

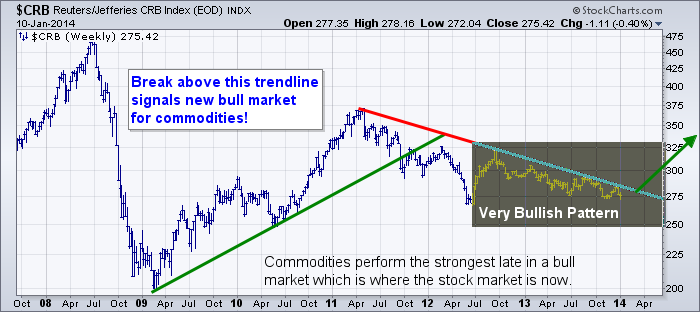
But if we don’t have those sever crisis’ then if gold and oil break below their critical support level which is the red line on the charts and a bear market in stocks start you do not want to be long stocks or commodities.

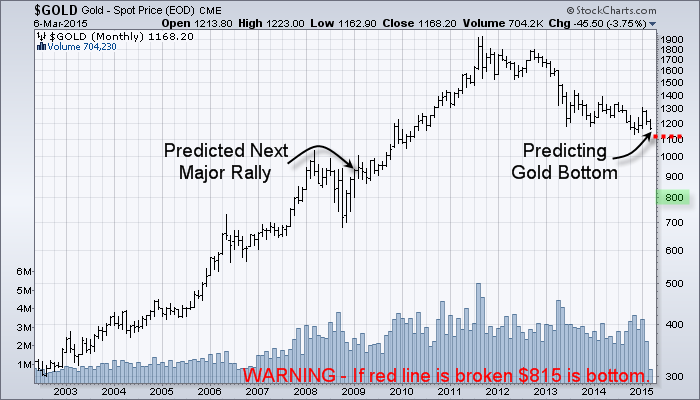
I have drawn a line in the sand for gold at $1050. If this level is broken then $815 per/ounce is not out of the question. It seems everyone is bullish on precious metals and have been buying like crazy. But as I wrote in 2009 this bullish sentiment actually pointing to much lower prices if support is broken.

gold etf newsletter

LISTEN TO LIVE FORECAST OF GOLD & OIL

howegold
Click Here


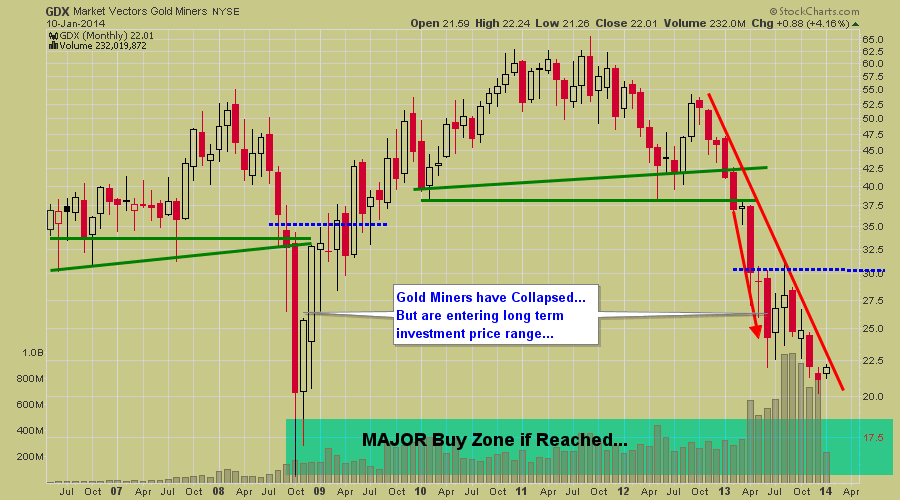
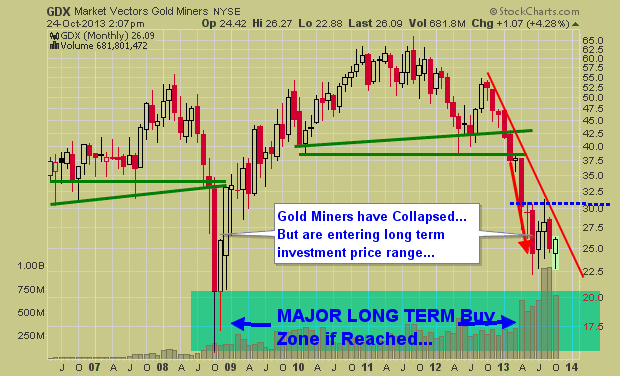
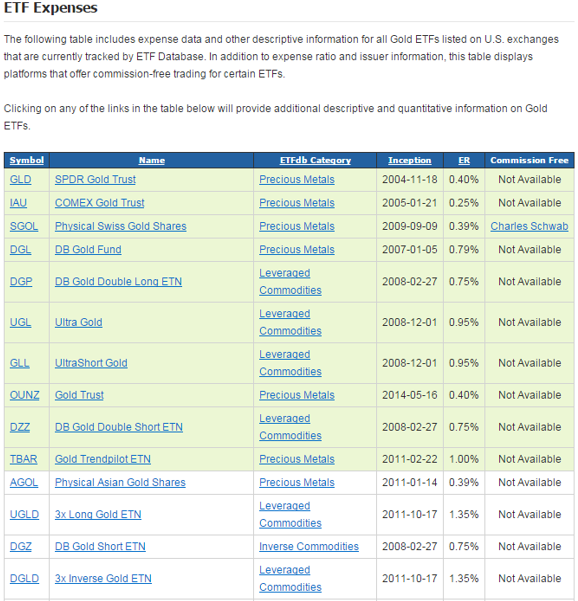
Below are some ETFs that can be used to take advantage of rising gold prices. While there are other funds that cover gold miners I feel they may not perform well during the equities bear market. Investing in physical gold is the best play at this stage of the game but when the equities bear market looks to be nearing an end, gold mining stocks will be the best place to be.

gold etf fund alerts


PART 2 CONCLUSION:

In this article we talked about gold and gold stocks which are showing signs of a major bottom being put in place this year. And in the next article PART 3 I will who you what to expect long term for crude oil, how we are up 28% in our short oil trade, and how you can play this multi-year cycle bottom when the time is right.

In the meantime, be sure to join my Free Newsletter so that you receive PART 3 along with more trade ideas: www.GoldAndOilGuy.com

Chris Vermeulen

Seasoned investors understand that investments which are rocketing to new highs and all over the news will eventually fall out of favor and become a the poor performer, unwanted by market participants.

So it only makes sense that the underperforming investments will some day come back to life and provide opportunity once again. I covered this unique stage analysis in great detail in another report linked below.

If you want to see my forecast and charts I did on June 26th, 2013 pointing to the key investment levels for precious metals and miners which by the way have been dead READ HERE.

Current Stock Market & Commodity Investment Analysis

Two of the weakest investments have been commodities and precious metals since 2011. The Canadian stock market is heavily weighted with these resource stocks and is the reason for its under performance when compared to the SP500.

The time will come when commodities bottom and this will send the Canadian stock market back to the 2014 highs or better.

Take a look at the chart below. You will see the SP500, gold miner index, Canadian market, and the commodity index. What you notice see is that the US stock market has been the hot investment of choice, while commodities and precious metals have been falling for years.

No one is excited about investing in commodities or precious metals, and it makes sense. Anyone holding these investments has had a terrible couple of years and lost most of their capital. The last thing they want to do is buy more.

The good news is that this mind set eventually creates huge opportunities for the savvy, patient, investor like you and I. The hardest part is waiting for the psychology of investors to be completely out of favor, and only then can an investment bottom. This often takes years, and it has been for resources.

Gold Trading Newsletter

The 2007-2008 Resource Double Top and Drop & Gold Forecast

Bull market tops take months 6-12 months to form before price truly rolls over and starts a bear market. Most traders and investor try to pick tops but because this process is so painfully long, most get shaken out or give up well before the top has completed it’s topping phase.

What I am interested in is the Canadian index and resource type plays. The US stock market looks and feels as though it’s trying to form a topping phase but it is at best 6-12 months away from being a confirmed bear market.

Until then, I feel the US stock market will struggle and the focus should be put on investments that come to life during this stage of the stock market and economic life cycle.

Precious Metals Trading Newsletter

The Dead Always Come Back To Life for One More Rally

In short, I feel resources and the Canadian stock market will become strong areas of the market going forward several months. There are a few ways to play this, and timing will be crucial. My gold forecast I gave to subscribers today for short term trading looks like it could be a 25% mover.

You can follow my coattails as I trade at www.TheGoldAndOilGuy.com

Chris Vermeulen

It does not matter what your specialty is for trading is we all have our own little trading secrets to help use better time our trades. While many day traders focus on individual stocks like aapl, goog, tsla etc… I like to focus on day trading gold.

Years ago I shared this little secret on how I get an edge day trading gold and it still amazes me how many of those people still use it today, including myself.

Time and time again gold traders are given great insight on how and when to day trade gold. I use the free 24hour Kitco gold chart which is shown below, and I watch it like a hawk.

It is easy to get a feel for how gold moves each day with this chart. Once you get a feel for it and see price patterns repeat themselves week after week, these opportunities quickly become an easy way to add a few trades to your day trading routine.

This Kitco day trading gold chart is an amazing tool for observing the price of gold over a 3 day time frame. What I’m going to show you is how it can provide opportunities for day trading gold.

While this chart may not look like a quality trading tool it does provides very detailed information for daytrading gold and for swing traders as they get ready to enter or exit positions. Looking at the chart below you will notice that price has similar price patterns and turning times throughout the day. Often enough the movements are very similar allowing us to take advantage of these price patterns to day trade precious metals, silver included.

Free Day Trading Gold Charts – By Kitco

Day Trading Gold


Gold Day Trading

Close Up Of Spot Gold Chart

The chart below is regular trading hours only 9:30am – 4:00pm ET. You can see the price action following the previous day’s movements. Blue is the previous trading day and Green is the Current day.

When there are large price movements in gold during these hours I like to take advantage of them using the previous days price action as my guide. If you didn’t notice the Green line (Today) makes the move before the previous days move. Why? Looks to me like there are a lot of other traders out there like me getting ready for these opportunities and because its human nature to want to be first they cause the moves to happen slightly sooner than the previous day. You should factor this into your trading and be ready to take action when price looks to be starting a predicted move.


Intraday Trading Gold Chart via GLD

The chart below shows the last 4 intraday sessions for gold using the GLD ETF. As you can see these sessions had very similar price movement. This is a 5 minute chart of gold using GLD. I trade it using the 3 minute chart as it allows the best timing for entering and exiting positions and this 5 minute chart keeps my head clear for the key turning points because it is easy to get caught up in the one minute chart noise and miss the important patterns.

If you prefer trading spot golc via FOREX/CDF/Spread Betting and you are not a US resident you can use the firm which I have been using for nearly 8 years and the broker is AVAFX. The nice thing about trading this way is that you can trade 24/7, you get a lot of leverage, its commission free trading, and they have 100% signup bonuses to match the amount you deposit.


Best Gold Day Trader


 Example Day Trading Gold Chart

Gold Trading Newsletter

Above is the chart of GLD ETF and some actual trades. I am a very conservative trader and I like to lock in profits once I am satisfied with a move or if the chart shows any indication it may go against my position. I tend to exit trades a little too early but my focus is on catching the middle section of a trend because they are the safest areas to trade I think.

When there are no swing trading setups I focus on finding these intraday day trading gold patterns along with SP500 index and Nasdaq day trades to generate my weekly income.

My main focus for trading is swing trading ETFs and I have an automated trading system which i developed and it trades most of my capital on autopilot.

To sum things up I wait for a trend reversal or continuation pattern to form before I enter and exit positions. I am a firm believer of using breakeven stops, meaning once a position moves a certain amount in my favor I move my exit order to my entry price so that I have a risk free trade running. My swing trading goal for GLD ETF is 2-5% per trade which would last 2-10 days.

Get My Free Weekly Trade Idea Alerts: www.GoldAndOilGuy.com

Chris Vermeulen


Gold Forecast Prediction
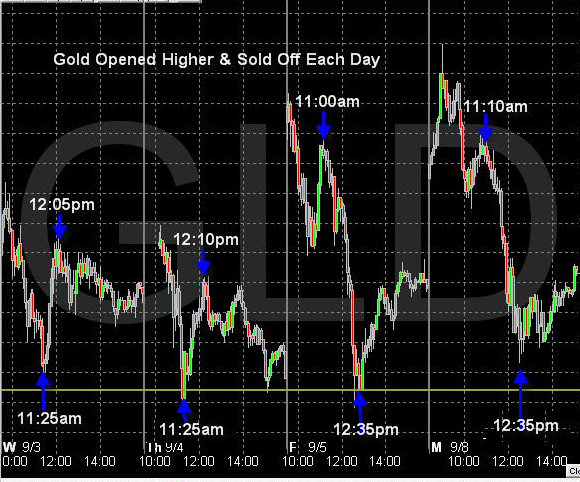
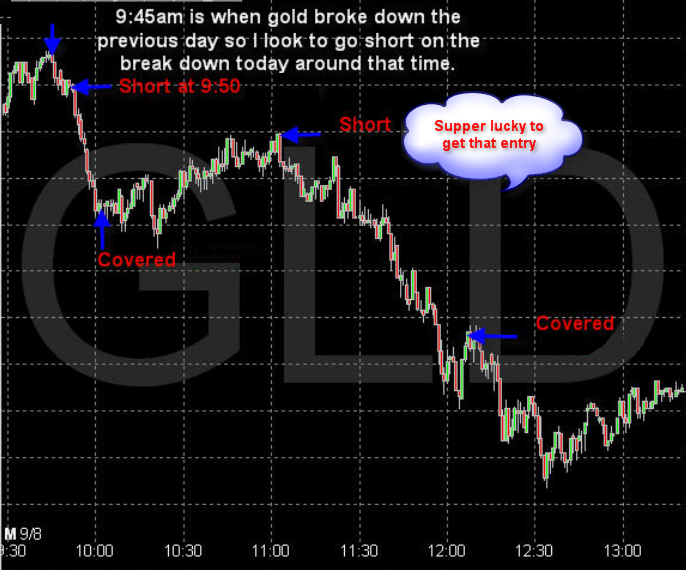
Back on April 9th I posted a short tutorial on how to momentum trade gold along with my short term gold forecast.

Today I wanted to do a follow up video for my gold market traders for three reasons:

1. I had lots of great feedback from traders taking advantage of what I showed to profit in the past week.

2. To show you how and why this strategy works better with gold stocks and silver stocks.

3. To provide my short term gold forecast so you are on the right side of the market for next week.

4. Also you should see my major long term Gold Forecast

Get My Gold Forecast & Gold Trade Alerts: www.TheGoldAndOilGuy.com

Chris Vermeulen

I did a short video a while back on momentum trading gold and wanted to share it and post it in the members area of the website for you to view. It’s short and basic, but useful.

Current snap shot of gold trend…

Gold - ETF Trading Newsletter


Learn More & Trade With My Alerts with my ETF Trading Newsletter

Chris Vermeulen

Recent price action in the stock market has many traders on edge. With the market closing below our key support trend line last week, the market has now technically starting a down trend.

While trend lines are a great tool for identifying a weakening trend and reversals in the market, I do not put a lot of my analysis weighting on them.

Most of my timing and trading is based around what I call INNER-Market Analysis (Market Stages, Cycles, Momentum and Sentiment). Using these data we can diagnose the overall health of the market. Knowing the strength of the market we can then forecast short term trend reversals before they happen with a high degree of accuracy.

In this report I keep things clean and simple using just trend lines. During the last three weeks we have seen the price of stocks pullback. And because 2013 was such a strong year for stocks most participants are expecting a sharp market correction to take place anytime now.

So with the recent price correction fear is starting to enter the market and money is rotating out of stocks and into the Risk-Off assets like gold and bonds.

Stocks tend to fall in times of economic uncertainty or fear. These same factors push investors towards the safety trades (Risk-Off) high quality bonds and precious metals. As more money goes from risk-on to risk-off, stocks will continue to fall and the safety trades will rise. The move by investors to select the safety of gold and bonds compared to the volatility of stocks will result in these risk plays to moving in opposite directions.

Let’s take a look at the chart below for a visual of what looks to be unfolding…

Gold Trading Newsletter

How to Trade These Markets:

While these markets look to be starting to reverse trends, it is critical that we understand how the market moves during reversals and understand position/money management.

Getting short stocks and long precious metals in the long run could work out very well, but if you understand the price action that typically happens during reversals you know that the stock market will become choppy and we could see the recent highs tested or possibly even a new high made before price actually starts a down trend. And the opposite situation for gold and bonds. Drawdowns can be huge when investing and why I don’t just change position directions when the first sign of a trend change shows up on the chart.

Price reversals are a process, not an event. So it is important to follow along using a short term time frame like the daily chart and play the intermediate trends that last 4-12 weeks in length. By doing this, you are trading in the direction of the most active cycle in the stock market and positioned properly as new a trend starts.


What I am looking for in the next week or two:

1. Stocks to trade sideways or drift higher for 3-6 days, then I will be looking to get short. Again, cycle, sentiment, and momentum analysis must remain down for me to short the market. If they turn back up I will remain in cash until a setup for another short or long entry forms.

2. Gold remains in a down trend but is starting to breakout to the upside. I do have concerns with the daily chart patterns for both gold and silver, so next week will be critical for them. We will be using some ETF Trading Strategies to take advantage of these moves.

3. Bond prices (not yields) look to be forming a bottom “W” pattern. They have had a big run in the last few weeks and are now testing resistance. I think a long bond position is slowly starting to unfold but if we look at the futures price charts for both bonds and gold, they have not yet broken to the upside and have more work to do. As mentioned before ETFs are not really the best tool for charting but I show them because they what the masses follow and trade.

Get these reports every week free at: www.GoldAndOilGuy.com

Chris Vermeulen
Author of “Technical Trading Mastery – 7 Steps To Win With Logic


2013 was one of the worst years for gold in a generation and the strangest part of it is that this loss came during a time in what should have been a banner year for gold.

When the Fed launched its QE1 and QE2 programs, gold posted huge gains but with QE3, we only had a brief rally in late 2012, it’s been all downhill form there.

The price of gold over the last year highlights just how much Europe has become a powerful driver behind gold vs. the US which has historically been the main mover. When the European debt crisis started a few years ago, people fearing a financial meltdown in Europe put a lot of their money into gold as it was the save haven of choice.

However, with financial and political risk in Europe subsiding, we have seen money leave gold and move into other markets, hence the big outflows from gold ETF’s.

Other factors that have dragged on gold over the last year include falling jewelry demand, the loss of its role as an inflation hedge with deflation becoming more of a concern in some areas, also tax increases on gold imports in India, and the supposedly improving economy in the US. All these contributed to the selling of gold.

Gold and gold stocks crashed last year in the summer. They have since been going through a stage one base. This suggests that 2014 will mark the start of a new bull market for gold, gold mining stocks and commodities. The commodity sector as a whole should be your focus in the coming months if you want to be able to invest in something for longer than a few days or weeks and make a huge amount of money be sure to check out my gold newsletter.

Gold Market Traders & Manipulators Provide Contrarian Bullish Outlook

Gold market traders and manipulators like some of the commercial banks/brokerage firms have been verbally slamming gold, and it turns out many are not as negative as lead us to believe…

Goldman Sachs we all know are the biggest hypocrites. While advising clients to sell gold in the second quarter of 2013, they bought a stunning 3.7 million shares of the GLD. And when Venezuela needed to raise cash and sell its gold, guess who jumped in to handle the transaction? Yup, GS! So while they tell everyone to sell gold, they are accumulating as much as they can without being obvious.

There is a lot more reasons and fundamentals to be bullish on commodities and gold, but that is not the point of this technical based report.

Weekly CRB Commodity Index – Bull Market Cycle About To Start

Taking a quick look at the CB index which is a basket of commodities, it looks as though a breakout above its down trend line will trigger a new bull market in the commodity sector. While this has not yet happened it looks as though it may happen in the next few months.

On stock market that recently broke out of a Stage 1 basing pattern (new bull market) is the Toronto Stock Exchange. This index is heavily weighted with commodity based stocks. I talk about this more in my new long-term algorithmic trading newsletter.

CRB-Bull


In this report I want to show you some interesting charts that are pointing to a new gold bull market cycle which looks to be starting.

The chart below of the gold miner’s bullish percent index is often misread by many traders and trade off its information incorrectly. Many for example think this index is based on stocks trading above a moving average which is no correct.

How a bullish percent index is calculated is based on Point & Figure buy and sell signals with each individual stock within the sector and in our case the gold minders ETF GDX.

Gold prices peaked in 2011 at $1923 an ounce when the gold mining stocks index was above 80%. Why is this important? Because gold stocks typically lead the price of gold in both directions, tops and bottoms.

As of today we have the reverse situation with the bullish percent index at 13% and showing bullish divergence from that of gold stocks. This is an early signal that the new gold bull market cycle is turning up and it should not be overlooked.

Also we see the 5th and final Elliott wave pattern forming and we could once again witness another multi year rally in the price of gold.

Gold Mining Bullish Percent Index – Weekly Chart

Gold Newsletter

Gold Miners ETF – Monthly Chart

Gold stocks have not yet broken out to start a rally as you can see in the chart below. But the important thing to note is that the daily chart has formed a mini Stage 1 Basing patterns and could breakout this week to kick start a multi month/year rally.

Gold Market Traders

Gold & Gold Stock Bull Market Conclusion:

If you have been following me for a while, you know I don’t try to be a hero and pick tops or bottoms. We all know that strategy is a losing one over the long run.

Since 2011 I have been a very dormant gold trader. Why? Because the price and technical indicators topped out and confirmed a massive consolidation or bear market was in motion.

With gold, gold stocks and precious metals about to start a new bull market, it is time to get back to trading gold and gold stocks.

You can get my daily gold, silver and gold stock analysis every morning with my gold newsletter and save 50% on your membership by joining today!
Gold Newsletter Special

Get My Gold & Gold Stock Trading Alerts And Save 50% Today! http://www.thegoldandoilguy.com/signup.php

Chris Vermeulen
Get My New Book: “Technical Trading Mastery – 7 Steps To Win With Logic

7 Steps To Win With Logic

The precious metal market has been stuck in a strong down trend since 2012. But the recent chart, volume and technical analysis is starting to show some signs that a bottom may have already taken place.

This report focused on the weekly and monthly charts which allow us to see the bigger picture of where the precious metals sector stands in terms of its trend.

Let’s take a look at a few charts below for a quick overview, but if you want more interesting ones visit: https://stockcharts.com/public/1992897

Gold Spot Price – Weekly Chart

This chart clearly shows the trends which gold has gone through in the last three years. With simple technical analysis trend lines, clearly price is nearing a significant apex which will result in a strong breakout in either direction.

Remember, this is the weekly chart, so we could still have another month or three of sideways chatter to work through. But a breakout in either direction will trigger a large move.

goldtrend


Silver Spot Price – Weekly Chart

Silver is also stuck in a similar pattern.  Currently the odds still favors lower prices and for the upper resistance trend line to reject price and send it lower. But if we keep out eye on the leading indicators like gold miners, we may be able to catch a breakout or traded the rejection of resistance in the next month or so.

silvertrend


Gold Mining Stock ETF – Monthly Chart

Gold miners have a very sloppy looking chart. Price is extremely volatile and the recent price action in 2013 could go either way VERY quickly. I have a gut feeling GDX in the coming months could have a washout bottom and tag the $20 price level. While I hope I am wrong for many investors sake, if it does happen, it will be a very strong investment level to accumulate a position.

gdxtrend


Precious Metals Bigger Picture Outlook:

In short, I remain neutral – bearish for this sector.  In the next 1-3 months we are likely to see some strong price action which will be great. We need a breakout or bottoming pattern to form before we get involved at this level.

I know everyone is dying to get involved in precious metals again for another huge rally… but sometimes it’s just best to wait for the big picture chart to catch up with your bias before taking a position of size.

Get My Free Weekly Trading Sector Reports
Delivered To Your Inbox: www.GoldAndOilGuy.com

Get My Daily Video, Intraday Updates & Trades Today!
www.TheGoldAndOilGuy.com

Chris Vermeulen