Seasoned investors understand that investments which are rocketing to new highs and all over the news will eventually fall out of favor and become a the poor performer, unwanted by market participants.

So it only makes sense that the underperforming investments will some day come back to life and provide opportunity once again. I covered this unique stage analysis in great detail in another report linked below.

If you want to see my forecast and charts I did on June 26th, 2013 pointing to the key investment levels for precious metals and miners which by the way have been dead READ HERE.

Current Stock Market & Commodity Investment Analysis

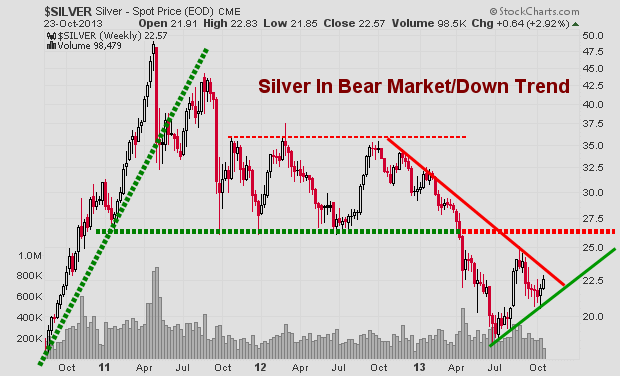
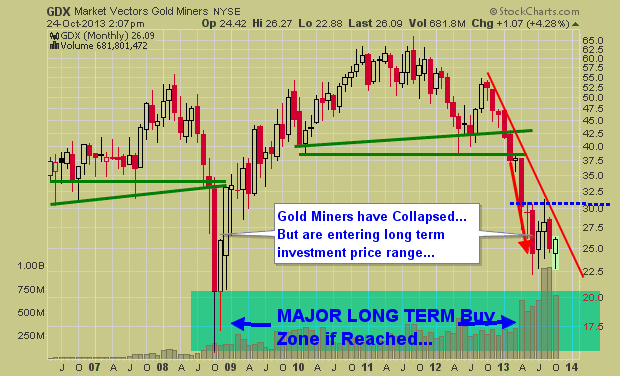
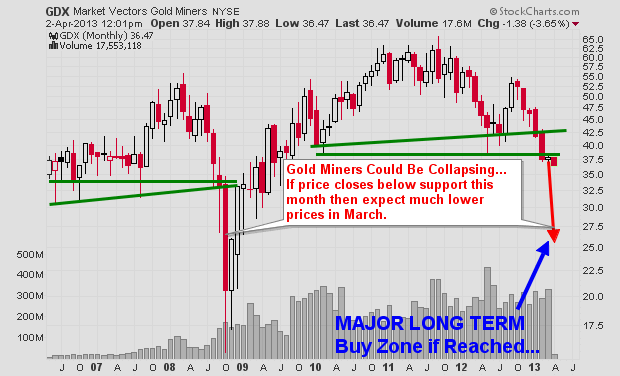
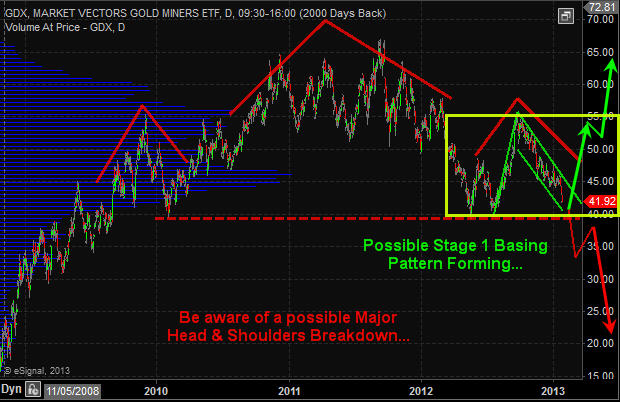
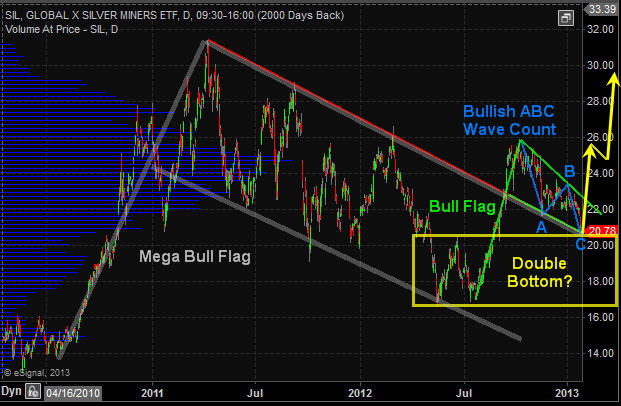
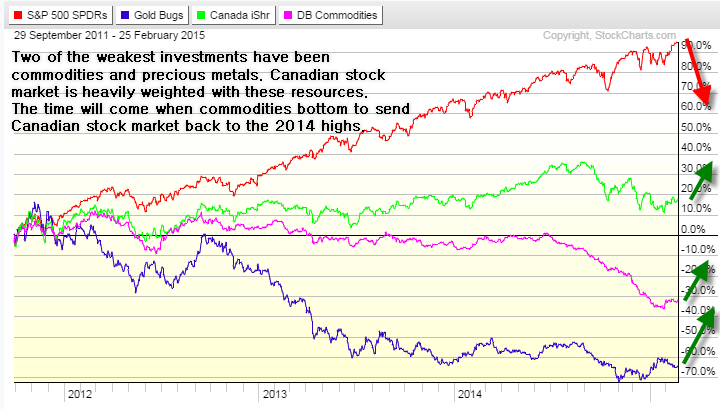
Two of the weakest investments have been commodities and precious metals since 2011. The Canadian stock market is heavily weighted with these resource stocks and is the reason for its under performance when compared to the SP500.

The time will come when commodities bottom and this will send the Canadian stock market back to the 2014 highs or better.

Take a look at the chart below. You will see the SP500, gold miner index, Canadian market, and the commodity index. What you notice see is that the US stock market has been the hot investment of choice, while commodities and precious metals have been falling for years.

No one is excited about investing in commodities or precious metals, and it makes sense. Anyone holding these investments has had a terrible couple of years and lost most of their capital. The last thing they want to do is buy more.

The good news is that this mind set eventually creates huge opportunities for the savvy, patient, investor like you and I. The hardest part is waiting for the psychology of investors to be completely out of favor, and only then can an investment bottom. This often takes years, and it has been for resources.

Gold Trading Newsletter

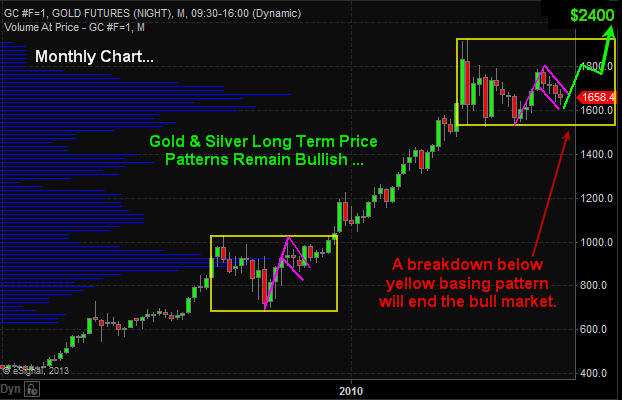
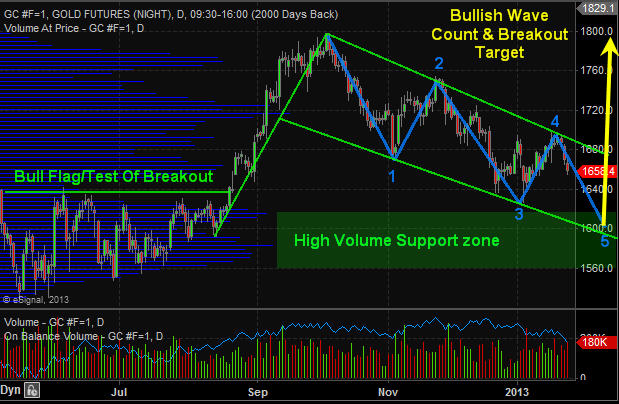
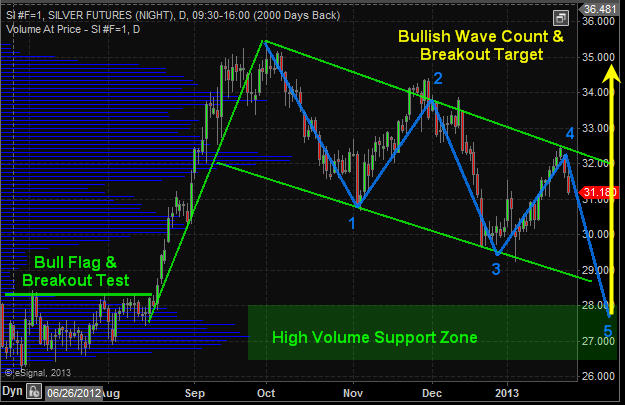
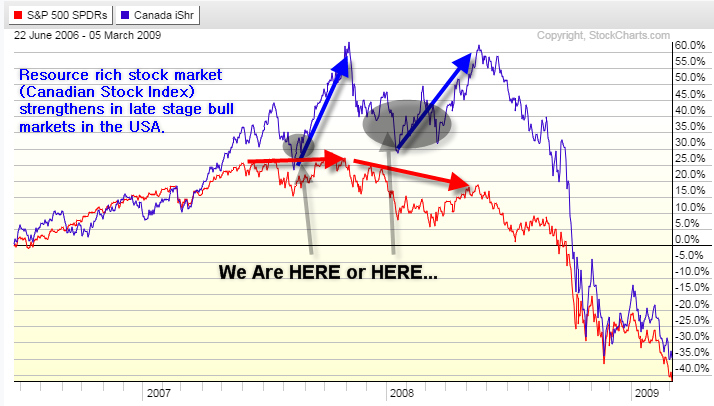
The 2007-2008 Resource Double Top and Drop & Gold Forecast

Bull market tops take months 6-12 months to form before price truly rolls over and starts a bear market. Most traders and investor try to pick tops but because this process is so painfully long, most get shaken out or give up well before the top has completed it’s topping phase.

What I am interested in is the Canadian index and resource type plays. The US stock market looks and feels as though it’s trying to form a topping phase but it is at best 6-12 months away from being a confirmed bear market.

Until then, I feel the US stock market will struggle and the focus should be put on investments that come to life during this stage of the stock market and economic life cycle.

Precious Metals Trading Newsletter

The Dead Always Come Back To Life for One More Rally

In short, I feel resources and the Canadian stock market will become strong areas of the market going forward several months. There are a few ways to play this, and timing will be crucial. My gold forecast I gave to subscribers today for short term trading looks like it could be a 25% mover.

You can follow my coattails as I trade at www.TheGoldAndOilGuy.com

Chris Vermeulen

The precious metal market has been stuck in a strong down trend since 2012. But the recent chart, volume and technical analysis is starting to show some signs that a bottom may have already taken place.

This report focused on the weekly and monthly charts which allow us to see the bigger picture of where the precious metals sector stands in terms of its trend.

Let’s take a look at a few charts below for a quick overview, but if you want more interesting ones visit: https://stockcharts.com/public/1992897

Gold Spot Price – Weekly Chart

This chart clearly shows the trends which gold has gone through in the last three years. With simple technical analysis trend lines, clearly price is nearing a significant apex which will result in a strong breakout in either direction.

Remember, this is the weekly chart, so we could still have another month or three of sideways chatter to work through. But a breakout in either direction will trigger a large move.

goldtrend


Silver Spot Price – Weekly Chart

Silver is also stuck in a similar pattern.  Currently the odds still favors lower prices and for the upper resistance trend line to reject price and send it lower. But if we keep out eye on the leading indicators like gold miners, we may be able to catch a breakout or traded the rejection of resistance in the next month or so.

silvertrend


Gold Mining Stock ETF – Monthly Chart

Gold miners have a very sloppy looking chart. Price is extremely volatile and the recent price action in 2013 could go either way VERY quickly. I have a gut feeling GDX in the coming months could have a washout bottom and tag the $20 price level. While I hope I am wrong for many investors sake, if it does happen, it will be a very strong investment level to accumulate a position.

gdxtrend


Precious Metals Bigger Picture Outlook:

In short, I remain neutral – bearish for this sector.  In the next 1-3 months we are likely to see some strong price action which will be great. We need a breakout or bottoming pattern to form before we get involved at this level.

I know everyone is dying to get involved in precious metals again for another huge rally… but sometimes it’s just best to wait for the big picture chart to catch up with your bias before taking a position of size.

Get My Free Weekly Trading Sector Reports
Delivered To Your Inbox: www.GoldAndOilGuy.com

“WOW” Friday’s Precious Metals Meltdown is an understatement…. I love seeing all this fear in the market and panic selling volume jump through the roof. This is or is the “start” of the washout bottom in metals I have been talking about for a few months. Critical support levels have been broken on gold, silver and miner stocks today. This is running the stops juicing up the sell side volume.

This size of a move WILL trigger a wave of margin calls come the end of the session and it could start another strong wave of selling into the closing bell. While I like this prices for both gold and silver, I know this could be just the start of more selling. I sound like a broken record but I am not trying to catch a falling knife unless it looks like a perfect setup. I still feel we could get another 1-3 days of selling or chop down here before things go higher so I will just watch the gold and bugs get stepped on again.

Remember this chart I posted a while back… it’s now coming true:

WATCH VIDEO ABOUT TODAY’S SILVER & GOLD SELLOFF: http://youtu.be/7dnM33V8dIo

Last day of the week is the most important for long term trends and investors. Today is going to be wild and may trigger a massive wave of selling which could be really good for those who know how to take advantage of it with me at: http://www.TheGoldAndOilGuy.com

Chris Vermeulen

The precious metals sector has been dormant since both gold and silver topped in 2011. But the long term bull market remains intact. As long as we do not have the price of gold close below the lower yellow box on the monthly chart then technical speaking precious metals should continue much higher.

Large consolidation periods (yellow boxes) provide investors with great insight for investments looking forward 6-18 months upon a breakout in either direction (up or down). The issue with investing during these times is the passage of time. One can hold a position for months and sometimes years having their investments fluctuate adding extra stress to their life when they really do not need to.

Once a breakout takes place a powerful rally or decline will start putting an investors’ money to work within days of committing to that particular investment compared to money invested waiting months for the breakout and new capital gains to occur.

Gold Price Chart – Monthly

Gold Monthly Price Chart


Gold Price Chart – Daily

The chart of gold continues to form a large bull flag pattern with a potential 3 or 5 wave correction. If price reverses this week and breaks above the upper resistance trend line then it will be a 3 (ABC) wave correction which is very bullish. But there is potential for a full 5 wave correction which is still bullish, but it just means we have another month or two before metals bottom.

Gold Futures Trading Daily Chart


Gold Miner Stocks – GDX ETF Chart – Daily

Gold miners do not have the sexiest looking chart. It was formed a strong looking bull flag but has continues to correct and is not nearing a key support level. This level could act as a triple bottom (bullish) or if price breaks below then it would be breaking then neckline of a massive head and shoulders pattern which points to 50% decline. I remain bullish with the longer term gold trend until proven wrong.

GDX - Gold Miner ETF Trading


Silver Price Chart – Daily

Silver remains in a long term bull market much like the monthly chart of gold shown earlier in this report. Silver continues to work its way through a large bull flag pattern with a positive outlook at this time.

Silver Price Chart Daily


Silver Miner Stocks – SIL ETF – Daily Chart

Reviewing the precious metals sector it seems that silver miners have the sexiest looking chart. All price patterns are showing strength and are in proportion to one other. If this chart plays out to what technical analysis is pointing to then we could see the precious metals sector put in a bottom and rally within the next week or two. And if this is the case then silver miner stocks should provide the most opportunity going forward. Keep in mind you can view my actual watchlist of stock and ETFs I trade in real-time with my analysis free: https://stockcharts.com/public/1992897

SIL - Silver Miner ETF Trading


Precious Metals Trading Conclusion:

In short, what you need to focus on is the yellow consolidation box on the monthly gold chart. A breaking in either direction will trigger a massive move that should last 6-18 months. Until then long term investors can simply sit back and watch the sector while they put their money to work in other active sectors.

From a short term traders point of view, that f mine. I am looking for a signs of a bottom on the daily chart to get my money working earlier to play the bounce/rally that takes place and actively managing the position until a breakout occurs. The charts overall are not that clear as to when a breakout will take place. Metals could start to rally next week or in a few months and all we can do is wait for a reversal to the upside before we get active.

Knowing the big picture trends and patterns at play along with major support and resistance levels (breakout levels) is crucial for success and piece of mind.

Get my analysis, daily updates and trade alerts each day at www.TheGoldAndOilGuy.com

Chris Vermeulen

The price of gold hit a record high this past week . . . in euro terms (at about 1380 euros). The record came after a number of actions by central banks around the world, trying to stimulate their respective economies. The actions, usually centered around money printing, once again had investors looking for refuge in gold.

Since the beginning of September, investors have bought about 75 tons of gold through exchange traded funds. Reuters says that gold ETFs, such as the largest gold ETF – the SPDR Gold Shares (NYSE: GLD), are on track for their biggest quarterly inflows in over a year, of 3.285 million ounces. Finally, according to UBS, investors have also raised their bullish bets on gold futures to the highest level in more than a year.

All the world’s major central banks took action recently including the Bank of Japan which launched a fresh round of monetary stimulus. The main action though was centered in Europe and the United States. The European Central Bank has promised to buy an unlimited quantity of eurobonds going forward. And the Federal Reserve announced its third round of monetary stimulus, QE3, that promises to buy $40 billion of mortgage-backed securities monthly on top of its ongoing Operation Twist program of buying long-dated Treasuries.

Speaking about the monetary easing, Barclays precious metals analyst Suki Cooper put it this way to the Financial Times, “Gold finally found the catalyst it had been waiting for all year after the Fed announced open-ended quantitative easing.”

Another reason for gold’s rise in euro terms, it must be noted, is the continuing fiscal turmoil in Europe itself, particularly in Spain. Spain’s largest autonomous region, Catalonia, manages an economy as big as Portugal’s. The problem is that it has debts of 42 billion euros which it is struggling to service. Catalonia has requested a 5 billion euro temporary bailout from Spain’s central government, adding to its debt burden. In a real show of defiance, Catalonia is also refusing to implement austerity measures. Add to that, bank stress tests in Spain showed that the country’s 14 largest lenders will need 60 billion euros in new capital.

No surprise then that physical demand for gold bars and coins in Europe rose 15 percent in the second quarter, according to the World Gold Council!

Another positive fundamental reason in the corner of gold bulls is the recent currency appreciation in the Indian rupee. India is traditionally the world’s largest consumer of gold. Sales have been slow there this year due to the government trying to slow down gold sales there through rises in a gold import tax. However, the recent rise in the rupee has made gold purchases more palatable and gold sales to India have hit their highest level in two months.

So for now, many of the fundamentals look to favor a move higher for gold, although there is technical resistance at its 2012 high of $1791.

Know when to buy gold, silver, oil and stocks – www.TheGoldAndOilGuy.com

Chris Verneulen