Last week ended on a very positive note for those who follow and trade filtered price spikes.
What is a filtered price spike? In short, I scan pre-market, and post-market trading hours’ price charts of SPY, QQQ, IWM, GLD, and GDX for a very special odd tick in the market which creates a spike on the chart.
These spikes could be to the upside or downside, does not matter. What they tell me is the direction which the market (market makers) are going to try and move the market in then next 48 hours.
As long as you can trade 1x, 2x or 3x ETFs, futures, Binary options, spread betting, or CFD’s, then you can take full advantage of these quick and powerful moves.
These spikes generally are not huge percent movers, typically range between 0.25% – 1.1%, but they are highly accurate and when leverage is used like trading futures you can pocket $250- $1500 quickly.
I have found price spikes to work exceptionally well in predicting market-moving news before it takes place like Brexit and Friday’s FED decision.
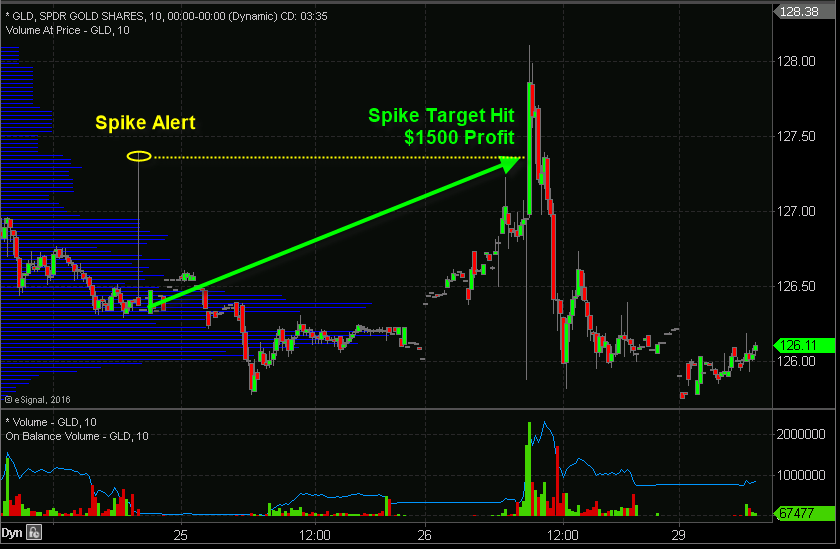
Below you will see a chart of GLD (gold) which flashed us a with a buy signal 36 hours before gold shot up in price post the FED decision.
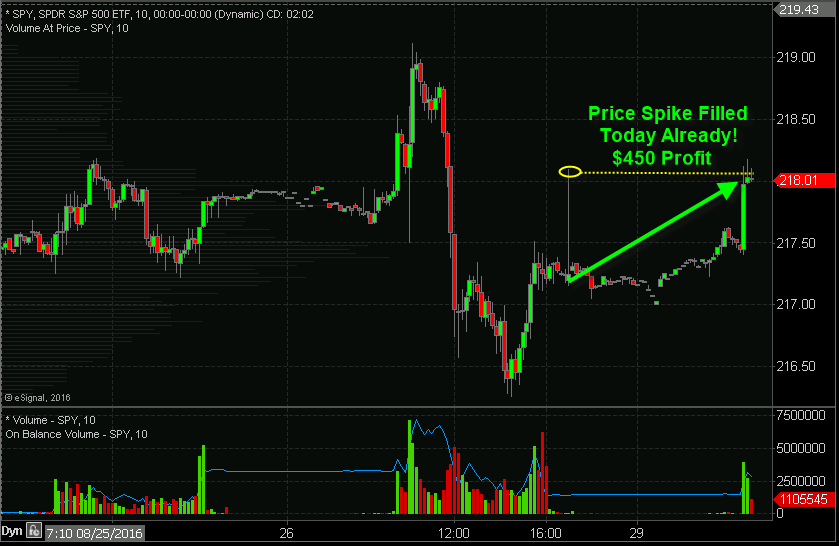
This week (Monday Aug 29th) SPY Spike and Target Hit
On Friday after the market closed I saw a spike up on the SPY chart. You can see what happened the next trading session once the market opened – Market rallied and spike was filled for a quick $450 profit.
Concluding Thoughts:
In short, if you are looking for a few extra trades each month that are highly accurate and only put your money at risk for a very short period of time then you should look into getting my ETF trades and Spike Alerts.
https://thegoldandoilguy.com/wp-content/uploads/2016/02/spikemetal.jpg350350adminhttp://www.thegoldandoilguy.com/wp-content/uploads/2014/11/tgaoglogo.pngadmin2016-08-29 10:55:342016-08-29 10:55:34The Power of Price Spikes On Intraday Charts
The trading week was starting to look as though it was going to end without any excitement. Wow, did that ever change on Friday!
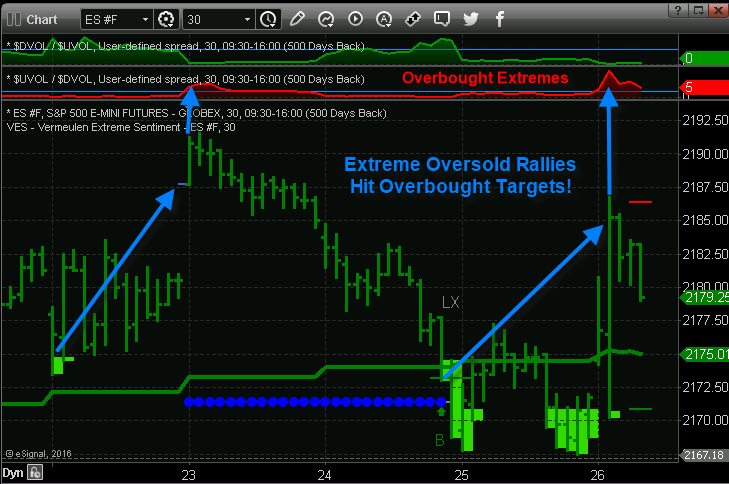
On Wednesday Aug 24th, the stock market sold off to a level which I consider to be an extreme oversold condition for the week. While I do have several criteria as to why and how I come to the conclusion, the chart and indicator below show me when the market is oversold and ready for a bounce.
The green shaded areas on the bar chart are oversold extremes. Wed, Aug 24th the SP500 closed at this extreme. The following day the market struggled to find support but eventually did with the big pop in price on Friday.
You will also notice the red line indicator near the top of the chart. This is a little volume ratio I use to help confirm when the market is getting overbought and profits should be taken.
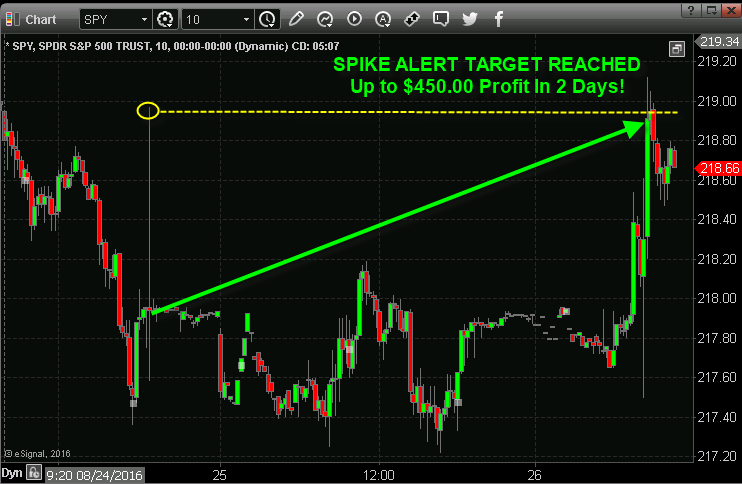
Second Oversold Confirming Indicator – Price Spike
Not only was the market oversold based on my proprietary indicator above, but the market also flashed us a post-market price spike. I have talked about these many times before and how it’s the market giving us insight into where the computers are likely to run the market or at least try to run the market in the next 48 hours. In less than two days the spike was filled for us to pocket another winning momentum trade.
Extreme Markets Conclusion:
In short, as traders we need to trade what see not think. It is easy to have market bias, meaning you want it to go in one direction and you favor your thinking and analysis that way. If you can completely avoid doing this, you will be highly profitable as a trader.
I see this time and time again, when the market gets oversold/overbought, or flashes us a price spike just before some news event. Its tough trading in front of pending news, but 80% of the time these moves play out just as expected.
The last big FED talk, gold flashed spike up a day before the news and it played out in a big way. This week both the SPY and GLD spiked up a day before and both reached their spike targets Friday big fast profits. I will post the gold spike on my blog this weekend.
https://thegoldandoilguy.com/wp-content/uploads/2016/08/extreme.jpg7251300adminhttp://www.thegoldandoilguy.com/wp-content/uploads/2014/11/tgaoglogo.pngadmin2016-08-26 14:04:482016-08-26 14:07:08How Extreme Oversold Markets Can Be Profitable
The SPX has completed its’ “Broadening Topping Pattern”
…the next trend is DOWNWARDS!
The current pattern is suggesting that a significant top is at hand. I fully believe both in patterns and indicators and right now the current pattern is suggesting that a significant top is at hand.
My cycles are suggesting a potential “Black Swan” event, in multiple indexes, which are “imminent”. The SPX may have made its’ last challenge of the upper trend line of its’ ‘Broadening Top’. On Friday, August 19th, 2016, it closed beneath its’ ‘Cycle Top’ resistance at 2185.38. The SPX has fulfilled all of the fractal requirements necessary for a completed “corrective” uptrend. The uptrend from 1810 has been in a “corrective phase”. The next wave down will be an impulsive wave.
The large divergences which I have been viewing, in my proprietary oscillators, are most real and accurate and once the selling begins, the momentum should quickly move to the downside. The current market is being supported by a lack of sellers, more so than aggressive buying. With investors still thinking that there is nowhere else to place their money, they appear to be content with leaving their money at “risk on” assets, within a market that is pushing all-time highs. This type of “mentality” usually leads to large losses, rather than big gains. There is just no opportunity for growth in the SPX!
Investors have become complacent with the current rally. They listen to and believe what the FED has been saying regarding interest rates and they have come to believe that everything about this market depends upon the FED. I do not believe that to be the case. I believe that the FED is or should I say will be irrelevant in due time!
The Bank of America Merrill Lynch reports that its’ clients (institutions, hedge funds and private clients) who have sold stock for all but 2 to 3 weeks, during all of 2016, have once again sold $1.9 billion of US stocks while the SPX was hitting new highs. Institutional clients led the sales due to poor performance. It has been the retail investors that have been flooding into the market while anticipating a massive breakout and rally.
The big and smart money continues to build up massive short positions. George Soros has become more bearish on equity markets, nearly doubling his short bet against the SPX, following similar moves by Jeffrey Gundlach, Carl Icahn and David Tepper. According to his 13F filing, Soros now owns roughly 4 million ‘put options’ on shares of the SPY.
We are presently living on borrowed time and vast amounts of borrowed moneys. This is a period of time of “unprecedented economic upheaval” which was caused by ‘financial engineering’ by governments and their Central Banks. It’s a slow-motion catastrophe, where as we are living today at the expense of tomorrow. The FEDs’ balance sheet has more than quadrupled since the Crash of 2008. This is unprecedented:
Keep in mind, that most of these highly successful investors mentioned above also predicted other major market moves if you look back through the years. Their huge bets and called typically play out, but I do find most of them jump the gun a little early (many months in most cases). Reason being, they understand how and why the markets move, and because they do, they know when various markets are nearing a major turning point.
The catch, with trying to time these major multiyear market reversals is that all investors around the world (all market participants) buying/selling habits need to stall out and reverse direction for the new trend to take hold. This always seems to take longer than we expect, but these highly successful investors along with myself feel this bull market in stocks is about to come to an end.
Conclusion:
The next stage will become a vicious deflationary cycle in which prices and growth “crash and burn”. Prepare for another massive wave poor earnings, job layoffs, and falling stock prices.
Over the past 500 years, or more, whenever deflation emerged, price of gold gained and always gained big, in terms of purchasing power and I don’t feel this time will be any different.
There will be many ways to profit from all of this, precious metals is just one of many awesome opportunities unfolding for myself and subscribers to enjoy.
https://thegoldandoilguy.com/wp-content/uploads/2016/08/crazymarkeet.jpg627940adminhttp://www.thegoldandoilguy.com/wp-content/uploads/2014/11/tgaoglogo.pngadmin2016-08-25 13:35:042016-08-25 13:35:04Stock Market Is Crazy and Crazy Means Opportunity
https://thegoldandoilguy.com/wp-content/uploads/2015/05/cvinterview.png151210adminhttp://www.thegoldandoilguy.com/wp-content/uploads/2014/11/tgaoglogo.pngadmin2016-08-25 08:35:492016-08-25 08:49:35Black Friday Anniversary In The Markets
Low and negative yields mean that no one has the confidence to invest in real capital projects. Investors would much rather lose money over a 10-year horizon than invest in building dams, repairing pipes, creating better grids, starting new businesses, etc. A new monetary order must replace the existing one, and as soon as possible. It will likely be one that China is determined to dominate this time around.
The Bank of Ireland is set to become the first domestic financial institution to pass on the ECB’s negative rates to customers for placing their money on deposit with the bank. I have learned that the Bank of Ireland, which is 14% owned by the State, has informed its large corporate and institutional customers that it plans to charge them a negative rate of -0.1% for deposits of €10 million or more starting in October 2016.
Ulster Bank, which is owned by UK lender Royal Bank of Scotland, has already introduced negative interest rates for a small number of large corporate clients. Ulster Bank has products priced off the back of Euribor, a European interbank lending rate, which is at an all-time low and had turned negative last year. These interest fees being charged by the bank do not apply to SMEs or to personal customers.
Additionally, as Bloomberg reports, The Royal Bank of Scotland, which is Great Britain’s largest taxpayer-owned lender, stated that some of its biggest trading clients must pay interest on collateral as a consequence of low central bank interest rates. Some of the bank’s institutional clients will need to pay interest on funds pledged as collateral when trading futures contracts. The changes for sterling and euro futures and options trading will probably affect about 60 large clients. “Due to the sustained low interest rate environment, RBS will now be passing the cost of holding such deposits onto a limited number of our institutional clients,” the bank said in the statement. RBS said it had previously applied a zero percent floor to the overnight rate charged for collateral required by clearinghouses for future traders.
This is the first indication that the Bank of England’s decision to cut rates to historic lows is forcing lenders to collect negative interest from deposit holders.
Ironically, unlike Europe, the U.K.’s rates are (still) positive, even though the BOE recently cut the interest rate to an all-time low of 0.25% as it unveiled that it would resume monetizing government and corporate bonds. It may soon cut rates to negatives.
While the RBS move affects only a subset of business customers, some lenders in Europe, where both the European Central Bank and the Swiss National Bank have kept interest rates below zero for months, have been charging a wider array of customers in order to hold their deposits.
“What you’re seeing is there have been a few banks in Germany and a couple in Switzerland which have started to charge for deposits; importantly, it’s to corporate customers, or very wealthy people,” said Andrew Lowe, an analyst at Berenberg, as quoted by the FT. “You are likely to see the UK banks follow suit, in particular if rates fall further,” he added. “Everything that applies to Europe applies to UK banks as well.
After a certain period of time passes, it will also apply to less than “very wealthy people.”
The RBS charges would apply to clients who trade futures and options and, therefore, hold cash on deposit as collateral. He said customers were being encouraged to put their cash into bonds, instead, so as to avoid the cost.
Conclusion:
In short, customers who hold money at banks are slowly beginning to get squeezed and charged fees. What does this mean? To me, I feel it’s going to be negative on the banks and their share prices as investor slowly move away from those banks and/or spread their money to other asset classes to avoid paying interest to a bank to hold their money.
Banks have it really bad, if you ask me. They are not making much interest on the capital they hold for clients, and charging customers to hold money is a sure way to lose some of their biggest clients and income.
The financial sector has never recovered from the 2008-09 bear market in stocks, and with, potentially, another bear market just around the corner, bank stocks could be in for a massive bout of selling.
Where could a large chunk of investors’ capital flow? Precious metals is one of the places, though many other greater opportunities are slowly unfolding, and its just a matter of time before we take advantage of them.
Join Me at www.TheGoldAndOilGuy.com and see my exact trades and prosper during these interesting times.
Chris Vermeulen
https://thegoldandoilguy.com/wp-content/uploads/2016/08/euro.jpg557700adminhttp://www.thegoldandoilguy.com/wp-content/uploads/2014/11/tgaoglogo.pngadmin2016-08-24 10:13:552016-08-24 10:13:55The World’s Monetary System Is Broken & Costing Overseas Business
All traders have found their own mix of technical analysis indicators and price action which they feel provides them with a good feel for when the stock market is oversold and overbought. Let’s face it, as traders, we see the market is a different way and its limitless as to how we can trade each and every situation.
Here I would like to share with you a couple of my tools and tricks for timing short term stock market bottoms. Over the years I have refined my analysis to just a handful of tools and analysis that work consistently for me. I have also learned that I trade and analyze the markets best if I don’t read other people’s opinions and analysis as it has a way of altering my thinking and thus I start to second guess where the market is headed.
The indicators/tools I prefer are the 20-day simple moving average for trend direction, support and resistance levels. I watch the Bollinger bands during times when they pinch/narrow as that is when the price is likely to explode in either direction. Also, I watch two volume ratios of the NYSE which you will see on two of the charts below. This indicator tells me when the majority of market participants are running to buy more shares or panicking and hitting the sell button. The 30 minute and 3-minute charts are my favorite for trading and identifying chart patterns.
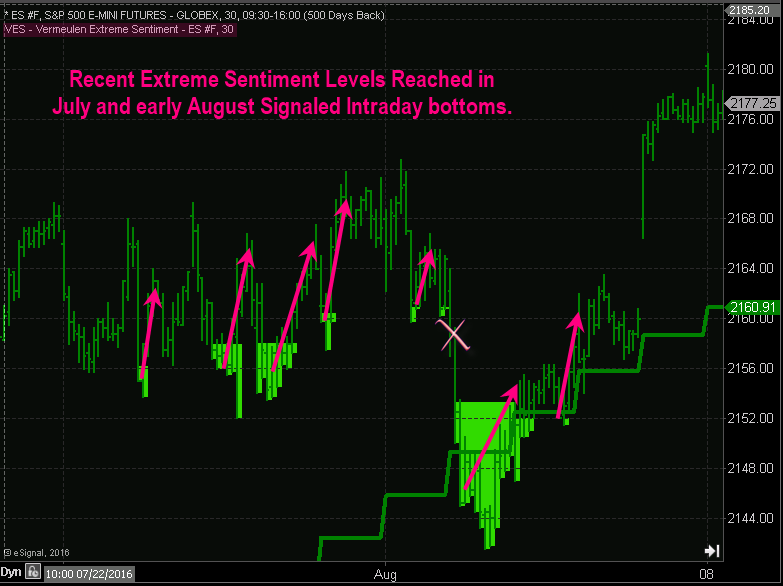
Last week of July – first week of Aug VES Signals
VES is a special indicator I have been developing to help identify intraday oversold levels and overbought levels. The level which big money steps back into, or out of the market when these extreme levels are reached.
Notice in the chart below the lime green areas which price reversed from for quick and steady returns.
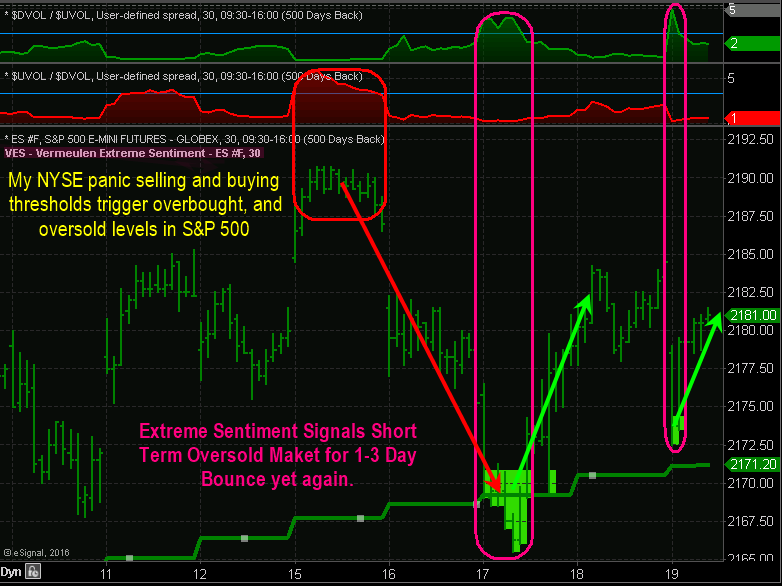
Last Week’s VES Extreme Levels Signaled Including Overbought
Here you will see the both extreme overbought and oversold levels on the chart. I didn’t highlight it on the chart but take a look at Aug 11th. You will notice the red NYSE indicator at the top moved above the blue threshold line indicating everyone was buying. This happened again on the 15th. The general rule is, when everyone is doing the same thing, you best take the other side of the trade.
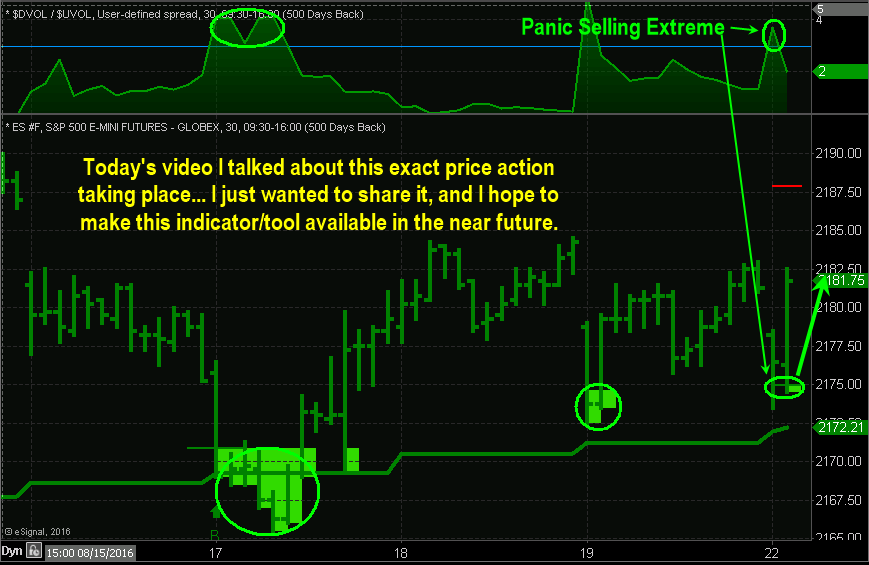
Monday, Aug 22nd – This Weeks VES Signal
What you want to look at on this chart is Monday, Aug 22nd. This is something I can see unfolding before it happens based on other market characteristics and I notified subscribers of my ETF trading newsletter about this during pre-market trading and for them to expect an extreme pivot low today in the morning.
Concluding Thoughts:
In short, these trade may look little at first glance only being a fraction of a percent move each signal. But keep in mind, the shorter the time frame you trade, and the more accurate a trade setup is, the more capital you can put at risk.
My focus on these trade setups are 3x ETFs or better yet ES mini futures contracts. With one futures contract these 5 – 20 point moves allow you to pocket $250 – $1000 within a few hours in most cases.
https://thegoldandoilguy.com/wp-content/uploads/2016/08/extrememarket.jpg372672adminhttp://www.thegoldandoilguy.com/wp-content/uploads/2014/11/tgaoglogo.pngadmin2016-08-22 16:29:152016-08-22 16:33:28How to Spot an Oversold Stock Market
The People’s Bank of China (PBOC) has received approval from the World Bank allowing its’ issuance of bonds which are denominated in Special Drawing Rights (SDRs). The World Bank is the first entity to approve of it and consequently marks the launch of the SDR bond market of the worlds’ second-largest economy.
Jim Yong Kim, The World Bank Group President, said “this is a landmark development for China’s bond market and for the SDR as an international reserve asset. We are very pleased to support China’s growing role in global financial markets. World Bank issuance of SDR bonds in China will support the G-20’s objective of expanding the use of SDRs and help promote the development of China’s domestic capital market. It will also increase Chinese investors’ access to foreign currencies in the domestic bond market, while opening up new opportunities for international investors seeking high-quality investment products in the country.”
This new bond issuance is 2 billion SDRs which is equivalent to $2.8 billion. The bonds will be denominated in SDRs and payable in Chinese renminbi (RMB). The precise timing of issue and individual bond terms will be based on favorable market conditions, at the time of issuance.
The World Bank approval of China, as being the first issuer of SDR-denominated bonds, is a further step in the “internationalization” of the Chinese capital markets. It shows the vital role of the World Bank and how it assists in opening new markets as well as developing local capital markets. The World Bank SDR-denominated bonds in the Chinese market are a fantastic opportunity for Chinese investors to support the World Bank’s sustainable development activities via a new product. These bonds will also be attractive to international investors who are seeking SDR products to hedge SDR liabilities.
The World Bank raises $50-$60 billion, in the international capital markets, each year. The new SDR program in China is part of the World Banks’ strategy to open and support the development of new markets and will therefore expand World Banks’ product offerings which attract new domestic and international investors to World Bank bonds.
Officially, as of October 1st, 2016, the new mix of the SDR will include the Yuan. It now joins the dollar, euro, pound and yen in an exclusive club of currencies that have special drawing rights. The yuan will be weighted at 10.92%. This is the first change in the SDR basket since 1999. In the past, the IMF rejected the yuan in 2010.
For many in the markets, this has been the year of the yuan. When China suddenly devalued its’ currency, earlier this year, it sent the global markets into a tailspin. Currently, the yuan is depreciating even further since traders believe that the Chinese government will step down from its’ intervention in the currency. Being included in the exclusive club is a sign that the currency has ‘grown up’, in a manner of speaking.
This story began in 2009 with the global financial crisis. The People’s Bank of China said that the economic shocks were due to the financial system being overly reliant on a single currency – the US dollar. It has been pushing for inclusion, ever since.
But what effect will this have on both the Chinese economy and other currencies in the basket? The Euro, for example, will surely be affected by this decision. The currency shared by 19 nations within the Eurozone has had a terrible decade and now it appears that things could get worse.
When it comes to this special basket, the weighting of the currency is the most important aspect. If a new currency is introduced, then all of the others have to give up their share. Therefore, the yuan will be weighted at 10.97%, which means that the share of the euro will drop from 37.4% to 30.93%.
As for China, this announcement is nothing but good news. This move by the IMF is more than just ‘symbolic’. Being counted as a reserve currency mainly means that the government has taken the right steps to free up its’ economy. It has reined in intervention and has allowed the currency to be more ‘free’ within the international markets.
Central Banks, around the world, which hold SDRs in reserve, have this new currency as an option to convert into. This means that a lot more Chinese bonds (maybe a trillion dollars’ worth) will now be able to find their way into the market.
Additionally, there is no indication that Central Banks have a lot of demand for the Yuan. This decision gives them the option to convert into the currency, but whether or not they will is a question yet to be answered. The US dollar is still the worlds’ reserve currency.
I question how the SDR will maintain any value if all of its’ underlying currencies, that it has been composed of, have become worthless.
If this is what does occur, then they will be forced to back these fiat currencies with a tangible asset in order to accept this standard. The only money that has lasted for over 5,000 years is gold. I would not be surprised to see a new gold standard set in some way, but that is still a long way away and some serious catastrophes have to happen first.
With that said, the markets tend to move before major events happen, so as things worsen globally, it only makes sense for precious metals (physical currency) to strengthen over time.
There are several big moves likely to happen in the coming month from indices, commodities, currencies and bonds. If you want to be positioned to profit from these next major moves be sure you join my premium newsletter at www.TheGoldAndOilGuy.com
Chris Vermeulen
https://thegoldandoilguy.com/wp-content/uploads/2016/08/china.jpg418618adminhttp://www.thegoldandoilguy.com/wp-content/uploads/2014/11/tgaoglogo.pngadmin2016-08-20 19:50:462016-08-20 19:50:46China Announces New Loan In International Reserve Asset…Which May Affect Gold Price
The current overall SPX pattern is a broadening top, which is usually a very reliable pattern. The market continues to look as though it wants to go even lower. The momentum shift, which I have been expecting, has been slow to start, however one should be prepared for this occurrence ahead of time.
Nevertheless, the large divergences which I have been viewing, in my proprietary oscillators, are most real, and, once the selling starts, the momentum should quickly move to the downside.
The current market is being supported by a lack of sellers more so than aggressive buying. With investors still thinking that there is no other place to store their money, they appear to be content with leaving their money with risk-on assets within a market that is pushing to all-time highs.
This type of mentality usually leads to large losses rather than big gains. There isn’t any real opportunity for growth in the SPX that I can see right now.
Dow Theory: Market Indexes Must Confirm Each Other
The Dow Theory was formulated from a series of Wall Street Journal editorials which were authored by Charles H. Dow from 1900 until the time of his death in 1902. These editorials reflected Dow’s beliefs regarding how the stock market behaved and how the market could be used to measure the health of the business environment.
Dow first used his theory to create the Dow Jones Industrial Index and the Dow Jones Rail Index (now Transportation Index), which were originally compiled by Dow for TheWall Street Journal. Dow created these indexes because he felt they were an accurate reflection of the business conditions within the economy, seeing as they covered two major economic segments: industrial and rail (transportation). While these indexes have changed, over the last 100 years, the theory still applies to current market indexes.
Market indexes must confirm one another. In other words, a major reversal from a bull or bear market cannot be signaled unless both indexes (generally the Dow Industrial and Transports Averages) are in agreement. Currently, THEY ARE DIVERGING,ISSUING A MAJOR NON-CONFIRMATION HIGH ON THE DOW JONES INDUSTRIAL AVERAGE. If one couples this with the volatility index (Fear Index), this is a warning sign and a recipe for disaster.
The FEDs’ monetary policy over the last eight years has led to unproductive and reckless corporate behavior. The chart below shows U.S. non-financials’ year-on-year change in net debt versus operating cash flow as measured by earnings before interest, tax, depreciation, and amortization (EBITA).
The growth in operating cash flow peaked five years ago and has turned negative year-over-year. Net debt has continued to rise, which is not good for companies.
This has never before occurred in the post-World War II period. In the cycle preceding the Great Recession, the peaks had been pretty much coincidental. Even during that cycle, they only diverged for two years, and by the time EBITA turned negative, year-over-year, as it has today, growth in net debt had been declining for over two years. Again, the current 5-year divergence is unprecedented in financial history!
Today, most of that debt is used for financial engineering, as opposed to productive investments. In 2012, buybacks and M&A were $1.25 trillion, while all R&D and office equipment spending were $1.55 trillion. As valuations rose, since that time, R&D and office equipment grew by only $250 billion, but financial engineering grew by $750 billion, or three times this!
You can only live on your seed corn for so long. Despite there being no increase in their interest costs while growing their net borrowing by $1.7 trillion, the profit shares of the corporate sector peaked in 2012. The corporate sector, today, is stuck in a vicious cycle of earnings manipulation management, questionable allocation of capital, low productivity, declining margins and growing debt levels.
Conclusion:
In short, I continue to pound on the table to help keep you and fellow investors aware that something bad, financially, is going to take place – huge events like the tech bubble, the housing collapse a few years back, and now national financial instability. Experts saw all these events coming months and, in some cases, years in advance.
Big things typically don’t happen fast, but once the momentum changes direction you better be ready for some life changing events and a change in the financial market place.
Follow my analysis in real-time, swing trades, and even my long-term investment positions so you can survive from the financial storm: www.TheGoldAndOilGuy.com
Chris Vermeulen
https://thegoldandoilguy.com/wp-content/uploads/2016/08/Bubble-Pop-1-700x516.jpg516700adminhttp://www.thegoldandoilguy.com/wp-content/uploads/2014/11/tgaoglogo.pngadmin2016-08-19 12:58:312016-08-20 19:42:15Will the Bubble Pop Regardless if the FED Never Raises Rates?
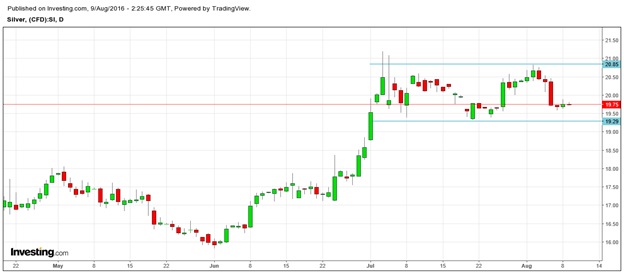
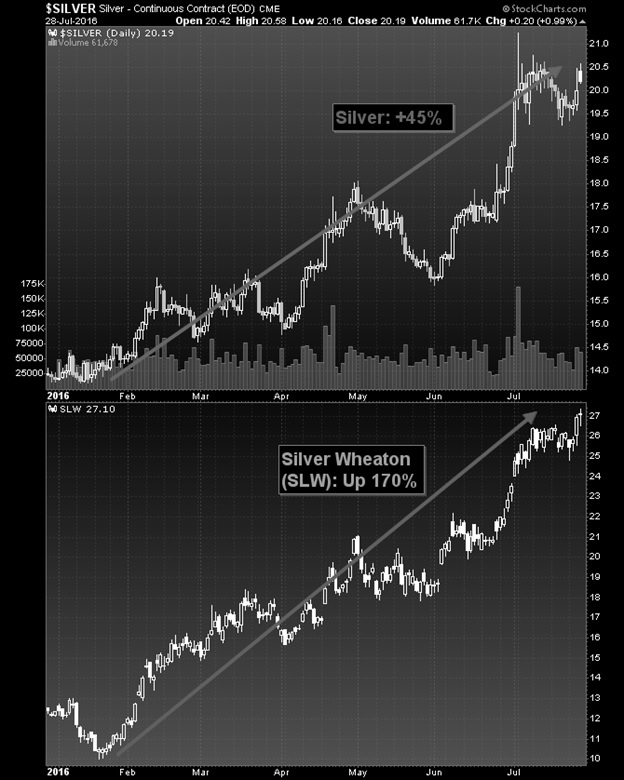
Despite the expectations of a rate hike by the Fed in December of 2016, silver has remained close to its highs (as shown in the chart below). After a stellar run, the white metal is consolidating near its highs, while anticipating its next imminent breakout.
Along with investing in the white metal directly, investors should also use this consolidation in silver to look at the silver miners, which offer excellent returns during silver bull runs.
Supply And Demand For Silver
“Industrial demand is set to increase, driven by rising incomes and growing penetration of technology in populous, developing nations, as well as new uses are being found for silver’s anti-bacterial and reflective properties in everything from hospital paints to Band-Aids to windows”, reports Bloomberg, who expects the industrial demand to surge within the next few years.
India and China will need approximately a billion smartphones and tablets by 2020. Demand for silver is expected to remain buoyant and demand will remain ahead of supply.
“Over the next ten or twenty years, more and more people are going to be using these devices, however, silver is a very limited commodity. “There’s just not a lot of it around” according to Keith Neumeyer, CEO of First Majestic Silver Corp.
It is this that most likely led a major Japanese electronics player to First Majestic in attempts to secure its’ future silver supply, which is a sign of a tightening supply.
“For an electronics manufacturer to come directly to us tells me something is changing in the market; I think we’ll see three-digit silver,” said Neumeyer to Bloomberg.
The Solar industry is booming, as well. Solar power is taking over conventional power sources, and that is good news for silver as the solar industry is likely to consume more than 13% of the total silver demand in 2016. Similarly, ethylene oxide producers will also consume 25% more silver as compared to the previous year.
“Silver demand had a phenomenal 2015 with retail investment and jewelry fabrication both reaching all-time highs,” wrote Frank Holmes of US Global Investors in a post in early July 2016.
On the other hand, silver mine production is expected to drop for the first time since 2002 as mining production dips 5% during the current year.
Why Invest In Silver Miners Along With Silver?
After having established that silver prices are likely to increase further, due to supply shortage and increased demand, let’s review the best possible mode of investment in silver so as to maximize our profits.
During silver bull markets, the silver miners are favored by investors because their prices increase much more than the price of the white metal. As the cost of production remains the same, the miners gain huge profits when silver prices move up.
Hence, traders prefer the silver miners, once the next Elliott Wave count is confirmed. This is the reason for the sharp 170% run-up in the stock prices of Silver Wheaton (SLW), a blue chip silver-streaming company.
For every $1 increase in silver prices, the silver miner has increased by more than $3, which indicates that the silver miners are a better trade than the underlying metal.
However, when silver corrects, the silver miners tend to underperform. The silver miners behave as the leveraged plays of silver, which are rising and falling far more than the underlying white metal.
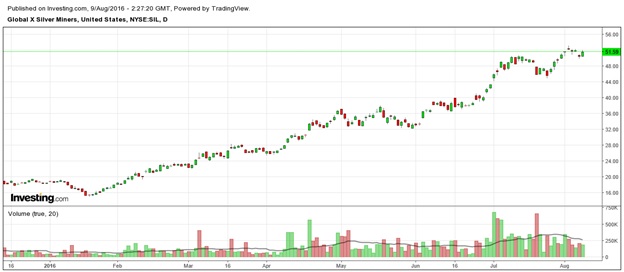
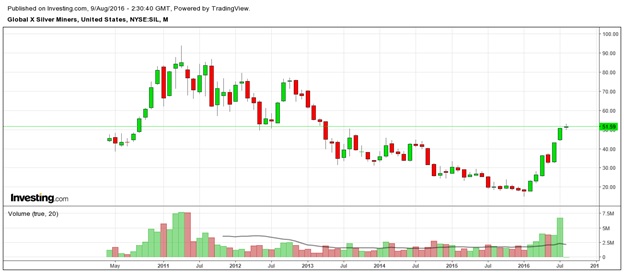
The Global X Silver Miners ETF (SIL) offers an excellent opportunity to investors to enjoy the advantages of the silver miners with reduced risk, compared to owning single mining stocks. The ETF has seen a whopping rally from its lows of below $15 to the current price of $51.59.
Even after the phenomenal rise, the ETF is still well below its 2011 high of $94. (as shown in the chart below)
Traders can keep an eye on SIL to accumulate on dips.
Conclusion
Silver has put a bottom in place and will continue to move even higher, in the coming months and years. In order to benefit from this rise, traders should keep an eye on the silver miners, which act as leveraged plays for the underlying ‘white metal’. With silver booming, silver miners’ prices will continue to skyrocket higher.
However, every rally faces corrections, hence, the right time to buy is when the “risk-reward” is favorable. Keep following my articles and analysis for the right time to enter this ETF.
https://thegoldandoilguy.com/wp-content/uploads/2015/05/silver.jpg225224adminhttp://www.thegoldandoilguy.com/wp-content/uploads/2014/11/tgaoglogo.pngadmin2016-08-17 15:20:452016-08-17 15:20:45Silver Miners Will Outperform Silver Price In The Forthcoming Bull Run!
Nature functions in cycles. Each 24-hour period can be divided into smaller cycles of morning, afternoon, evening, and night. The whole year can be divided into seasonal cycles. Similarly, one’s life can also be divided into cycles. Cycles are abundant in nature – we just have to spot them, understand them, and be prepared for them, because they happen whether we like it or not. Likewise, economic experts have noticed that the world also follows different cycles. An important pioneer in this field was the Russian social economist, Nikolai Kondratiev, also called Nikolai Kondratieff, a relatively unknown genius.
Who Is Kondratiev?
Geniuses have been known to defend their principles and beliefs, even at the cost of losing their lives; they may die but their legacy lives on, as did Kondratiev. He was an economist who laid down his life defending his beliefs. He was the founding director of the Institute of Conjuncture, a famous research institution, which was located in Moscow. He devised a five-year plan for the development of agriculture in Russia from 1923-1925.
His book, “The Major Economic Cycles,” was published 1925, in which his policies were in stark contrast to that of Stalin’s. As a result of this, Kondratiev was arrested in 1930 and given a prison sentence. This sentence was reviewed, and, consequently, he was executed in 1938. What a tragic loss of such a genius at only 42 years of age. He was executed because his research proved him right and Stalin wrong! Nonetheless, his legacy lives on and, in 1939 Joseph Schumpeter named the waves Kondratiev Waves, also known as K-Waves.
What Are Kondratiev Waves?
Investopedia defines the Kondratieff Wave as, “A long-term cycle present in capitalist economies that represents long-term, high-growth and low-growth economic periods.” The initial study by Kondratiev was based on the European agricultural commodity and copper prices. He noticed this period of evolution and self-correction in the economic activity of the capitalist nations and felt it was important to document.
These waves are long cycles, lasting 50-60 years and consisting of various phases that are repetitive in nature. They are divided into four primary cycles:
Spring-Inflationary growth phase: The first wave starts after a depressed economic state. With growth comes inflation. This phase sees stable prices, stable interest rates and a rising stock market, which is led by strong corporate profits and technological innovations. This phase generally lasts for 25 years.
Summer-Stagflation (Recession): This phase witnesses wars such as the War of 1812, the Civil War, the World Wars and the Vietnam War. War leads to a shortage of resources, which leads to rising prices, rising interest rates and higher debt, and because of these factors, companies’ profits decline.
Autumn-Deflationary Growth (Plateau period): After the end of war, people want economic stability. While the economy sees growth in selective sectors, this period also witnesses social and technological innovations. Prices fall and interest rates are low, which leads to higher debt and consumption. At the same time, companies’ profits rise, resulting in a strong stock market. All of these excesses end with a major speculative bubble.
Winter-Depression: This is a period of correcting the excesses of the past and preparing the foundation for future growth. Prices fall, profits decline and stock markets correct to the downside. However, this period also refines the technologies of the past with innovation, making it cheaper and more available for the masses.
Accuracy Of The Cycle Over The Last 200 Years
The K-Waves have stood the test of time. They have correctly identified various periods of important economic activity within the past 200 years. The chart below outlines its accuracy.
Very few cycles in history are as accurate as the Kondratiev waves.
Criticism Of The Kondratiev Waves
No principle in the world is left unchallenged. Similarly, there are a few critics of the K-Waves who consider it useful only for the pre-WWII era. They believe that the current monetary tools, which are at the disposal of the monetary agencies, can alter the performance of these waves. There is also a difference of opinion regarding the timing of the start of the waves.
The Wave Is Being Pushed Ahead But The Mood Confirms A Kondratiev Winter
A closer study reveals that the cycles are being pushed forward temporarily. Any intervention in the natural cycle unleashes the wrath of nature, and the current phase of economic excess will also end in a similar correction. The K-Wave winter cycle that started in 2000 was aligned with the dot-com bubble.
The current stock market rise is fueled by the easy monetary policy of the global central banks. Barring a small period of time from 2005-2007 when the mood of the public was optimistic, the winter had been spent with people in a depressed social mood. The stock market rally from 2009-2015 will be perceived as the most hated rally and the one most laden with fear.
Every dip of a few hundred points in the stock market starts with a comparison to the Great Recession of 2007-2009. The mood exudes fear and disbelief that the efforts of the central banks have not been successful and are unable to thwart off the winter, as predicted by the K-Waves. The winter is here and is reflected in the depressed social mood.
How To Weather Out Brutal Winter
In the last phase of the winter cycle, from 2016-2020, which is likely to test us, the stock market top is in place. Global economic activity has peaked, terrorism further threatens our lives, geopolitical risks have risen, the current levels of debt across the developed world are unmanageable, and a legitimate threat of a currency war occurring will all end with the “The Great Reset.” Gold will be likely to perform better during this winter cycle. Get in love with the yellow metal; it’s the blanket which will help you withstand the winter.
Conclusion
Cycles are generally repetitive forces that give us an insight into the future so we can be prepared to face it and prosper. Without excessive intervention, nature is very forgiving while correcting the excesses. But if one meddles with nature, it can be merciless during the correction. The current economic condition will end with yet another reset in the financial markets. Prices will not rise forever, and a correction will take hold eventually. Until then, we follow and trade accordingly. I will suggest the necessary steps to avoid losses and prosper from market turmoil when it unfolds.