METALS: February gold futures closed down $35.50 at $819.50 today. Prices closed near the session low, hit a fresh four-week low and saw a bearish downside “breakout” from a trading range on the daily chart. Bearish “outside markets”–lower crude oil prices and a firmer U.S. dollar–did pressure the gold market today. Near-term chart damage was inflicted today.
March silver futures closed down 73.0 cents at $10.59 an ounce today. Prices closed near the session low and hit a fresh three-week low today. Bearish “outside markets”–lower crude oil prices and a firmer U.S. dollar–did pressure the market today. A 2.5-month-old choppy uptrend on the daily bar chart was penetrated on the downside today.
ENERGY MARKETS
ENERGIES: February crude oil closed down $3.07 at $37.76 a barrel today. Prices closed near the session low and hit a fresh two-week low today, amid a firmer U.S. dollar and more recent dour world economic data that suggests less demand for energy worldwide. Bears still have the overall near-term technical advantage and have regained downside momentum recently. Prices remain in a six-month-old downtrend on the daily bar chart.
February gold closed higher on Friday as it consolidated some of this week’s decline. The mid-range close sets the stage for a steady opening on Monday. Stochastics and the RSI remain bearish signaling that sideways to lower prices are possible near-term. If February extends this week’s decline, trendline support drawn off the November-December lows crossing near 804.60 is the next downside target. Closes above the 10-day moving average crossing at 865.50 would signal that a low has been posted. First resistance is last Monday’s high crossing at 892.00. Second resistance is October’s high crossing at 938.80. First
support is Wednesday’s low crossing at 836.00. Second support is trading line support crossing near 804.60.
March silver closed higher on Friday due to short covering as it consolidates above the 10-day moving average. The mid-range close sets the stage for a steady opening on Monday. Stochastics and the RSI are neutral to bearish signaling that a short-term top might be in or is near. Closes below the 20-day moving average crossing at 10.908 are needed to confirm that a short-term top has been posted. If March extends the rally off October’s low, the reaction high crossing at 12.230 is the next upside target. First resistance is Monday’s high crossing at 11.770. Second resistance is the reaction high crossing at 12.230. First support is the 20-day moving average crossing at 10.908. Second support is Monday’s low crossing at 10.570.
ENERGY MARKET
February crude oil closed lower on Friday as it extended Thursday’s breakout below the 10-day moving average crossing at 42.98. Today’s low-range close sets the stage for a steady opening on Monday. The door is open for additional weakness and a possible test of last week’s low. Closes below last Wednesday’s low crossing at 36.94 would temper the near-term friendly outlook in the market. Stochastics and the RSI have turned bearish signaling that sideways to lower prices are possible near-term. If February renews the rally off December’s low, the reaction high crossing at 52.95 is the next upside target. First resistance is the 20-day moving average crossing at 43.34. Second resistance is Tuesday’s high crossing at 50.47. First support is today’s low crossing at 39.38. Second support is last Wednesday’s low crossing at 36.94.
February gold closed lower on Wednesday as it extended this week’s decline and closed below the 20-day moving average crossing at 847.60 confirming that a short-term top has been posted. The low-range close sets the stage for a steady to lower opening on Thursday. Stochastics and the RSI are bearish signaling that sideways to lower prices are possible near-term. If February extends this week’s decline, trendline support drawn off the November-December lows crossing near 801.50 is the next downside target. Closes above the 10-day moving average crossing at 862.90 would signal that a low has been posted. First resistance is last Monday’s high crossing at 892.00. Second resistance is October’s high crossing at 938.80. First support is today’s low crossing at 836.00. Second support is trading line support crossing near 801.50.
March silver closed lower on Wednesday due to profit taking as it consolidates above the 10-day moving average. The low-range close sets the stage for a steady to lower opening on Thursday. Stochastics and the RSI are turning neutral to bearish signaling that a short-term top might be in or is near. Closes below the 20-day moving average crossing at 10.787 are needed to confirm that a short-term top has been posted. If March extends the rally off October’s low, the reaction high crossing at 12.230 is the next upside target. First resistance is Monday’s high crossing at 11.770. Second resistance is the reaction high crossing at
12.230. First support is the 10-day moving average crossing at 10.946. Second support is the 20-day moving average crossing at 10.787.
ENERGY MARKETS
February crude oil closed sharply lower on Wednesday due to profit taking as it consolidated some of the rally off December’s low. Today’s low-range close sets the stage for a steady to lower opening on Thursday. Stochastics and the RSI remain neutral to bullish signaling that sideways to higher prices are possible near-term. If February extends this month’s rally, the reaction high crossing at 52.95 is the next upside target. Closes above the reaction high crossing at 52.95 are needed to confirm that a short-term low has been posted. Closes below last Wednesday’s low crossing at 36.94 would temper the near-term friendly
outlook in the market. First resistance is Tuesday’s high crossing at 50.47. Second resistance is the reaction high crossing at 52.95. First support is today’s low crossing at 43.26. Second support is the 10-day moving average crossing at 42.28.
http://www.thegoldandoilguy.com/wp-content/uploads/2014/11/tgaoglogo.png00adminhttp://www.thegoldandoilguy.com/wp-content/uploads/2014/11/tgaoglogo.pngadmin2009-01-07 23:00:312009-01-07 23:00:31Wed Jan 7th Gold, Silver and Oil Commodity Update
February gold closed higher on Tuesday due to short covering as it consolidated some of Monday’s decline. The high-range close sets the stage for a steady to higher opening on Wednesday. Despite today’s rebound, stochastics and the RSI have turned bearish signaling that a short-term top might be in or is near. Closes below the 20-day moving average crossing at 844.10 are needed to confirm that a top has been posted. If February extends this fall’s rally, October’s high crossing at 938.80 is the next upside target. First sesistance is last Monday’s high crossing at 892.00. Second resistance is October’s high crossing at 938.80. First support is the 20-day moving average crossing at 844.10. Second support is today’s low crossing at 838.80.
March silver posted an inside day with a higher close on Tuesday as it consolidates some of Monday’s decline. The high-range close sets the stage for a steady to higher opening on Wednesday. Stochastics and the RSI are bullish signaling that sideways to higher prices are possible near-term. If March extends the rally off October’s low, the reaction high crossing at 12.230 is the next upside target. Closes below the 20-day moving average crossing at 10.735 are needed to confirm that a short-term top has been posted. First resistance is Monday’s high crossing at 11.770. Second resistance is the reaction high crossing at 12.230.
First support is the 10-day moving average crossing at 10.930. Second support is the 20-day moving average crossing at
10.735.
ENERGY MARKETS
February crude oil closed slightly lower on Tuesday due to light profit taking as it consolidated some of the rally off December’s low. Today’s mid-range close sets the stage for a steady opening on Wednesday. Stochastics and the RSI remain bullish signaling that sideways to higher prices are possible near-term. If February extends this month’s rally, the reaction high crossing at 52.95 is the next upside target. Closes above the reaction high crossing at 52.95 are needed to confirm that a short-term low has been posted. Closes below last Wednesday’s low crossing at 36.94 would temper the near-term friendly outlook in
the market. First resistance is today’s high crossing at 50.47. Second resistance is the reaction high crossing at 52.95. First support is the 20-day moving average crossing at 43.96. Second support is the 10-day moving average crossing at 41.94.
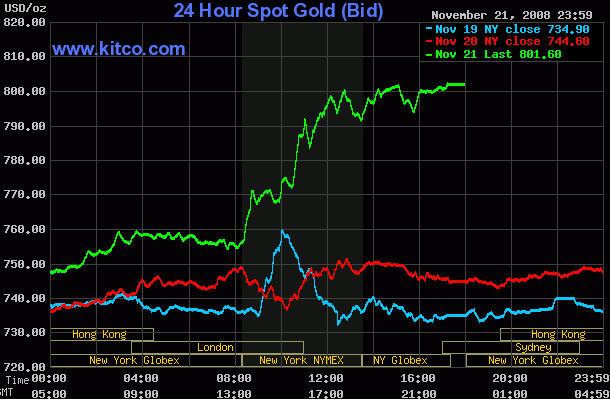
Gold prices shot up on Friday as investor’s move their money into a safer investment as the broad market continued it crash the day before breaking the October bottom. Once the price of gold climbed over the $760 mark which was a short term resistance level the price shot higher as new buyers jumped in and short covering took place pushing gold to climb $57 in one day which you can see in the chart below.
Spot Gold Prices – 3 Day Intraday Chart
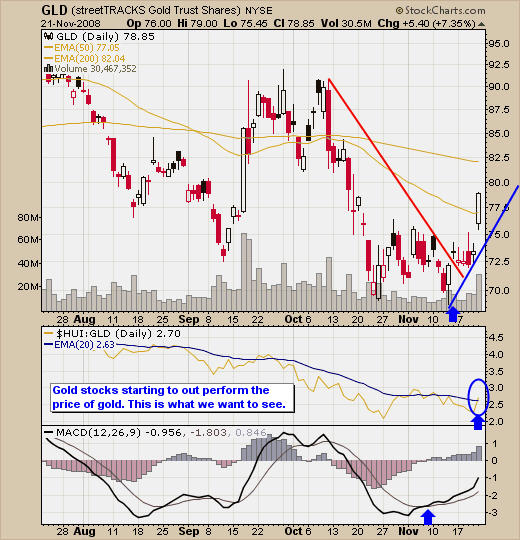
Now, looking at the daily chart of gold below, it appears that it has put in a double bottom with a nice rally higher. Also confirming this move may not be over yet is the MACD cross over and the strength of gold. Its best to waiting for a low risk setup before any money should be put to work. We are getting close to possible buy signals if things continue to hold up over the next week or so. Gold will find resistance between $800 – $825 and could take a breather for a few days which could provide a great setup if we are lucky.
Daily GLD Gold Price Chart
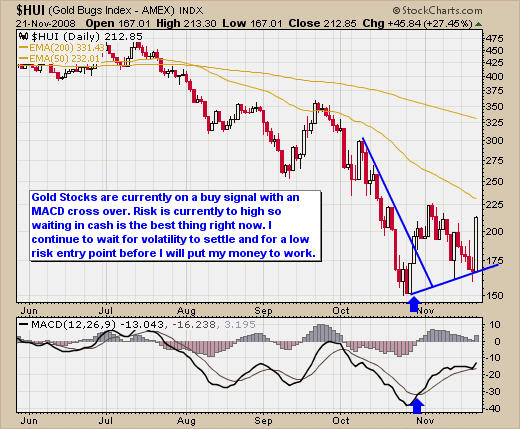
Gold stocks shine as they rally big on Friday out performing the price of gold and possibly putting in a higher low for the HUI which could be the start of an upward trend. Keeping a close eye on the performance of gold stocks will help confirm a low risk setup for trading gold (GLD, DGP, and Spot Gold). If gold stocks are performing well during a gold buy signal I generally put more money to work on that trade as opposed to gold stocks underperforming the price of gold.
Daily Gold Bugs Chart (Gold Stocks)
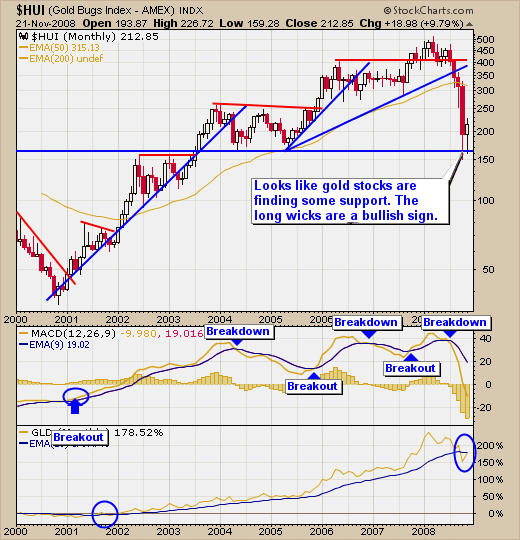
A longer term look at gold stocks performance which is shown in the chart below is the fact that they are bouncing off long term support which has been tested 5 times. This is very bullish for gold and gold stocks as well.
Monthly Gold Stock Chart
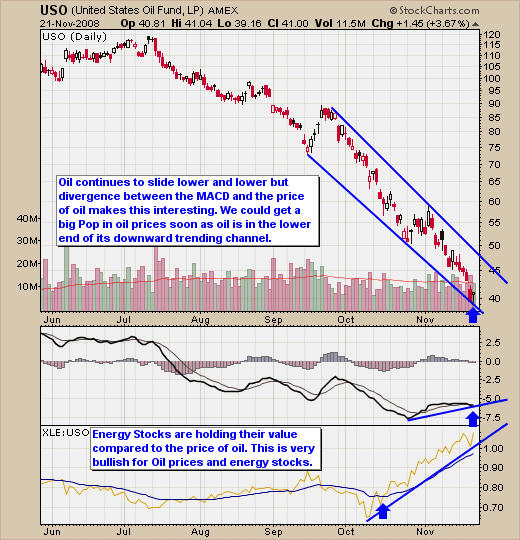
Slippery Oil Prices
Oil Traders cannot believe the slide in oil since June this year. Last Thursday oil closed below $50 which is a long ways of its $150 high not to long ago. A couple interesting things show up on my oil chart which I thought are worth pointing out. Obviously the price of oil is severely oversold and due for a dead cat bounce if not a “V” shaped bottom. But although prices continue to slide the momentum is starting to shift to the up side. The MACD is trying to move higher which is a good thing and also the fact that oil is at the bottom of it channel. Also energy stocks are out performing the price of oil like crazy!!! This is extremely bullish and a bounce in oil will send energy stock soaring. I will note that a lot of energy stocks pay a dividend and with their share prices being pushed down to these extreme levels, investors are starting to buy because the dividend rate is so high and most of these companies make solid earning year after year so at these prices the shares look attractive to many.
Oil Trading Chart (USO)
Conclusion:
I don’t try to predict market direction because it’s a fools game, I do think we have some exciting times just around the corner if the market does find support in the next week or so. I have been in cash since August waiting for a setup but volatility is ridiculously high and I don’t put my money to work if I’m risking more than 3% on a trade. Gold Stocks are starting to have money flow back into them and oil is starting to look like its downward move is almost exhausted. I continue waiting for a proper setup with low risk as I believe in taking the safe middle section of trends and not trying to pick tops or bottoms.
I am a full time daytrader and swing trader specializing in trading GLD, GDX, XGD.TO, SLV and USO. I provide my trading charts, market insight and trading signals to members of my newsletter service.
If you have any questions feel free to send me an email.
Email: Chris@TheGoldAndOilGuy.com
http://www.thegoldandoilguy.com/wp-content/uploads/2014/11/tgaoglogo.png00adminhttp://www.thegoldandoilguy.com/wp-content/uploads/2014/11/tgaoglogo.pngadmin2008-11-24 01:19:052014-03-10 10:12:40Shiny Gold Stocks and Slippery Oil Prices
Today was another one of those great days for trading the spot gold price using the free intraday charts by Kitco. I’m not sure if anyone watches the free Kitco 24 Hour Spot Gold Price Chart, which is shown below, but I watch it like a hawk. It doesn’t take long to get a feel for how gold moves through out the 24hr day. Once you get a feel for it and see the same things happen every week opportunities start to pop up on the radar.
The Kitco Spot Gold Price Chart, which is provided for free, is an amazing tool for observing gold prices over a 3 day time frame. What I’m going to show you is how it can provide opportunities for daytrading the spot gold price or the Gold GLD ETF.
Free Spot Gold Price Chart – By Kitco
Spot Gold Price Chart
This chart may not look like a quality trading tool but it provides very detailed information for daytrading gold and for swing traders as they get ready to enter or exit a position at the open or close of the trading session. As you look at the chart above you will notice that the price movement each day is very similar even though the price of spot gold is different. Often enough the movements are very similar allowing us to take advantage of daytrading the spot gold price.
Spot Gold Price Chart – Close Up
Spot Gold Intraday Prices
This picture does not look like much but it is North America’s standard market trading times 9:30am – 4:00pm ET. You can see the price action following the previous day’s movements. Blue is the previous trading day and Green is Current Trading day. When I see big price movements in gold during these hours I like to take advantage of it the following day. If you didn’t notice the Green line (Today) makes the move before the previous days move. Why? Looks to me like there are a lot of other traders out there like me, getting ready for these opportunities in the spot gold price move before the previous day’s action. Today the market was 20-30 ahead of the previous moves, which happens and should be factored into your trading if you notice this.
Intraday Spot Gold Price Chart
Spot Gold Price Charts
This shows the last 4 spot gold prices using the GLD ETF. As you can see the last for days had the same price movement although today had a larger range to take more profits. This is a 5 minute spot gold chart using GLD. I trade using the 1 minute price chart, as it allows the best timing to enter and exit the positions and keep the 5 minutes chart, which you see above running, as well to keep my head clear for the time and potential price movement.
Today’s Spot Gold Trading Chart
Spot Gold Trading
Above is the chart I use for trading GLD and my actual trades. I am a very conservative trader and I like to lock in profits. Sometimes I get out a little too early but I generally catch the middle trending moves, which are the safest times to trade in my opinion. I could have held the trade longer today but spooked myself out of the trade because of over thinking. This is the exact reason why I use the 5 minute chart to keep my head on straight but sometimes it’s till not enough and I take profits early.
When there are no swing trading setups I focus on finding these intraday daytrading gold patterns. To see some of my spot gold price trading charts using GLD visit this link: http://www.thegoldandoilguy.com/tag/gold-spot-price/ .
My main focus for trading is swing trading gold ETFs. I wait for a trend reversal or continuation pattern which satisfies my trading model, enter the trade and then exit 50% of position on the first sign of weakness. And exit the second half of the position on a trend line break. My swing trading goal for GLD ETF is 2-5% per trade which would last 2-10 days unless price continues to run. I generally have 10-20 trades per year with the GLD gold ETF.
FREE WEEKLY SPOT GOLD PRICE TRADING CHARTS AND TIPS
Stock charts analysis is something that most advanced traders and investors know something about but ordinary brokers and financial advisors don’t even look at.
Most individuals use local broker, financial advisor, friend or family member to help with stock investments but generally these people do not use stock chart analysis to see if the stock is in a trend which can provide acceptable returns if they enter the position at the right time.
Over the years I have helped several traders and investors time their entry and exit points for stocks within their portfolio. Not only do I help individuals time their positions but I provide them with a feel for what the market is doing and that allows you to relax and enjoy playing the market. This is a new service which I now call Investment Consulting.
This is a sample of what a basic chart looks like and the opportunities that become visual once stock chart analysis is applied.
I will personally review YOUR current portfolio stocks providing Technical Analysis on each stock so YOU know where your investments are headed and tips to maximize your returns.
Benefits of Stock Chart Analysis:
– Find out where your portfolio is headed
– Find out which investments are holding you back
– Know when to take profits or sell
– Reduce YOUR investment stress levels
You get my Full Report sent to YOU by email, including:
* Multiple Time frame charts for each stock
* Detailed Charts with support and resistance zones
* Long and short term Trend directions
* Protective Stops for locking in profit
* Buy,Sell and profit taking zones
Now YOU can get detailed, personalized assistance from one of North America’s leading stock chart analysis investment consultants. This is the PLAN you NEED to SUCCEED!
Gold Newsletter Signals – This week gold signals are popping up everywhere in our collection of gold exchange traded funds. This is a quick gold sector updated on the current price action of some of the best gold exchange traded funds.
How to Find Low Risk High Return Gold Signals
First step is to have a GOAL, Then FIND what trading tools are needed to fit your trading goals.
My Trading Goals
First – My focus is to wait for high probability trades. I do not want to make any more trades than I need to. More Trades = More Risk for my hard earned money. Waiting for a high probability trade is difficult but must be done to generate consistent profits. I wait for gold to find a support or resistance level then look for gold signals in my hand picked collection of gold exchange traded funds like GLD, DGP, GDX and many more…
Secondly – I don’t like to hold stocks or funds any longer than I need to. Most of my trades are short term and only last 2-10 days. Some trades last 1-2 months if gold is making a large move but this is something that only happens every now and then.
Thirdly – My goal is to make 2-5% on each trade and I am happy. With 10-20 trades per year at 5% it’s not a bad return on investment.
Last – Once I am in a trade and it looks like our position is about to roll over, I will lock in some profits by selling some of the position to capture a higher % profit. This is crucial if you want to consistently make money trade after trade.
Find the Best Trading Tools for Reaching the Goal
Experience has proven that the following tools and rules allow me to not only find accurate gold signals but to minimize overall risk and increase the average profit per trade. This took a long time to fine tune, but it all came back to the basic indicators and technical analysis we all learn day one of trading. The only difference is that I have a Goal, Tools and Dedication to Follow Through with my trading model. I share this information and support with members in my Gold Newsletter Service.
My Trading Tools
MACD – A popular technical indicator system that combines several moving averages to better show a stock’s trend and momentum.
Price Relative – Technical indicator that compares the performance of two gold exchange traded funds to each other by dividing their price data.
Breakout Buy Signal – This is when the price of an exchange traded fund closes above our resistance trend line and the MACD cross’ to the upside confirming the trend line break. This is the first requirement for a tradable bounce.
Breakout Sell Signal – This is when the price of an exchange traded fund closes below our support trend line and the MACD cross’ to the downside confirming the trend line break. This is the first requirement for a tradable breakdown.
Upside Reversal – When the price of a fund closes higher than the previous days high.
Downside Reversal – When the price of a fund closes lower than the previous days low.
Maximum 3% Risk Trading Rule – I do not enter any trade in GLD, GDX, ASA, XGD.TO that has more than 3% risk. This actually allows me to miss several trades, which would end up losing.
This trading model is simple. Enter a position when we have a low risk setup, and exit on a trend line break. It’s best not to enter a trade if risk is more than 3%.
Gold Miners Index – Multi Year Trend Chart
Gold Stocks At Support
Currently bouncing off support, which increases the probability that we could have a nice rally.
Gold Bugs Index – Monthly Gold Signal Trend Chart
Gold Newsletter Trend Look
The Monthly Gold Bugs chart is trying to give us a sell signal, but gold stocks are making a strong push higher.
$HUI: $GOLD Ratio Chart – Weekly Gold Signals
Gold Newsletter Weekly Trend
Looks like the price of gold stocks have corrected and ready for rally
Gold Bugs Index – Daily Gold Signals
Gold Newsletter Gold Bugs Index Chart
The HUI is my barometer to gauge the strength of a potential gold trade.
GLD Gold Exchange Traded Fund – Gold Trading Signal
Gold Newsletter Gold GLD Chart
GLD is a low risk trading vehicle providing the best win/lose ratio of any other fund I have traded.
DGP Exchange Traded Fund – Gold Trading Signal
DGP Gold Newsletter Daily Chart
DGP is a leveraged gold ETF providing twice the price movement of GLD.
GDX Exchange Traded Fund – Gold Trading Signal
GDX Gold Newsletter Signals
This gold exchange traded fund holds a basket of gold stocks.
XGD.TO Canadian Exchange Traded Fund – Gold Trading Signal
Canadian Gold ETF Newsletter
Gold exchange traded fund for Canadian traders.
Finding low risk trading signals is a simple process but entering at the right time is the key.
Conclusion:Gold’s recent price action has not been easy for most traders. Above are the basics of what I look for when looking for gold signals and trading. If you have any questions please send me an email. Technorati Profile
DZZ Double Gold ETN is a relatively new way to take advantage of gold price action. This gold fund provides double the movement that the GLD ETF or the price of gold does, providing bigger opportunities in the gold sector. I have just recently started to use DZZ ETN for trading and have found it to be very useful, which you will see in the charts below.
A Couple of Benefits of the New DZZ Gold ETNThe fact that it’s a leveraged fund provides more of an opportunity to the small investor, as they can have twice the amount of gold exposure without having to use margin, pay interest, and open a margin account. While trading with leverage is a two sided knife, if done properly, potential higher annual profits can be obtained.
Another reason gold ETN’s are becoming popular is because they allow gold traders and investors to trade both sides of the gold sector within their 401k, IRA and for Canadian their RRSP accounts. Being able to take advantage of the short side during bear market conditions, can double your annual return on investment.
Now let’s look at our current charts and see how this fund can be used.
Gold Bugs Index – Monthly Gold Chart Breakdown
Gold Stocks Index Monthly Breakdown
As you can see on the monthly chart, the gold bugs index is breaking down below our support trend line. We could be entering a much larger consolidation phase or maybe even a bear market. It really does not matter, as we can take advantage of both sides of gold (long and short). The short side actually has more potential in my opinion, but most traders prefer to trade the long side as it’s what everyone learns first and feels comfortable with.
Gold Miner Stocks Index – Weekly Chart Breakdown
Gold Mining Stocks Weely Breakdown
The gold miner stocks index has given us a breakdown, as well as showing that a short play is not fighting the current short term trend of gold. It is now testing support, which means short traders should tighten their stops to lock in more profits when gold decides to bounce.
Gold Bugs vs Gold Price – Weekly Gold Chart at Support
Gold Stocks vs Price of Gold Chart
Gold stocks are testing a support level, as they have declined in value against the price of gold, showing that a large number of investors have been scared out of their positions and thus forcing gold stocks down more than normal.
DZZ Gold ETN – How to Short Gold by Going Long
DZZ Gold ETN Short Trading Signal
Recently we had a buy signal for the DZZ gold ETN, which has provided an excellent low risk setup near the end of July. Currently the trade is up over 28% in just 3 weeks. While we look for the same type of setup for going short, there is one important point to note. When trading GLD or any other stock, index or futures contract to the long side it’s important not to enter a setup with a steep vertical support trend line, as it generally will not continue for any length of time. But trading to the short side like this DZZ trade, the trend lines can be steeper, as prices generally drop much faster, thus pushing our Short Gold ETN fund higher.
This is just one example of how to trade gold to the long and short side, if you would like to learn more please visit my website: www.TheGoldAndOilGuy.com
http://www.thegoldandoilguy.com/wp-content/uploads/2014/11/tgaoglogo.png00adminhttp://www.thegoldandoilguy.com/wp-content/uploads/2014/11/tgaoglogo.pngadmin2008-08-18 11:01:262014-03-10 09:39:15DZZ Gold ETN – How to Short Gold by Going Long
GLD Gold ETF – Taking advantage of the gold market using the GLD exchange traded fund to generate consistent profits in any market condition.
As I mentioned before, the past 5 months have been very frustrating for most traders as we are stuck in this sideways price action. I also noted that August to December is generally the stronger months for gold. Although gold has been under selling pressure during the last 4 weeks I think there is light at the end of the tunnel. It’s usually the darkest before dawn, but there are some hurtles for gold to over come before we are in the clear which I explain below.
Chart 1 – The Gold Mining Stocks Index
This is a 10 year chart with a cup and handle pattern complete with a breakout. As you can see in the chart below gold mining stocks have continued to collapse below their support level. This does not mean gold is going to follow but it is a red flag which needs to be noted for future long entry points. Gold mining stocks in general are seen as volatile and high risk types of investments so I understand why investors are unloading their positions to lock in profits.
Gold Mining Stocks Index
Gold mining stocks are pushed below long term support level.
Chart 2 – Gold Stocks Index
This is an 8yr chart of the price action of gold stocks and you can see that they are currently testing long term support levels. If this monthly bar closes below this trend line then long term investors should be sitting in cash until we have a new opportunity to enter long or short. The HUI generally makes the move before the price of gold so I follow the HUI in all time frames.
Gold Stocks Index
The HUI is testing long term support.
Chart 3 – Performance Chart (Gold Stocks vs Price of Gold)
The past 2 years from 2006 to present gold stocks have slowly been underperforming the price of gold. This is generally not a good thing to see if we want higher prices for gold. But the good news is that gold stocks appear to be reaching levels at which new rallies have started.
Gold Stocks vs Gold Spot Price
Gold stocks under performing the price of gold but near support.
Chart 4 – Daily HUI Chart
I follow the HUI like a hawk as it fine tunes my entry and exit point for trading GLD, DGP and DZZ funds. Last month the HUI made a lower high and a lower low which is a red flag. While I don’t predict prices I am thinking these lower prices for gold stocks are just panic sellers over extending a sell off. I would really like to see an August rally kick into place.
HUI Gold Stocks Index
The HUI makes a lower high and lower low on the daily chart.
Chart 5 – GLD Gold ETF Chart
While gold stocks have been selling down, gold has so far been able to hold some ground. As you can see in the chart below the last three months gold has made higher highs, and higher lows. Currently gold is testing Major Support at the 200 EMA.
GLD Gold ETF Trading
Gold ETF GLD at long term support still holding its ground.
Conclusion:
My analysis of gold using the charts provided above shows that gold stocks and indexes are oversold and are at major support levels. Thus an August rally is not out of the picture and we could have some favorable setups in the near future. I would prefer higher prices, but in the end movement is movement and we can profit in either direction evenly.
GLD gold etf trading for me is the most accurate trading vehicle I have come across. I have been using my proven trading model which avoids the price gaps and keeps risk under 3% for each trade. GLD makes it simple to profit from the markets using a proven trading model for trading long and short term gold setups in all market conditions (bull, bear, and sideways).
My focus for short term trading is simple. Wait for a breakout which satisfies my trading model, enter the trade and then exit 50% of position on the first sign of weakness. Exit second half on a trend line break. My goal for GLD ETF is 2-5% and we are in trades for 2-10 days unless prices continue to run. I generally have 10-20 trades per year with gold.
Chris Vermeulen is Founder of the popular trading site TheGoldAndOilGuy.com. There he shares his highly successful, low-risk trading method. For 6 years Chris has been a leader in teaching others to skillfully trade in gold, oil, and silver in both bull and bear markets. Subscribers to his service depend on Chris’ uniquely consistent investment opportunities that carry exceptionally low risk and high return.