
Watch today’s trading video covering setups unfolding in the market for today and next week.
By Futures Portal
Chris Vermeulen www.TheGoldAndOilGuy.com a full time trader shares
his experience of trading futures and ETFs.
——————————————————–
You call yourself the “Gold and Oil Guy”, are the gold and oil sectors are your specialties?
I follow gold and oil closely and give my analysis, thoughts and trades ideas to my followers each morning before the market opens. While I follow them closely the SP500 is my baby and what I prefer to trade. I found that emotions run wild in the stock market and once you understand what state of mind the majority of traders are in, then you are able to accurately track and forecast future moves 1-3 days in advance.
How did you get started trading?
I started years ago in college trading from my laptop. It didn’t take long before I decided this was what I was meant to do for a living. I have never stopped since. I work with several financial websites and professional traders each week and trade each day either managing swing trades or taking a day trades.
What instruments do you trade the most?
Depending on the risk and type of trade (swing, momentum or day trade) I jump between trading ES Mini Futures, 1x ETFs, 2x ETFs and 3X ETFs. I prefer index trading specifically the SP500 as that has been my main focus for day one. It’s better to be really GOOD AT ONE THING than average at a bunch of things. This strategy has many benefits to it including less time searching for trade setups, less stress, lower risk levels etc…
How did you choose the time frames you trade on?
Choosing the time frames to trade took many years of trial and error. But I did eventually find a couple time frames which have proved to be VERY accurate when trading the SP500 specifically. Money flows in and out of the market in waves (cycles) and once I realized these cycles and could identify fear and greed in the market place finding and timing trades was the difference between night and day.
The really exciting thing about the SP500 and its cycles/timeframes is that I can trade full time and have trades almost every other day or site back and wait for the longer term swing trades and enjoy time with my family, friends and exercise. I have built a trading system that automatically breaths with the market using current volatility levels, various cycles, buy/sell volume levels and momentum and it alerts me in pre-market trading each day if I a buy, sell or position adjustment is to be made. The time frames I focus on are the daily, 30 minute, 10 minute and 3 minute.
Do you trade leveraged instruments? Do you trade them differently from non-leveraged investments?
I trade all types of instruments based around the SP500. In short, the more leverage I use the smaller the position I take and the shorter term the trade is.
For example I will trade the ES mini futures for day trades which are always closed out at the end of the day.
Momentum trades which last 1-3 days I will use a 2x or 3x ETF like SSO or SPXU to get more juice from a play but maintain a healthy risk level as overnight trading and price gaps cut both ways.
Swing Trades I take the largest positions in up to 50% of my trading account in a single position using a 1x ETF like the SPY. These trades can last up to 4 months at times.
I do at times make things a little more complicated when trading with a strong trend. Sometimes when I get a swing trade buy signal I will buy a position using the 1x ETF. If in the next 3 days I get lower prices of more than 1% against me while the uptrend remains alive I will add more of a position using a 2x and 3x ETF also. Once the market bounces back a little I close out the leveraged positions to a quick gain and continue to ride the swing trade. I do this same thing in down trends when I am on a hot streak and in the zone with the SP500.
What has been your biggest hurdle becoming a full time trader?
The toughest part of trading for me is keeping laser-beam focus on my strategy as it is mandatory for success. I work with, talk to and read a lot of market opinions of other traders each day and it can cloud my judgment causing me to break my own rules.
In your opinion, what do most traders don’t realize about the “game” of trading?
Most traders/investors do not understand risk/reward for positions. I would say 90% of people I talk with take much too large of positions in investments which carry very high risk. Also they do not use protective stops based of technical analysis/risk tolerances. Those are the two main things, but this list could go on and on… There are a lot of moving parts in the market and each must be closely monitored, managed and understood clearly.
Again, It’s better to be really GOOD AT ONE THING than average at a bunch of things meaning you should be jumping around trading random stocks, sectors, commodities and investment types like options, equities, forex etc… Just learn one, master it and then expand.
Without revealing your proprietary method, could you please tell us what tools you use for trading? Any specific indicators?
I am a technical trader so I focus 100% on Price, Volume and Momentum. News, economic data and rumors mean absolutely nothing to me. The only thing that pays traders is price action so that is what I follow. It’s simple supply and demand. High volume means there is power behind a move and momentum is how fast the price is moving on various time frames.
As long as you trade with the daily trend direction forget about picking market tops or bottoms you instantly have the odds in your favor. Problem is people always want to try and outsmart the market by going against the trend and trying to pick these tops and bottoms.
As for the indicators I use. Again they are simple and based off price, volume and momentum. Each of my indicators has been customized for the SP500 and is unique. I do like stochastics and bollingerbands but they each need to be tuned for the underlying investment to provide a trading edge.
What advice would you give new traders to start on the right foot?
I would tell a new trader to spend a lot of time thinking about what their ideal/dream lifestyle would be like if they could choose. Do you want to be looking at the computer and trading every day? Or do you want to always be in positions and actively managing them on a weekly basis so you can enjoy life little more? Or A mix of both?
Then you need to figure out what you would like to trade. Stocks, Options, ETFs, Futures, or currencies?
Once you know these things then you should spend a lot of time looking for a successful trading doing EXACTLY what you want and do everything in your power and never give up to learn, master and live that lifestyle. Learning to trade is not cheap. You either lose a lot of money or spend a lot of money to fast track things… either way it’s going to cost you thousands of dollars.
Personally I do a hybrid with laser-beam focus. I focus on only one investment (SP500). And I have learned and created my own trading system so I can day trade, momentum trade and swing it. This give me total freedom as I can spend 20 minutes a day looking at the market to manage my swing trade if needed and then walk away. Or can be replying to emails and see a setup unfolding on the intraday chart and take a quick trade and pocket a few hundred bucks on a day trade.
Final question is about drawdowns. How do you handle them in your trading?
Drawdowns are simple really… Depending on the type of investment you are trading the percentage amount will vary. But the same rule should apply. You should have a maximum loss per trade set so that you never blow your account up. Hopefully your protective stop is set way before that level is ever reached but sometimes price moves beyond normal volatility levels.
My general rule is to never lose more than 1% of my account in a trade. So once I spot a setup and then calculate where my stop should be and figure out how much capital to put to work so that if my stop is hit I do not lose more than 1% of my trading account. Because I focus on the SP500 the volatility is low compared to trading individual stocks so moves in price as easy to digest and reduces fear/stress when in a position.
Chris, thank you very much for sharing your experience with us and our readers.
Best of luck on everything.
FuturesPortal.com Editorial
Chris Vermeulen, www.TheGoldAndOilGuy.com
On April 12th I wrote a blog post titled Precious Metals Melt-Down, and How To Manage It. I talked about how gold, silver and gold mining stocks have been flying under the media radar for over a year and that they were not catching the attention of traders, investors and the public anymore. I also said it would take some sharp price action (breakdown or rally) for it to be front and center again on TV, Radio and Newspapers.
But since gold has plummeted 17.5% dropping from $1600 down to $1320 per ounce with silver and gold stocks falling also they are now headline news once again. This move has caused some serious damage to the charts when looking at it from a technical analysis point of view. Below are some basic analysis points that show a new swing trading entry point.
The Technical Traders Chart Analysis:
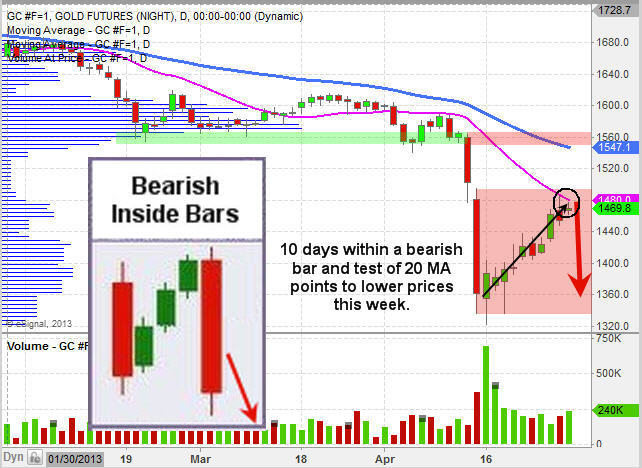
Broken Support – Once a support level has been broken it becomes resistance. Gold is trading under a major resistance level.
Momentum Bursts – Since the April 15th low, gold has been setting up for another short selling entry point. Remember the market tends to move in bursts of three, seven or ten days then price reverses direction or pauses. It has now been 10 days.
Moving Average Resistance – Gold has worked its way up to the 20 day moving average which can act as resistance.
Bearish Inside Bars – This type of chart pattern points to lower prices. When there is a big down day followed by 3, 7 or 10 up days inside the price action of the down bar we can typically expect another sharp drop which tests the recent lows as shown with the arrow on the chart.
Gold Short Selling Conclusion:
In short, gold is setting up for a low risk entry point that should allow us to profit from lower gold prices. Using an inverse ETF like DZZ or even the gold mining stock inverse ETF DUST could be played. These funds go up in value as the price of gold falls.
While I expect gold to pullback, I do not think it will make another leg lower. Instead, a test of the recent low or pierce of the low by a few bucks then reverse and start building a bullish basing pattern before going higher.
Get My Book Free and Learn How To Manage Your Trades, Money & Emotions: http://www.thegoldandoilguy.com/trade-money-emotions.php
Chris Vermeulen
“WOW” Friday’s Precious Metals Meltdown is an understatement…. I love seeing all this fear in the market and panic selling volume jump through the roof. This is or is the “start” of the washout bottom in metals I have been talking about for a few months. Critical support levels have been broken on gold, silver and miner stocks today. This is running the stops juicing up the sell side volume.
This size of a move WILL trigger a wave of margin calls come the end of the session and it could start another strong wave of selling into the closing bell. While I like this prices for both gold and silver, I know this could be just the start of more selling. I sound like a broken record but I am not trying to catch a falling knife unless it looks like a perfect setup. I still feel we could get another 1-3 days of selling or chop down here before things go higher so I will just watch the gold and bugs get stepped on again.
Remember this chart I posted a while back… it’s now coming true:
WATCH VIDEO ABOUT TODAY’S SILVER & GOLD SELLOFF: http://youtu.be/7dnM33V8dIo
Last day of the week is the most important for long term trends and investors. Today is going to be wild and may trigger a massive wave of selling which could be really good for those who know how to take advantage of it with me at: http://www.TheGoldAndOilGuy.com
Chris Vermeulen
I was just interviewed by Mike Swanson of www.wallstreetwindow.com in which we discussed our outlook for the stock market and gold.
You can get on Mike’s free list and see a little bit of what he offers by going here.
You can also download the mp3 audio file for this interview on your computer by clicking here WITH A RIGHT BUTTON CLICK and selecting SAVE FILE AS from the drop down menu.
My Trend Analysis Software Chart:
Chris Vermeulen
Silver and silver mining stocks are front and center for investors and active traders. Because of silvers high volatility (large price swings) it naturally attracts a lot of attention.
First you have seasoned investors who are waiting for the right opportunity to get long or short for the next move. Then you have the active traders playing the day to day price swings. Finally you get the gamblers who are salivating over the potential to double their accounts and are riding the commodity on pure emotions (Fear & Greed). All these things compound the volatility for the investment making it headline news and what everyone wants to be involved in.
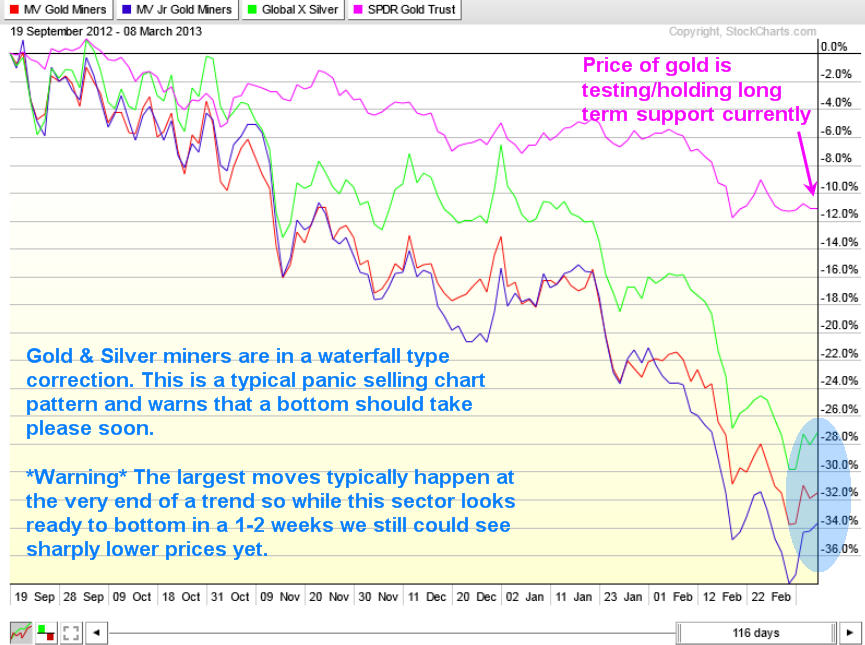
The focus of this report is show you where the price of gold, silver and miner stocks are currently trading and what to lookout for in the coming days/weeks. Below is a chart of gold but silver has a similar pattern and will follow or should I say lead the price of gold in percentage terms because of its volatility.
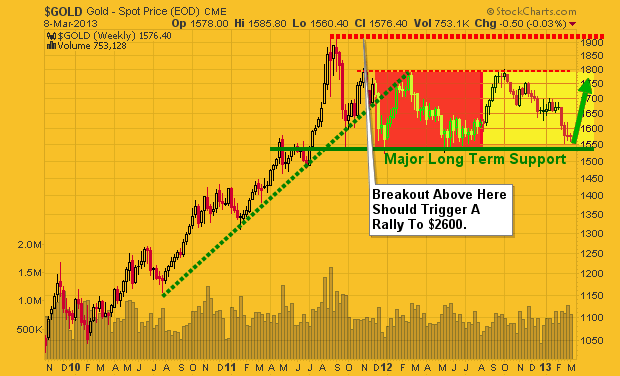
Gold Weekly Chart:
Gold has been testing its long term support level for three weeks. I expect we see price start to move quickly sooner than later but there is potential for it to tread water here until the second half of April. We all know the saying “Sell in May and Go Away” and as we get closer to that date we should start to see money flow into the “Safe Havens” being gold, silver, and miners. While this has not happened many times on the charts I am thinking beyond them and of what the masses are likely to flock to when stocks lose their luster.
Also if you have been following the price of the dollar index you know that its getting a little overbought and when it starts to correct the falling dollar should help send precious metals higher.
Gold & Silver Miners VS Gold Bullion Performance:
The stock market has certain chart patterns that tell chart readers what the holders of that particular investment is feeling emotionally. Knowing how to read these extreme patterns can yield some big gains and works for most investments types (stocks, bonds, commodities and currencies).
Without getting into the boring technical details precious metal stocks are starting show signs of panic selling which typically happens before a major bottom is put in place. A bottom generally takes a week or two for some type of bottoming pattern or base building to form. This is the most volatile time to be trading these investments so trade with caution.
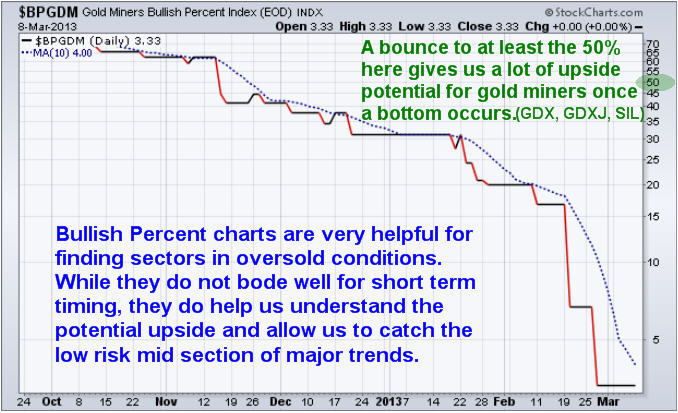
Gold Miners Bullish Percent Index:
Bullish percent indexes are a great way to see how popular an investment is. If you do not know what a bullish percent chart is then you can look it up online and learn more. The way I read it is when it’s up over 75-80 it’s a popular investment and everyone is buying it. It also means it’s in a major uptrend. But you must be aware that when everyone is buying something once price starts to turn down you better be one of the first few out the door before everyone else runs for the door and price crashes.
It’s similar but reversed for investments that are below 20. Everyone is selling, no one wants to own it but once the selling momentum stops price should rebound and rally. Keep in mind this indicator is not great for timing, but confirms that what you are looking at is either oversold, neutral or overbought in the BIG picture.
Weekend Precious Metals Trading Conclusion:
In short, I still like gold, silver, and their related mining stocks. I am watching them very closely for signs of a bottom and will be jumping on that train when the selling momentum looks to have stalled. Keep in mind that all these investments are still in a VERY STRONG DOWN TREND and trying to catch a falling knife is not what I do. Waiting for momentum to shift is my focus as there should be big upside if metals and stocks can find a bottom soon. If gold breaks down below key support as posted on the weekly chart then the uptrend may be over and it will be time to start looking for short positions.
You can get my free weekly reports and ideas here: www.GoldAndOilGuy.com
Chris Vermeulen
Over the past year my long term trends and outlooks have not changed for gold, oil or the SP500. Though there has been a lot of sideways price action to keep everyone one their toes and focused on the short term charts.
As we all know if the market does not shake you out, it will wait you out, and sometimes it will do both. So stepping back to review the bigger picture each weeks is crucial in keeping a level trading/investing strategy in motion.
The key to investing success is to always trade with the long term trend and stick with it until price and volume clearly signals a reversal/down trend. Doing this means you truly never catch the market top nor do you catch market bottoms. But the important thing is that you do catch the low risk trending stage of an investment (stage 2 – Bull Market, Stage 4 Bear Market).
Lets take a look at the charts and see where prices stand in the grand scheme of things…
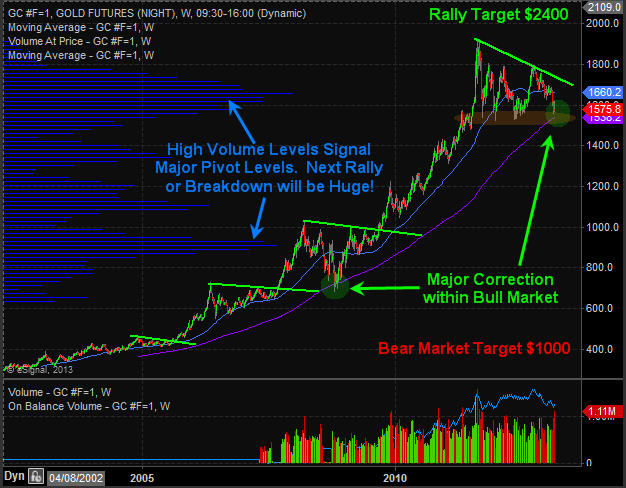
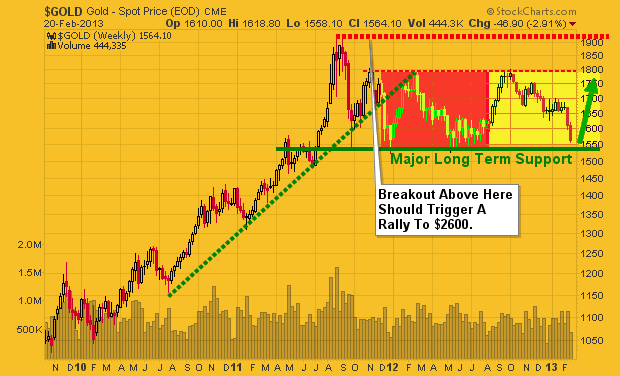
Gold Weekly Futures Trading Chart:
Last week to talk about about how precious metals are nearing a major tipping point and to be aware of those levels because the next move is likely to be huge and you do not want to miss it.
Overall gold and silver remain in a secular bull market and has gone through many similar pauses to what we are watching unfold over the past year. As mentioned above the gold market looks to be trying to not only shake investors out but to wait them out also with this 18 month volatile sideways trend.
A lot of gold bugs, gold and stock investors of mining stocks are starting to give up which can been seen in the price and selling volume for these investments recently. I am a contrarian in nature so when I see the masses running for the door I start to become interested in what everyone is unloading at bargain prices.
Gold is now entering an oversold panic selling phase which happens to be at major long term support. This bodes well for a strong bounce or start of a new bull market leg higher for this shiny metal. If gold breaks below $1500 – 1530 levels it could trigger a bear market for precious metals but until then I’m bullish at this price. I think we could see another spike lower in gold to test the $1500- $1530 level this week but after that it could be off to the races to new highs.
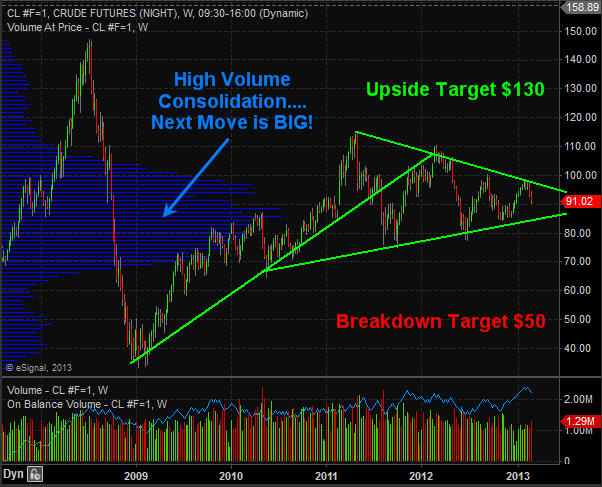
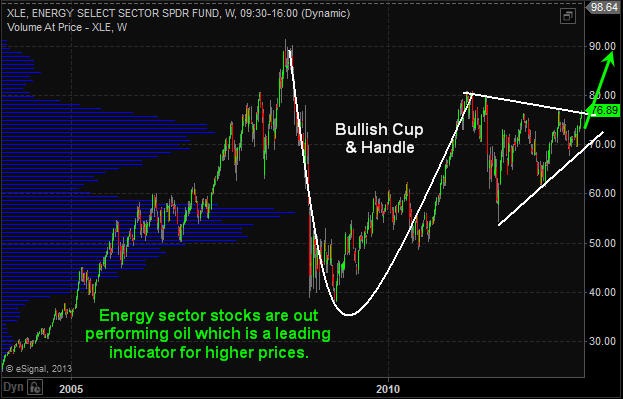
Crude Oil Weekly Trading Chart:
Oil had a huge bull market from 2009 until 2011 but since then has been trading sideways in a narrowing bullish range. I expect some big moves this year for oil and technical analysis puts the odds on higher prices. If we do get a breakout and rally then $130 will likely be reached. But if price breaks down then a sharp drop to $50 per barrel looks likely.
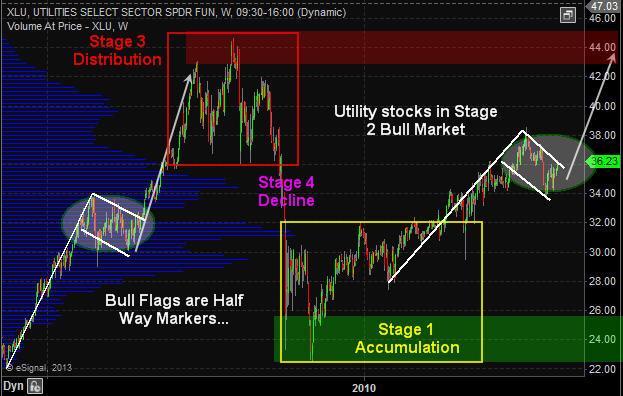
Utility & Energy Stocks – XLU – XLE – Weekly Investing Chart
The utility sector has done well and continues to look very bullish for 2013. This high dividend paying sector is liked by many and the price action speaks for its self… If the overall financial market starts to peak then these sectors should hold up well because they are services, dividend and a commodity play wrapped in one.
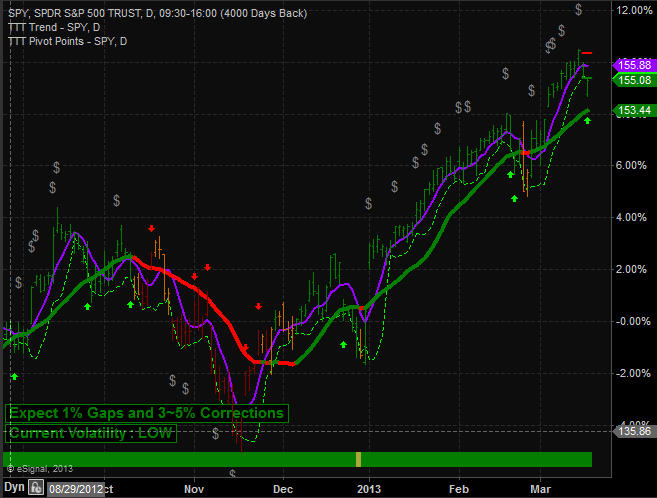
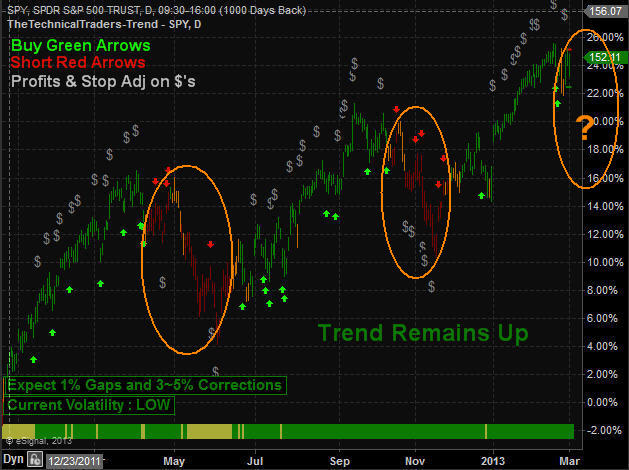
SP500 Trend Daily Chart:
The SP500 continues to be in an uptrend which I am trading with until price and volume tell me otherwise. But there are some early warning signs that another correction or a full blown bear market may be just around the corner.
Again, sticking with the uptrend is key, but knowing what to look for and prepare for is important so that when the trend does change your transition from long positions to short positions is a simple measured move in your portfolios.
Weekend Trend Conclusion:
In short, I remain bullish on stocks and commodity related stocks until I see a trend change in the SP500.
Energy sector is doing well and looks bullish for the next month. As for gold and gold miners, I feel they are entering a low risk entry point to start building a new long position. Risk is low compared to potential reward.
When the price of a commodity or index trade near the apex of a narrowing range or major long term support/resistance level volatility typically increases as fear and greed become heightened which creates larger daily price swings. So be prepared for some turbulence in the coming weeks while the market shakes things up.
If you like my work then be sure to get on my free mailing list to get these each week on various investments for investment ideas at www.GoldAndOilGuy.com
Chris Vermeulen
Since silver and gold topped in 2011 investors have been struggling with these positions hoping this cyclical bull market for metals continues. The simple truth is no one knows for sure if prices will continue and make new highs and those who say its a for sure thing we all know deep down is full of bull crap.
All investments move in cycles, waves or trends which ever you want to call it. The market has 4 simple yet distinct stages each require a completely different skill set and trading tactics to navigate.
Stage 1 – After a period of decline a stock consolidates at a contracted price range as buyers step into the market and fight for control over the exhausted sellers. Price action is neutral as sellers exit their positions and buyers begin to accumulate the stock.
Stage 2 – Upon gaining control of price movement, buyers overwhelm sellers and a stock enters a period of higher highs and higher lows. A bull market begins and the path of least resistance is higher. Traders should aggressively trade the long side, taking advantage of any pullback or dips in the stock’s price.
Stage 3 – After a prolonged increase in share price the buyers now become exhausted and the sellers again move in. This period of consolidation and distribution produces neutral price action and precedes a decline in the stock’s price.
Stage 4 – When the lows of Stage 3 are breached a stock enters a decline as sellers overwhelm buyers. A pattern of lower highs and lower lows emerges as a stock enters a bear market. A well-positioned trader would be aggressively trading the short side and taking advantage of the often quick declines in the stock’s price. More times than not all of stage 2 gains are given back in a short period of time. I do show some of my trade setups using these exact stages free here: https://stockcharts.com/public/1992897

Now that you know the stages and what it looks like its time to review the gold, silver and miners charts.
Gold Chart – Weekly
Gold has been in a bull market for several years but is starting to show its age in terms of the size of the price patterns, volume levels and extreme bullish sentiment. Back in 2011 a week before price topped we exited precious metals because the short term charts and volume levels were warning of a sharp drop. Since then I have not done many trades in either gold or silver because I do not like shorting in bull markets. Waiting for a bullish setup/price pattern before getting involved is my focus.
Gold has pulled back with a bullish 5 wave correction the last 5 months and at key support. While the long term charts are pointing to higher gold prices you must be aware that if gold and silver start to breakdown things will likely get ugly quickly. To be honest I do not care which way it goes, I just want it to either rally from support here and make new highs or breakdown and crash. Both will be very profitable if traded properly.

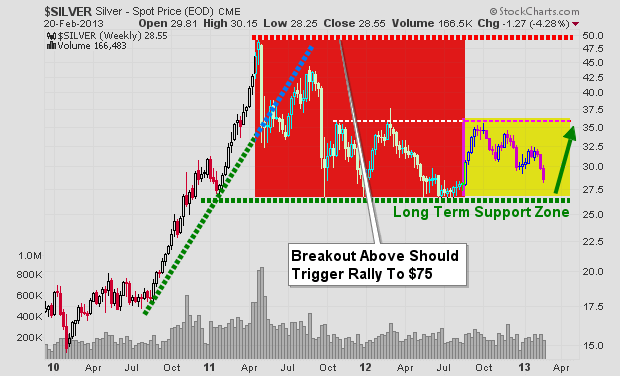
Silver Chart – Weekly
Silver has a very similar chart to that of its big sister (yellow gold). This shiny metal has the energy of a 3 year old making it a very volatile investment. I have touched on the topic of gold and silver being so called safe havens and if you have been reading my work for a while you know that any investment that can move 18-45% in value within 1 month is NOT a safe haven.
While it has done well in the past decade and boosted a lot of retirement accounts the day will come with these things collapse and most people holding them will give back most if not all the gains they had simply because people get attached to large positions and most do not know when to just exit a position.

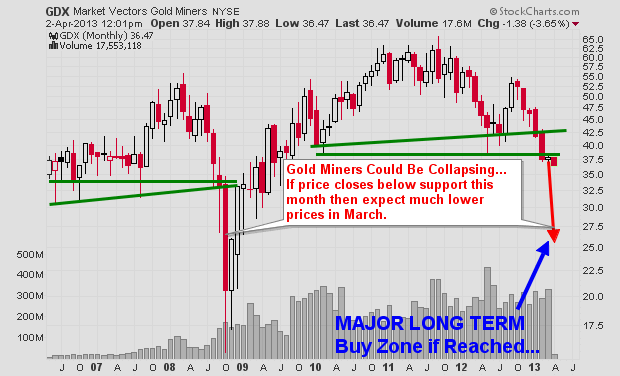
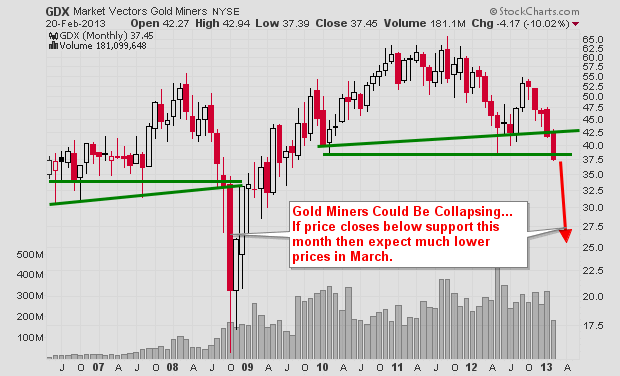
Gold Miners Chart – Monthly
This chart gives me cold sweats because I know how many people own gold mining stocks and I know how fast these things can move. If the price closed below the green support line the bottom could fall out and be very painful for those who get paralyzed by denial and do nothing but watch their accounts lose value week after week.

Precious Metals Investing Conclusion:
In short, this report is to show you the very basics of how investments move in stages. It is also to show a warning that precious metals are technically very close to a major breakdown which the big money players are watching closely. This thinly traded sector can move extremely fast when everyone rushes for the door.
Do not get me wrong, I am not saying a crash is about to happen, actually it’s the opposite. All I am doing is planning the idea in your subconscious so that if prices continue to move lower you will remember that these price levels and take action with your investments. Remember, you can always buy the investment back at any time again if the outlook changes in a week, month or year.
Get My FREE Weekly Gold, Silver and Mining Reports and Trade with the Stages: www.GoldAndOilGuy.com
Chris Vermeulen
Gold and silver along with their related miners have been under a lot of selling pressure the last few months. Prices have fallen far enough to make most traders and investors start to panic and close out their long term positions which is a bullish signal in my opinion.
My trading tactic for both swing trading and day trading thrive on entering and exiting positions when panic trading hits an investment. General rule of thumb is to buy when others are extremely fearful and cannot hold on to a losing position any longer. When they are selling I am usually slowly accumulating a long position.
Looking at the charts below of gold and silver you can see the strong selling over the past two weeks. When you get drops this sharp investors tend to focus on their account statements watching the value drop at an accelerated rate to the point where they ignore the charts and just liquidate everything they have to preserve their capital. A few weeks ago I posted my outlook on precious metals which seems to be unfolding as expected: http://www.thegoldandoilguy.com/precious-metals-miners-making-waves-and-new-trends/
Gold Bullion Weekly Chart:
The price and outlook of gold has not really changed much in the past year. It remains in a major bull market and has been taking a breather, nothing more. Stepping back and reviewing the weekly chart it’s clear that gold is nearing long term support. With panic selling hitting the gold market and long term support only $20 – $30 dollars away this investment starts to look really tasty.
But if price breaks below the $1540 level and closed down there on a weekly basis then all bets are off as this would trigger a wave of selling that would make the recent selling look insignificant. And the uptrend in gold would now be over.
Silver Bullion Weekly Chart:
Silver price is in the same boat as its big sister (Yellow Gold). Only difference is that silver has larger price swings of 2-3x more than gold. This is what attracts more traders and investors but unfortunately the masses do not know how to manage leveraged investments like this and end up losing their shirts.
A breakdown below the $26.11 price would likely trigger a sharp drop back down to the $17.50 level so be careful…
Gold Mining Stocks – Monthly Chart:
If you wanna see a scary chart then look at what could happen or is happening to gold miner stocks. This very could be happening as we speak and why I have been pounding the table for months no to get long gold, silver or miners until we see complete panic selling or a bullish basing pattern form on the charts. We have not seen either of these things take place although panic selling is slowly ramping up this week.
There will be some very frustrated gold bugs if they take another 33% hair cut in value… You can view some of my trading charts, setups and analysis free at my stockcharts.com list. Be sure to vote for me chartlist each day so I know its of value: https://stockcharts.com/public/1992897
Precious Metals Trend and Trading Conclusion:
In short, the precious metal sector remains in a cyclical bull market. That being said and looking at the daily charts the prices have been consolidating and are in a down trend currently. Until we see some type of bottoming pattern or price action form it is best to sit on the side lines and watch the emotional traders get caught up and do the wrong thing.
The next two weeks will be crucial for gold, silver and miner stocks. If metals cannot find support and close below the key support levels things could get really ugly fast. If you would like to receive my daily analysis and know what I am trading then check out my newsletter at: www.TheGoldAndOilGuy.com
Chris Vermeulen