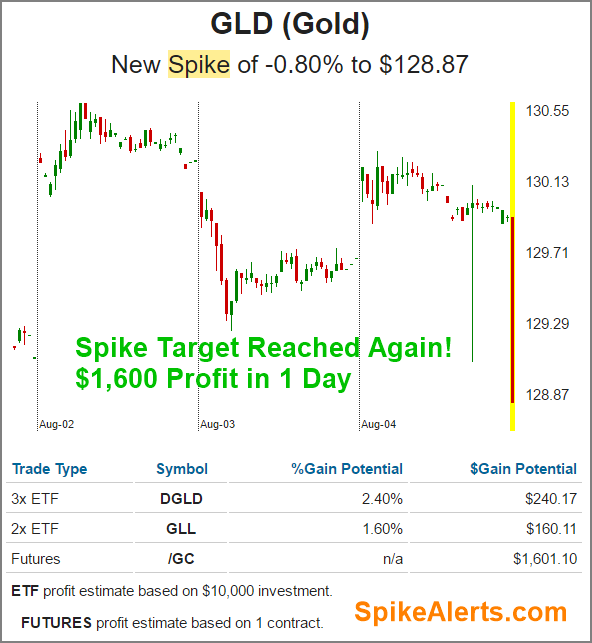
Here is my chart of GLD during post-market trading today (Thursday, Aug 4th). I sent this chart to my followers alerting them of the next day’s market bias/trend and trade setup.
If you don’t know what spike alerts are, let me explain briefly. In short, the market gives of these rogue price spikes which I have been able to filter and identify. On top of that, some data feeds filter their data depending on the chart timeframe you are loading and will only use the AVERAGE price and not every tick to create the price bar on the chart to remove these spikes.
Meaning, even if your charting platform and data feeds don’t filter out these rogue price spikes then you may only see these price spike with specific chart time frames like the 30-minute or a 10-minute chart. It varies from day to day and when these special rogue spikes happen.
Bottom line, if you see these spikes, 80% of the time we see the price spike target reached within 24-48 hours.
Thursday Aug 4th Spike Alert:
This shows you the spike down as it was taking place with my automated spike identification software. This spike took place right after the market closed Thursday giving us several hours in afterhours trading to enter the trade (short gold, or buy an inverse ETF).
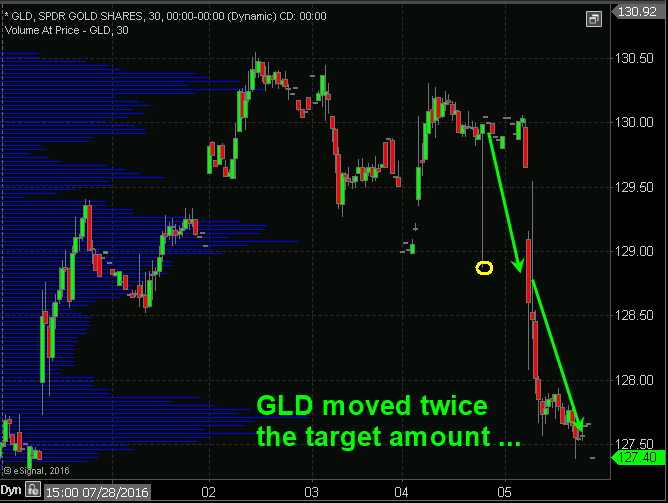
GLD didn’t only drop to the price target of $128.87, but gap below that and continued to fall all session closing at $127.55 a share. There are many ways to play these spikes in price of gold. You can trade the ETFs or futures contract as shown in the chart below, or trade the even faster moving ETFs like DUST or NUGT, GDX, GDXJ, or even a high beta gold miner stock.
Trading Chart Post Spike Alert:
Back in April/March I shared many of these spike alerts trade setups and I also talked about the best ways to trades them and my recommended USA/Canadian broker and also the CFD and spread betting firms I use.
Check out this post showing spike alerts in more detail and best brokers: Click Here
Trading Conclusion:
In short, while most price spike alerts are not huge by any means, in many cases these spikes will provide $1-$3 per share profit and if you are active trader with 500 or 1000 share lots or trading futures with a $5000 account size you can making some decent weekly/monthly gains with these special price spikes.
Get My Special Secret Spike Alerts Today:SPIKE ALERTS
Gold has a “clear presence” to play in a world dominated with ‘global economic uncertainty”
My analysis shows that gold will be implemented to protect ‘global purchasing power’ and minimize losses during our upcoming periods of ‘market shock’. It serves as a high-quality, liquid asset to be used when selling other assets would cause losses. Central Banks of the world’s largest long-term investment portfolios use gold to mitigate portfolio risk in this manner and have been net buyers of gold since 2010.
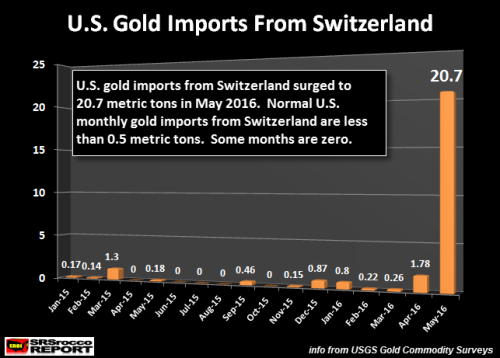
Investors should make use of gold’s lack of ‘correlation’ with other assets which makes it the best hedge against currency risk. There was a huge trend change in U.S. gold investment last May 2016. Switzerland is now a major source of U.S. gold exports. The tables turned back in May 2016 as the Swiss exported a record amount of gold to the United States. There has been a huge increase in gold flows into the Global Gold ETFs & Funds. Something seriously changed in May 2016 as the Swiss exported more gold to the U.S. in one month than they have every year for several decades.
Though we are in for a period of great financial turmoil, investors can safeguard themselves by investing smartly in gold. Do not be left behind and see your dollar assets lose value. Invest in gold!
It is in these conditions gold is the only investment that will appreciate in time.
The world including Russia, Syria, Libya, North Korea, the South China Sea, Venezuela and social discord from Europe to the U.S., it is difficult to make the case for any good news. Gold will continue to perform its role as a “safe haven” in these times of crisis which appear to be never ending. The metals surge of as much as 8.1 percent on the day of the “Brexit” vote last month is an indicator that its’ luster of safety is undimmed in the current market. There’s little to be gained from arguing whether such beliefs are right or wrong: “The market can stay irrational longer than you can stay solvent”.
The list of prominent hedge fund managers backing gold is lengthening. Paul Singer, of Elliott Management Corporation, is the latest name to lend his support. It is likely that more investment institutions will turn to gold as the logical way to countervail the effects of many years of quantitative easing.
“It’s a glaring warning sign of deflation. We’ve never really had deflationary fears throughout such a widespread part of the world before,” said Phil Camporeale, a multi-asset specialist at JPMorgan Asset Management.
These accommodative Global Central Bank policies has lead to monetary easing policies that have been adopted globally. It is not so much that the U.S. Dollar has become strong the last few weeks. The “systemic” uncertainty of the recent “Brexit” vote in the U.K. resulted in the U.S. Dollar became a “safe haven”.
The FED is doing everything in its power to prevent a rise in the dollar. They are willing to “orchestrate” any scenario where the stock market continues to soar and people will feel a “wealth effect” from new stock market highs and fight the argument that the economy is “contracting”. The FED is getting everything it wants in this regard and will continue to do so. The number one priority of the FED is “debasing” the U.S. Dollar. Gold can rise even if the dollar continues to rise
Investors of all levels of experience are attracted to gold as a solid, tangible and long-term “store of value” that historically moved independently of other assets classes
Golds’ importance even in today’s environment was clearly visible during the massive rally during the start of the year, when all other asset classes were tanking. Investors piled on gold on a scare of a likely financial crisis in the world.
Investors should make use of Gold’s lack of ‘correlation’ with other assets which makes it the best hedge against currency risk.
Though we are in for a period of great financial turmoil, investors can safeguard themselves by investing smartly in gold. Don’t be left behind and see your dollar assets lose value. Invest in gold.
It is in these conditions that one of the best investments is gold.
Talk of further “unconventional” monetary policies globally has increased. Japan has reached the limit of what negative interest rates and quantitative easing have achieved. The Bank of Japan may adopt a policy of so-called “Helicopter Money”.
Dr Loretta Mester, President of the Federal Reserve Bank of Cleveland and a member of the rate-setting Federal Open Market Committee (FOMC), signalled direct payments to households and businesses to stoke spending was an option Central Banks might look at in addition to interest rate cuts and quantitative easing.
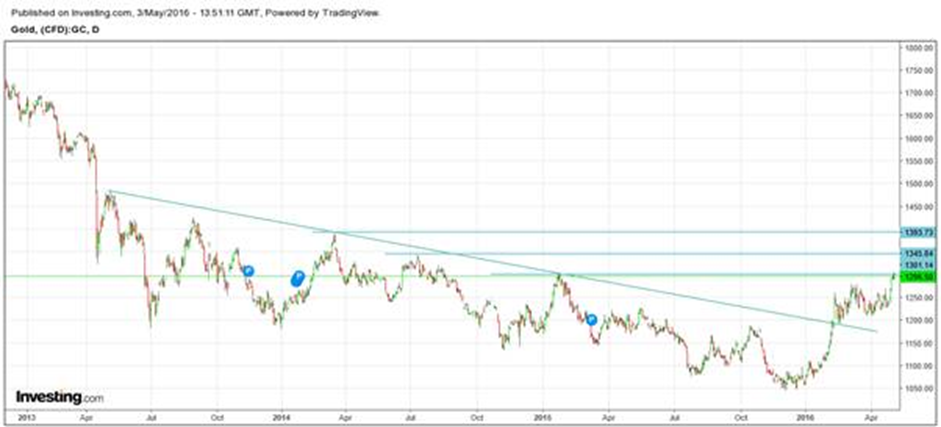
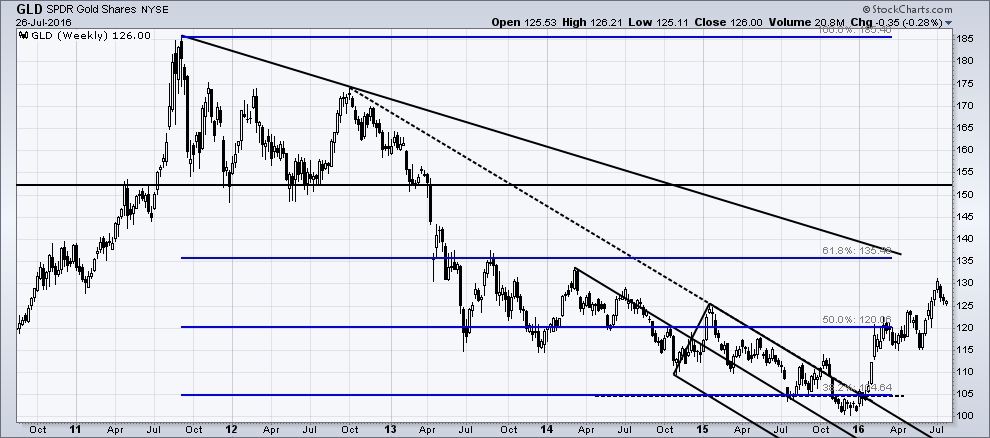
However, back in April 2016, if you have followed my recommendation, you would have maintained that once gold crossed the $1190/oz. levels, it was destined to go higher. Above the downtrend line, which acted as a resistance from 2013 and onwards, the trend altered and it appears to be extremely highly unlikely that it will reverse downwards, at all!
However, the head and shoulder formation tested my resolve to buy into gold, as it is a most reliable bearish pattern, but, once a bearish pattern fails, it becomes very bullish which is what has happened in this case. I was quick to alert my subscribers to buy as soon as the pattern was triggered.
“We’re always assessing tools that we could use,” Dr Mester said in response to a question about the potential use of “Helicopter Money”. However, Dr Mester signalled that in the event of another shock or economic downturn that most likely option would be more quantitative easing-style money printing.
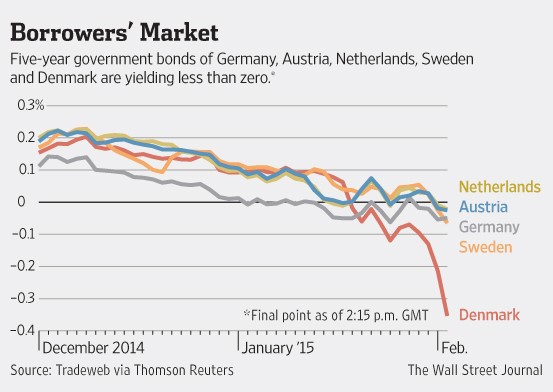
Global Government Bond rates are negative:
Global rates are at zero too negative, money will continue to chase gold and U.S. Treasuries for the higher yield. This will continue to push yields lower as the global economy continues to slow. What would cause this to reverse? It would require either an “economic rebound” or a complete “loss of faith” in the U.S. to pay its debts such as a collapse of the U.S. Government.
Addicted to debt:
The total amount of government bonds in the world that have negative yields are currently $13 trillion, according to Bank of America Merrill Lynch. Given that there were almost zero negative-yielding bonds just two years ago, the rise is “incredible”. Do not be surprised to see $15 trillion to $20 trillion worth of negative-yielding government debt by the end of this year. The yield on short-term government include Switzerland, Belgium, Denmark, France, Germany, Japan, and the Netherlands which are all sub-zero. Even short duration U.S. bond rates are barely above zero. Bonds are not fixed-income assets anymore now as fixed-outgoings once were ones. Investors are currently buying them for their ‘capital appreciation’ rather than their ‘coupon payments’.
Gold is currently in a correction. In this upcoming August of 2016, gold is set to surge much higher and surprise ALL. As you can see from the chart below, I am targeting 135 level on GLD.
Global Central Banks have yet to ‘manufacture’ inflation!
This trend will continue to grow for now, until, just like in 2008, the bubble bursts in “cataclysmic fashion. ”
The Central Banks are manipulating the fabric of price-time by reversing the flow of time via negative interest rates. Therefore, the global financial system no longer possesses the “productive capacity” to generate any income to sustain current equity asset values.
My own economic outlook is “invaluable” and is a must have if one wishes not only to save their wealth to profit themselves handsomely from this current “gloomy” crisis that is only worsening behind the scenes. There are many ways to survive, protect, and grow one’s financial position in this prolonged economic downturn.
The end of the Great “Keynesian” Experiment is upon us. Follow my lead as we navigate through the various financial markets using cycle price forecasting, technical analysis, my secret pre-market price spike intraday trend indicator for accurate swing trades and long term ETF investment positions. Copy what I do in both of my portfolios – Active Trading & Long Term Investing at www.TheGoldAndOilGuy.com
Chris Vermeulen
https://thegoldandoilguy.com/wp-content/uploads/2014/07/gold-forecast.jpg369553adminhttp://www.thegoldandoilguy.com/wp-content/uploads/2014/11/tgaoglogo.pngadmin2016-08-04 18:01:592016-08-04 18:01:59Does Gold Continue Its Bull Market Towards $1500 or Crash?
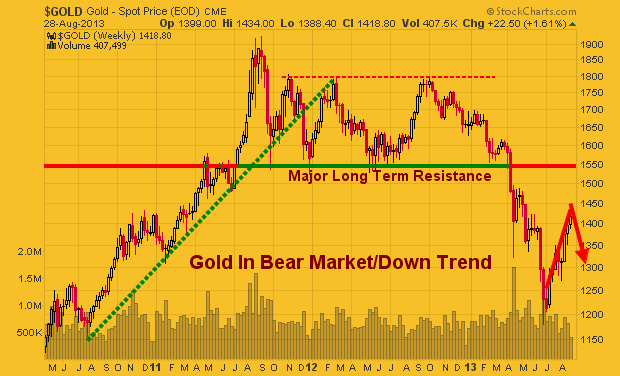
The precious metal market has been stuck in a strong down trend since 2012. But the recent chart, volume and technical analysis is starting to show some signs that a bottom may have already taken place.
This report focused on the weekly and monthly charts which allow us to see the bigger picture of where the precious metals sector stands in terms of its trend.
This chart clearly shows the trends which gold has gone through in the last three years. With simple technical analysis trend lines, clearly price is nearing a significant apex which will result in a strong breakout in either direction.
Remember, this is the weekly chart, so we could still have another month or three of sideways chatter to work through. But a breakout in either direction will trigger a large move.
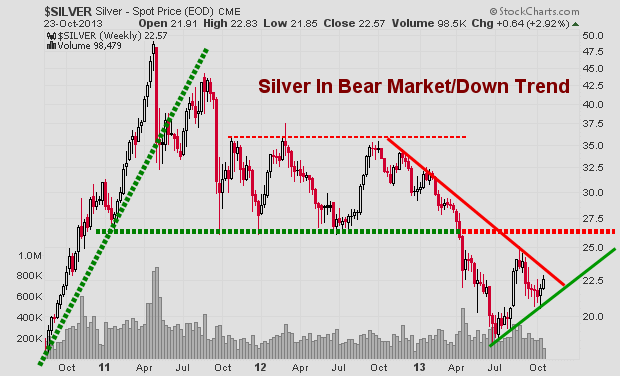
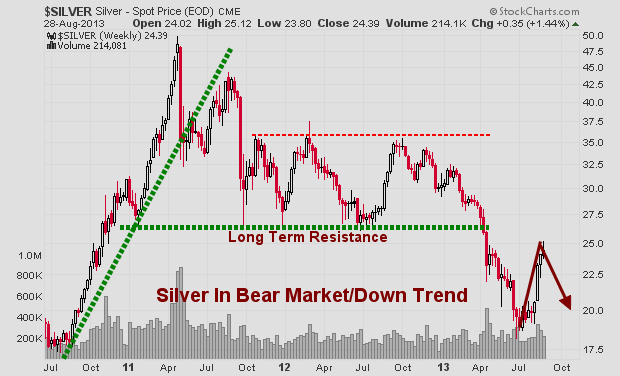
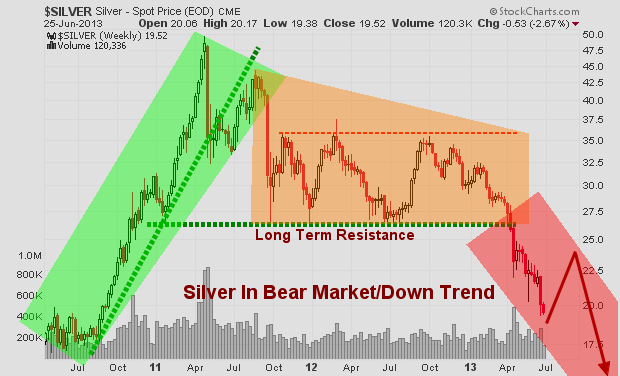
Silver Spot Price – Weekly Chart
Silver is also stuck in a similar pattern. Currently the odds still favors lower prices and for the upper resistance trend line to reject price and send it lower. But if we keep out eye on the leading indicators like gold miners, we may be able to catch a breakout or traded the rejection of resistance in the next month or so.
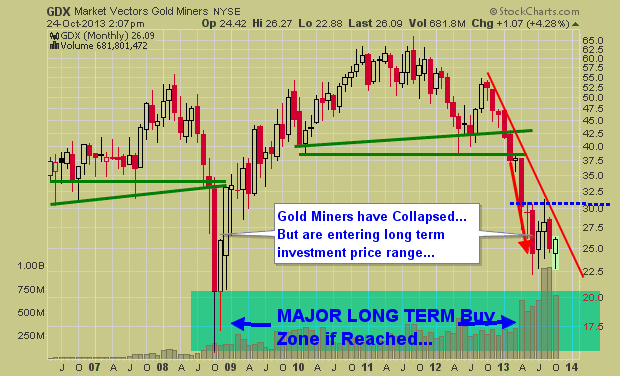
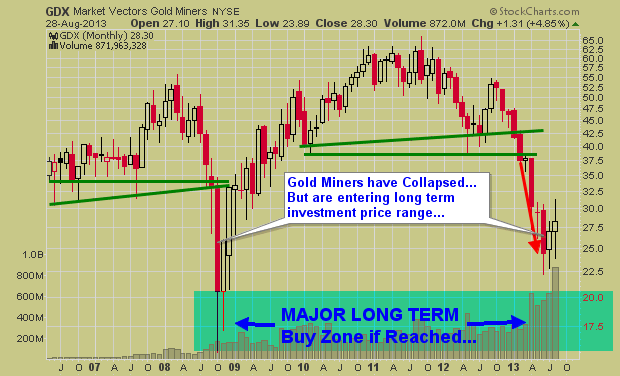
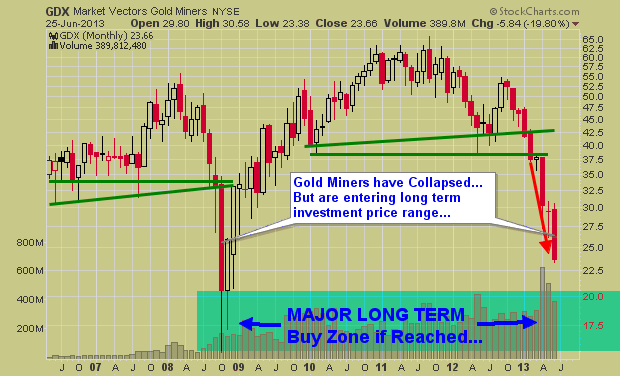
Gold Mining Stock ETF – Monthly Chart
Gold miners have a very sloppy looking chart. Price is extremely volatile and the recent price action in 2013 could go either way VERY quickly. I have a gut feeling GDX in the coming months could have a washout bottom and tag the $20 price level. While I hope I am wrong for many investors sake, if it does happen, it will be a very strong investment level to accumulate a position.
Precious Metals Bigger Picture Outlook:
In short, I remain neutral – bearish for this sector. In the next 1-3 months we are likely to see some strong price action which will be great. We need a breakout or bottoming pattern to form before we get involved at this level.
I know everyone is dying to get involved in precious metals again for another huge rally… but sometimes it’s just best to wait for the big picture chart to catch up with your bias before taking a position of size.
Get My Free Weekly Trading Sector Reports
Delivered To Your Inbox: www.GoldAndOilGuy.com
http://www.thegoldandoilguy.com/wp-content/uploads/2014/11/tgaoglogo.png00adminhttp://www.thegoldandoilguy.com/wp-content/uploads/2014/11/tgaoglogo.pngadmin2013-10-24 14:56:192014-03-04 14:05:43Precious Metals: Gold, Silver and Miners Are Trapped
It has been a bumpy ride for precious metal investors over the past couple of years and it unfortunately I do not think its over just yet.
The good news is that the bottom has likely been put in for gold, silver and gold miners BUT the recent rally in these metals and miner looks to be coming to an end. While we could see another pop in price over the next week or so the price, volume and momentum see to be stalling out.
What does this mean? It means we should expect short term weakness and lower prices over the next month or two.
Below are three charts I posted several months ago on my free stockcharts list. These forecast were based off simple technical analysis using cycles, Fibonacci and price patterns. As you can see we are not trading at my key pivot level which I expect selling pressure to start to increase and eventually overpower the buyers sending the prices lower.
Gold Trading Weekly Chart:
Here you can see that gold is technically in a bear market when viewing it on the weekly chart. If you were to pull up a daily chart you would likely notice how the price of gold is trading at a key resistance level on the chart and has reached its full flag measured move.
What does this mean? It means the odds are pointing to lower prices for gold in the next few weeks. Keep in mind though I do feel as though a major bottom has been put in place for the precious metals sector. So buyers are likely to step back in around the $1300 area.
Silver Trading Weekly Chart:
Silver has a little bit different looking chart but the same analysis applies here as it did in gold.
Gold Miners Trading Monthly Chart:
Gold miners may have bottomed on this monthly investing timeframe chart but the daily chart which you will see next clearly shows short term weakness has started.
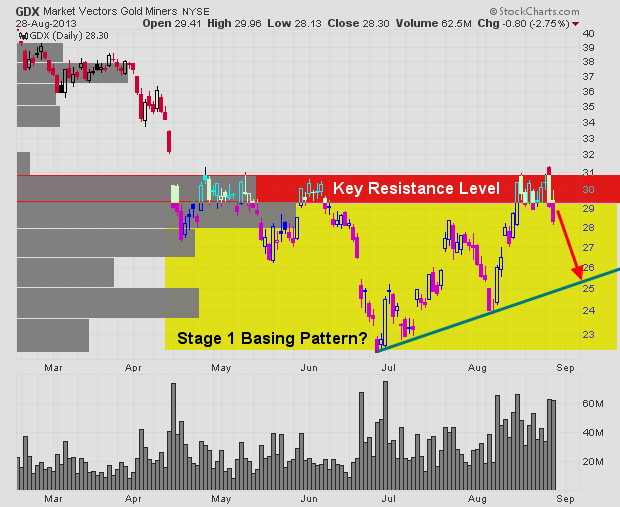
Gold Miners Trading Daily Chart:
This daily chart really shows my thinking for miners and the overall precious metals sector as a whole. The recent weakness in gold miners to the down side point to distribution of shares. This is very negative for the price of physical gold and silver as gold mining stocks tend to lead physical metals.
The yellow box shows a possible major stage 1 basing pattern forming. If this is the case, then we will have a great opportunity in the coming months when the precious metals down trend completes a reversal and start heading higher.
How to Trade Precious Metals & Gold Miners Conclusion:
In short, I think that staying in cash or shorting metals is the play for the next couple weeks. After that anything can happen and until price breaks down or finally completes the basing pattern and confirms a market bottom I would be very cautious trading here.
In the last week members of my trading newsletter took profits on our short SP500 trade and we closed a long trade in natural gas for a quick 6.5% gain. Join our community of traders and have your money on the right side of the market!
Find out what the SP500, Gold, Silver, Miners, Bonds, Oil and Nat Gas Are Setting Up For!
http://www.thegoldandoilguy.com/wp-content/uploads/2014/11/tgaoglogo.png00adminhttp://www.thegoldandoilguy.com/wp-content/uploads/2014/11/tgaoglogo.pngadmin2013-08-16 10:47:252013-08-16 10:47:25SellOff in Stocks Gives Us Some High Probability Setups
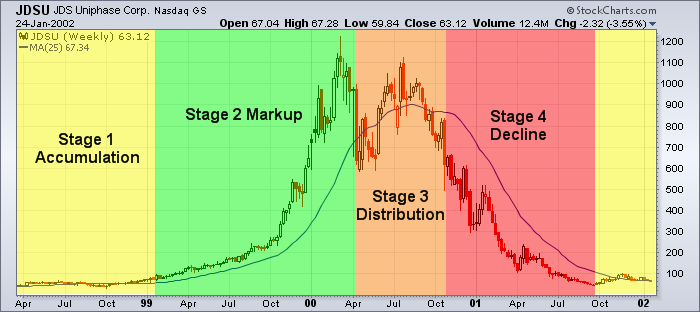
The life cycle of most things not matter what it is (living, product, service, ideas etc…) go through four stages and the stock market is no different. Those who recently gave in and bought gold, silver, mining stocks, coins will be enter this stage of the market in complete denial. They still think this is a pullback and a recover should be just around the corner.
Well the good news is a recovery bounce should be nearing, but if technical analysis, market sentiment and the stages theory are correct then a bounce is all it will be followed by years of lower prices and dormancy.
I really do hate to be a mega bear or mega bull on anything long term but the charts have painted a clear picture this year for precious metals and I want to share what I see. Take a look at the chart below which shows a typical investment life cycle using the four stage theory.
The Four Stages Theory
Classic economic theory dissects the economic cycle into four distinct stages: Accumulation, Markup, Distribution, and Decline. Stock, index or commodities are no different, and proceeds through the following cycle:
Stage 1 – Accumulation: After a period of decline a stock consolidates at a contracted price range as buyers step into the market and fight for control over the exhausted sellers. Price action is neutral as sellers exit their positions and buyers begin to accumulate.
Stage 2 – Markup: Upon gaining control of price movement buyers overwhelm sellers and a stock enters a period of higher highs and higher lows. A bull market begins and the path of least resistance is higher. Traders should aggressively trade the long side, taking advantage of any pullback or dips in stock price.
Stage 3 – Distribution: After a prolonged increase in share price the buyers now become exhausted and the sellers again move in. This period of consolidation and distribution produces neutral price action and precedes a decline in stock price.
Stage 4 – Decline: When the lows of Stage 3 are breached a stock enters a decline as sellers overwhelm buyers. A pattern of lower highs and lower lows emerges as a stock enters a bear market. A well-positioned trader would be aggressively trading the short side, taking advantage of the often quick decline in share price.
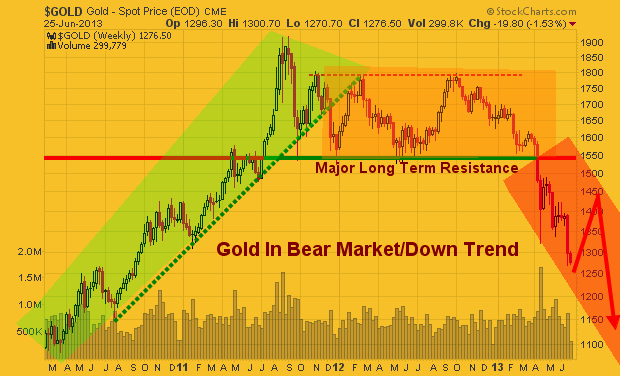
Gold Price Weekly Chart – Stages Overlaid
Silver Price Weekly Chart – Stages Overlaid
Gold Mining Stocks – Monthly Chart
This chart is a longer term picture using the monthly chart. I wanted to show you the 2008 panic selling washout bottom in miners which I think is about to happen again. While physical gold and silver are in a bear market and should be some a long time, gold mining stocks will likely find support and possibly have a strong rally in the coming months.
Many gold stocks pay high dividends and are wanted by large institutions and funds. The lower prices go the higher the yield is making them more attractive. So I figure gold miners will bottom before physical metals do. A bounce is nearing but at this point selling pressure and momentum continue to plague the entire PM sector.
Precious Metals Investing Conclusion:
In short, I feel with Quantitative Easing (QE) likely to be trimmed back later this year, and with economic numbers slowly improving along with solid corporate earnings the need or panic to buy gold or silver is diminishing around the globe.
While there are still major issues and concerns internationally they do not seem to have any affect on precious metals this year. Long terms trends like the weekly and monthly charts shown in this report tends to lead news/growth/lack of growth by several months. So lower precious metals prices may be telling us something very positive.
The precious metals sector is likely to put in a strong bounce this summer but after sellers will likely regain control to pull prices much lower yet.
http://www.thegoldandoilguy.com/wp-content/uploads/2014/11/tgaoglogo.png00adminhttp://www.thegoldandoilguy.com/wp-content/uploads/2014/11/tgaoglogo.pngadmin2013-06-26 09:43:342014-03-05 13:21:16Precious Metals Life Cycle Nears an End – Final Stage of Denial
http://www.thegoldandoilguy.com/wp-content/uploads/2014/11/tgaoglogo.png00adminhttp://www.thegoldandoilguy.com/wp-content/uploads/2014/11/tgaoglogo.pngadmin2013-06-25 08:37:032013-06-25 08:37:03Big Money Making Trades for July – Gold Miners, Nat Gas, SP500
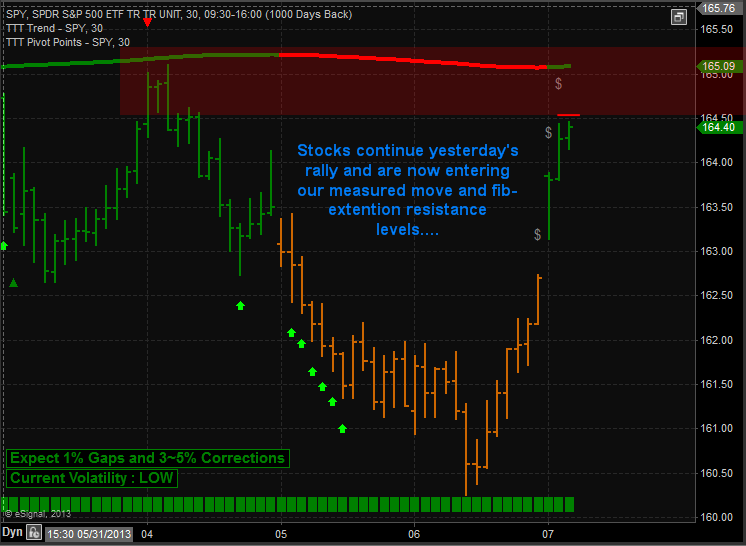
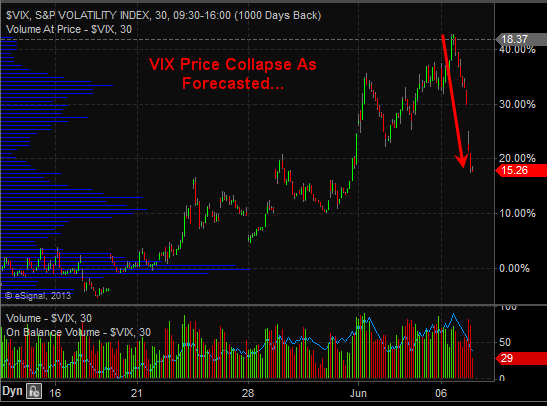
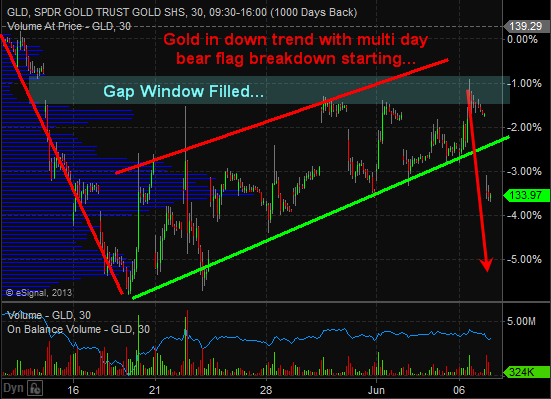
This week has played out perfectly thus far. The expected volatility of intraday price swings and lower prices for stocks has happened. The Vix has collapsed the 15% which I mentioned would happen just 2 days ago and money is flowing out of precious metals and miners today in a big way as that risk off money is now moving into Risk-On Stocks.
My partner who focuses exclusively on Small Cap Stocks and 3X Leveraged ETF’s have been cleaning up this week also. Take a look at how he How We Nailed The Market Low for 4.6% in 24 hours
I just want to mention that all markets are connected (intermarket analysis) We are long the SP500 which is how I want to play this move because it carries the least amount of risk and volatility then other investments. That being said a trade could instead short gold or short the vix. Many ways to play moves like this in the market. One thing to remember though is that each of these moves are the same trade. so buying a position in each is just multiplying your exposure and if this bottom in stocks didn’t take place you would get your head handed to you on a silver platter. Again I am here for market guidance and to share low risk setups as I see fit. You can trade all you want around analysis as many of you do on your own.
Charts Show it all in Detail below:
WATCH TODAY’S VIDEO FOR FULL EXPLANATION:
Get This Type of Analysis Multiple Timer Each Trading Day Delivered to YOUR INBOX!
It has been a very long couple of years for the precious metal bugs. The price of gold, silver and their related mining stocks have bucked the broad market up trend and instead have been sinking to the bottom in terms of performance.
Earlier this week I posted a detailed report on the broad stock market and how it looks as though it‘s uptrend will be coming to an end sooner than later. The good news is that precious metals have the exact flip side of that outlook. They appear to be bottoming as they churn at support zones.
While metals and miners remain in a down trend it is important to recognize and prepare for a reversal in the coming weeks or months. Let’s take a look at the charts for a visual of where price is currently trading along with my analysis overlaid.
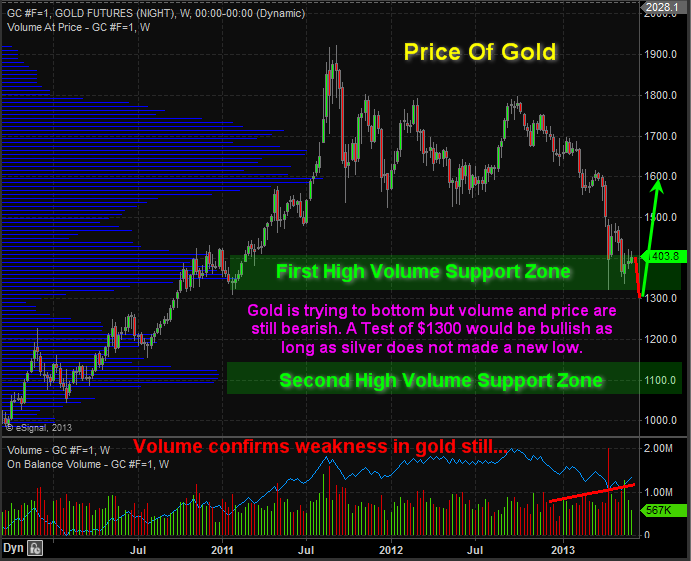
Weekly Price of Gold Futures:
Gold has been under heavy selling pressure this year and it still may not be over. The technical patterns on the chart show continued weakness down to the $1300USD per once which would cleanse the market of remaining long positions before price rockets towards $1600+ per ounce.
There is a second major support zone drawn on the chart which is a worst case scenario. But this would likely on happen if US equities start another major leg higher and rally through the summer.
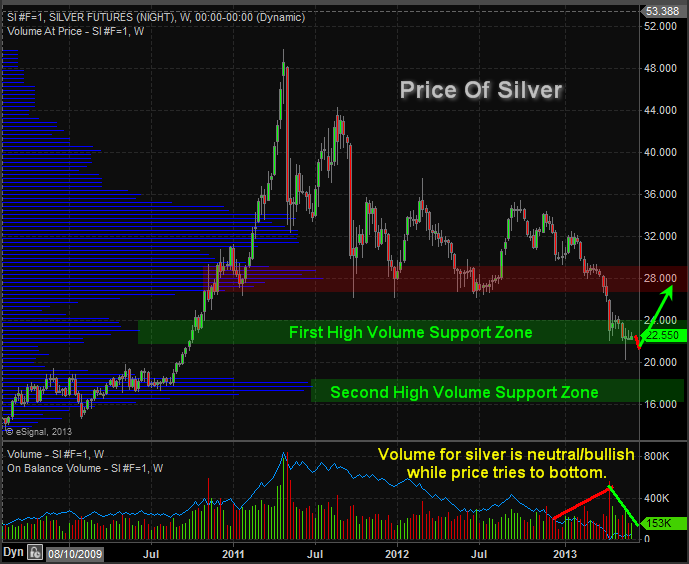
Weekly Price of Silver Futures:
Silver is a little different than gold in terms of where it stands from a technical analysis point of view. The recent 10% dip in price which shows on the chart as a long lower candle stick wick took place on very light volume. This to me shows the majority of weak positions have been shaken out of silver. Gold has not done this yet and it typically happens before a bottom is put in.
While I figure gold will make one more minor new low, silver I feel will drift sideways to lower during until gold works the bugs out of the chart.
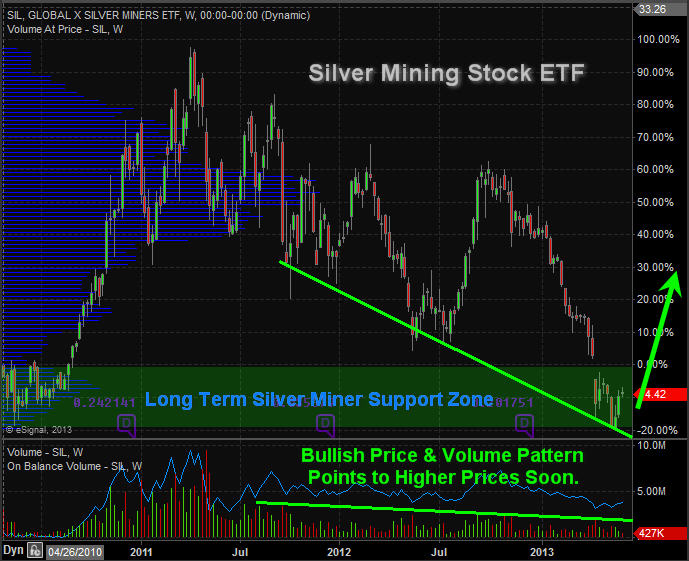
Silver Mining Stock ETF – Weekly Chart:
Silver miners are oversold and trading at both horizontal support and its down support trendline. Volume remains light meaning traders and investors are not that interested in them down where and it should just be a matter of time (weeks/months) before they build a basing pattern and start to rally.
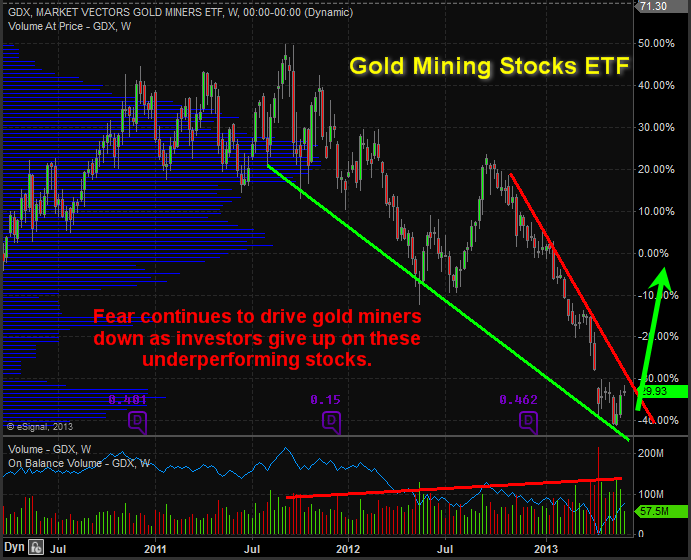
Gold Mining Stock ETF – Weekly Chart:
Gold mining stocks continue to be sold by investors with volume rising and price falls. Fear remains in control but that may not last much longer.
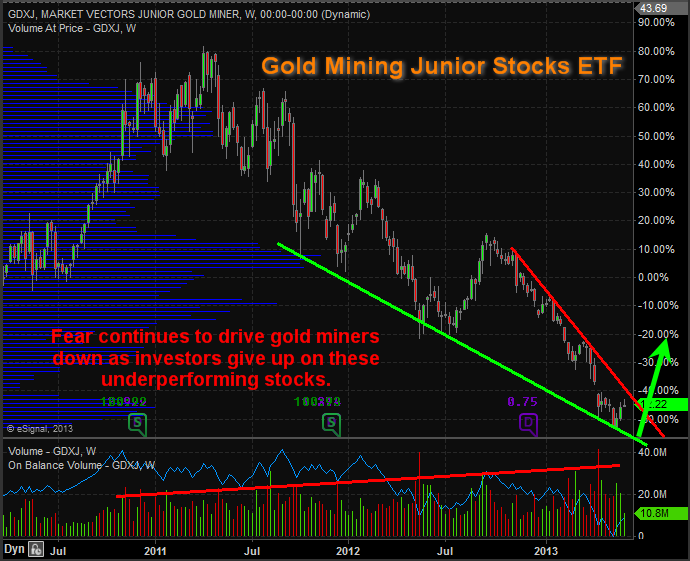
Gold Junior Mining Stock ETF – Weekly Chart:
Gold junior miners are in the same boat with the big boys. Overall gold and gold miners are still being sold while silver and silver stocks are firming up.
Precious Metals Trading Conclusion:
In the coming weeks we should see the broad stock market top out and for gold miners along with precious metals bottom. There are some decent gains to be had in this sector for the second half of the year but it will remain very dicey at best.
If selling in the broad market becomes intense and triggers a full blown bear market money will be pulled out of most investments as cash is king. Gold is likely to hold up the best in terms of percentage points but mining stocks will get sucked down along with all other stocks for a period of time. This scenario is not likely to be of any issue for a few months yet but it’s something to remember.
Get My Daily Precious Metals Report Each Morning And Profit! www.TheGoldAndOilGuy.com
Chris Vermeulen
http://www.thegoldandoilguy.com/wp-content/uploads/2014/11/tgaoglogo.png00adminhttp://www.thegoldandoilguy.com/wp-content/uploads/2014/11/tgaoglogo.pngadmin2013-06-06 18:45:042014-03-06 11:16:06Gold, Silver & Precious Metal Miners Signals
Precious metals and their related mining stocks continue to underperform the broad market. This year’s heavy volume breakdown below key support has many investors and trader’s spooked creating to a steady stream of selling pressure for gold and silver bullion and mining stocks.
While the technical charts are telling me prices are trying to bottom we must be willing to wait for price to provide low risk entry points before getting involved. Precious metals are like any other investment in respect to trading and investing in them. There are times when you should be long, times to be in cash and times to be short (benefit from falling prices). Right now and for the last twelve months when looking at precious metals cash has been king.
Since 2011 when gold and silver started to correct the best position has been to move to cash or to sell/write options until the next trend resumes. This is something I have been doing with my trading partner who focuses solely on Options Trading who closed three winning positions last week for big gains.
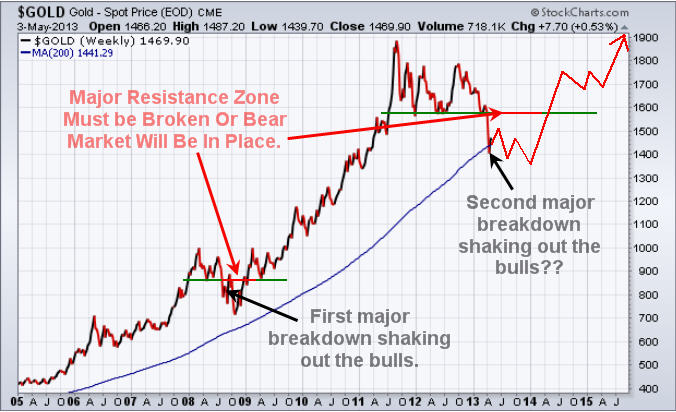
In 2008 we had a similar breakdown in price washing the market clean of investors who were long precious metals. If you compare the last two breakdowns they look very similar. If price holds true then we will see higher prices unfold at the end of 2013.
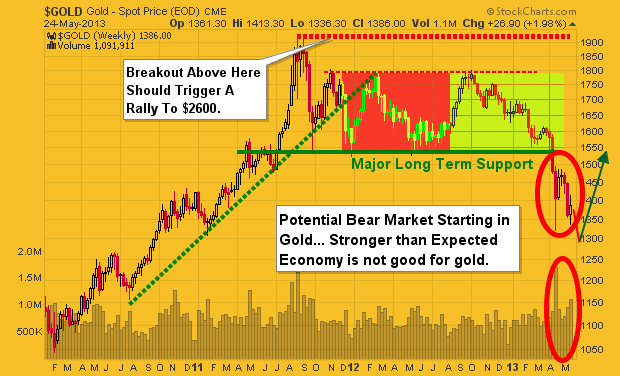
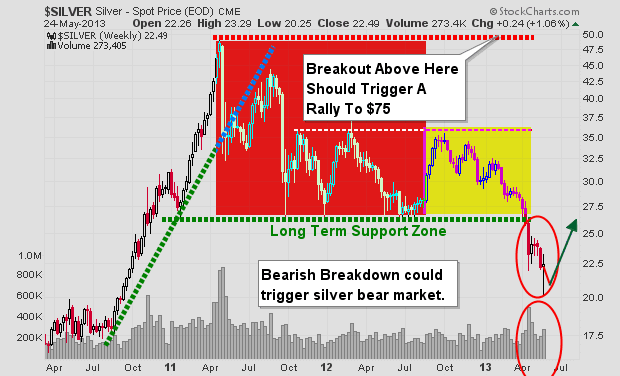
The key here is for the price to move and hold above the major resistance line. A breakout would trigger a rally in gold to $2600 – $3500 per ounce. With that being said gold and silver may be starting a bear market. Depending what the price does when the major resistance zone is touched, my outlook may change from bullish to bearish. Remember, no one can predict the market with 100% accuracy and each day, week and month that passes changes the outlook going forward.
The chart below is on I drew up on May 3rd. I was going to get a fresh chart and put my analysis on it but to be honest my price forecast/analysis has been spot on thus far and there is no need to update.
Major technical damage has been done to the chart of gold. Gold is trying to put in a bottom but still needs more time. I feel gold will make a new low in the coming month then bottom as drawn on the chart below.
Silver is in a similar as gold. The major difference between gold and silver is that silver dropped 10% early one morning this month which had very light volume. The fact that silver hit my $20 per ounce level and it was on light volume has me thinking silver has now bottomed.
But, silver may flounder at these prices or near the recent lows until its big sister (gold) puts in a bottom.
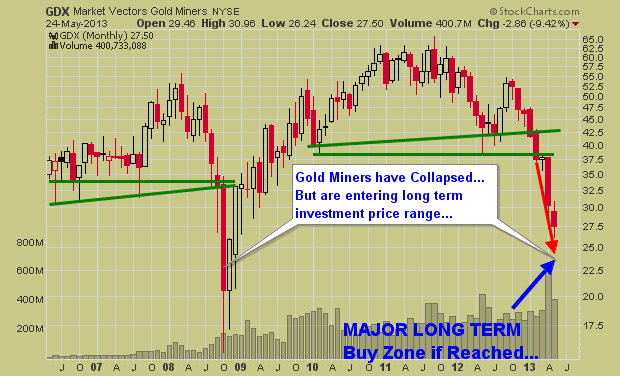
Gold Mining Stocks Monthly Investing Zone Chart:
Gold mining stocks broke down a couple months ago and continue to sell off on strong volume. If precious metals continue to move lower then mining stocks will continue their journey lower.
This updated chart which I originally drew in February warning of a breakdown below the green support trend lines would signal a collapse in stock prices, which is exactly what has/is taking place. While I do not try to pick bottoms (catch falling knives) I do like to watch for them so I am prepared for new positions when the time and chart turn bullish or provide a low risk probing entry point.
While I focus more on analysis, forecasts and ETF trading another one of my trading partners who focuses on Trading Stocks and 3x Leveraged ETF’s has been cleaning up with gold miners.
Gold, Silver and Mining Stocks Conclusion:
Precious metals continue to be trending down and while they look to be trying to bottom it is important to remember that some of the biggest percent moves take place in the last 10% of a trend. So we may be close to a bottom on the time scale but there could be sharply lower prices yet.
The time will come when another major signal forms and when it does we will be getting involved. The exciting this is that it could be just around the corner. So if you want to keep current and take advantage of the next major moves in the market be sure to join our newsletters.