The precious metal market has been stuck in a strong down trend since 2012. But the recent chart, volume and technical analysis is starting to show some signs that a bottom may have already taken place.

This report focused on the weekly and monthly charts which allow us to see the bigger picture of where the precious metals sector stands in terms of its trend.

Let’s take a look at a few charts below for a quick overview, but if you want more interesting ones visit: https://stockcharts.com/public/1992897

Gold Spot Price – Weekly Chart

This chart clearly shows the trends which gold has gone through in the last three years. With simple technical analysis trend lines, clearly price is nearing a significant apex which will result in a strong breakout in either direction.

Remember, this is the weekly chart, so we could still have another month or three of sideways chatter to work through. But a breakout in either direction will trigger a large move.

goldtrend


Silver Spot Price – Weekly Chart

Silver is also stuck in a similar pattern.  Currently the odds still favors lower prices and for the upper resistance trend line to reject price and send it lower. But if we keep out eye on the leading indicators like gold miners, we may be able to catch a breakout or traded the rejection of resistance in the next month or so.

silvertrend


Gold Mining Stock ETF – Monthly Chart

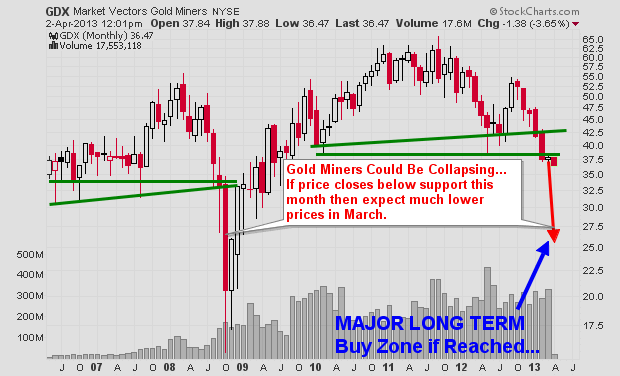
Gold miners have a very sloppy looking chart. Price is extremely volatile and the recent price action in 2013 could go either way VERY quickly. I have a gut feeling GDX in the coming months could have a washout bottom and tag the $20 price level. While I hope I am wrong for many investors sake, if it does happen, it will be a very strong investment level to accumulate a position.

gdxtrend


Precious Metals Bigger Picture Outlook:

In short, I remain neutral – bearish for this sector.  In the next 1-3 months we are likely to see some strong price action which will be great. We need a breakout or bottoming pattern to form before we get involved at this level.

I know everyone is dying to get involved in precious metals again for another huge rally… but sometimes it’s just best to wait for the big picture chart to catch up with your bias before taking a position of size.

Get My Free Weekly Trading Sector Reports
Delivered To Your Inbox: www.GoldAndOilGuy.com

“WOW” Friday’s Precious Metals Meltdown is an understatement…. I love seeing all this fear in the market and panic selling volume jump through the roof. This is or is the “start” of the washout bottom in metals I have been talking about for a few months. Critical support levels have been broken on gold, silver and miner stocks today. This is running the stops juicing up the sell side volume.

This size of a move WILL trigger a wave of margin calls come the end of the session and it could start another strong wave of selling into the closing bell. While I like this prices for both gold and silver, I know this could be just the start of more selling. I sound like a broken record but I am not trying to catch a falling knife unless it looks like a perfect setup. I still feel we could get another 1-3 days of selling or chop down here before things go higher so I will just watch the gold and bugs get stepped on again.

Remember this chart I posted a while back… it’s now coming true:

WATCH VIDEO ABOUT TODAY’S SILVER & GOLD SELLOFF: http://youtu.be/7dnM33V8dIo

Last day of the week is the most important for long term trends and investors. Today is going to be wild and may trigger a massive wave of selling which could be really good for those who know how to take advantage of it with me at: http://www.TheGoldAndOilGuy.com

Chris Vermeulen

The price of gold hit a record high this past week . . . in euro terms (at about 1380 euros). The record came after a number of actions by central banks around the world, trying to stimulate their respective economies. The actions, usually centered around money printing, once again had investors looking for refuge in gold.

Since the beginning of September, investors have bought about 75 tons of gold through exchange traded funds. Reuters says that gold ETFs, such as the largest gold ETF – the SPDR Gold Shares (NYSE: GLD), are on track for their biggest quarterly inflows in over a year, of 3.285 million ounces. Finally, according to UBS, investors have also raised their bullish bets on gold futures to the highest level in more than a year.

All the world’s major central banks took action recently including the Bank of Japan which launched a fresh round of monetary stimulus. The main action though was centered in Europe and the United States. The European Central Bank has promised to buy an unlimited quantity of eurobonds going forward. And the Federal Reserve announced its third round of monetary stimulus, QE3, that promises to buy $40 billion of mortgage-backed securities monthly on top of its ongoing Operation Twist program of buying long-dated Treasuries.

Speaking about the monetary easing, Barclays precious metals analyst Suki Cooper put it this way to the Financial Times, “Gold finally found the catalyst it had been waiting for all year after the Fed announced open-ended quantitative easing.”

Another reason for gold’s rise in euro terms, it must be noted, is the continuing fiscal turmoil in Europe itself, particularly in Spain. Spain’s largest autonomous region, Catalonia, manages an economy as big as Portugal’s. The problem is that it has debts of 42 billion euros which it is struggling to service. Catalonia has requested a 5 billion euro temporary bailout from Spain’s central government, adding to its debt burden. In a real show of defiance, Catalonia is also refusing to implement austerity measures. Add to that, bank stress tests in Spain showed that the country’s 14 largest lenders will need 60 billion euros in new capital.

No surprise then that physical demand for gold bars and coins in Europe rose 15 percent in the second quarter, according to the World Gold Council!

Another positive fundamental reason in the corner of gold bulls is the recent currency appreciation in the Indian rupee. India is traditionally the world’s largest consumer of gold. Sales have been slow there this year due to the government trying to slow down gold sales there through rises in a gold import tax. However, the recent rise in the rupee has made gold purchases more palatable and gold sales to India have hit their highest level in two months.

So for now, many of the fundamentals look to favor a move higher for gold, although there is technical resistance at its 2012 high of $1791.

Know when to buy gold, silver, oil and stocks – www.TheGoldAndOilGuy.com

Chris Verneulen