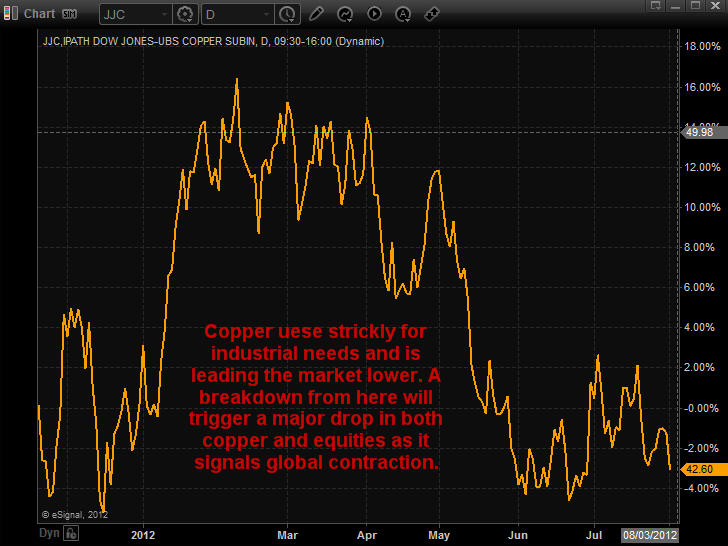
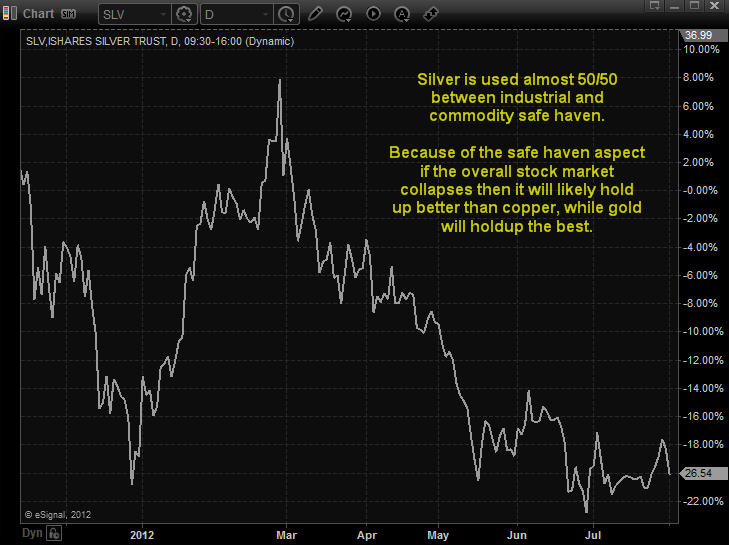
While the exchange traded funds for gold (NYSEARCA: GLD TRADING –  GLD QUOTE) and copper (NYSEARCA: JJC) fell today due to investors expressing disappoint at the modest response of the Federal Reserve to declining economic growth, it was silver (NYSEARCA: SLV Trading, SLV Quote) that was off the most.

SPDR Gold Shares (GLD) fell in trading today by 0.89%.    IPath Dow Jones Copper (JJC) dropped 1.89%.  Plunging the deepest was iShares Silver Trust (SLV), off by 2.14%.

SLV Trading

SLV Bullion Trust

Traders were hoping for more aggressive action by Federal Reserve Chairman Ben Bernanke.  But that will not come until after the November elections in the United States.  Remember that Quantitative Easing 2 did not begin until November 2010, though it was announced at the Jackson Hole economic policy summit in August of 2010.

Silver is in what would seem to be the “sweet spot” between gold and copper.  Almost all of gold is used for investment or decorative purposes.  Almost all of The Red Metal goes for industrial needs.   For silver, it comes almost down right in the middle between commercial and a commodity for investments or jewelry.  The charts below show the trading relationship for each of the exchange traded funds when paired against each other.

JJC Copper ETF Trading

JJC Copper ETF Trading

Even though silver has a much higher industrial usage, the SLV moves along with the GLD.   As a result, it soared during Quantitative Easing 2.  Obviously, the charts reveal that most of the trading is from speculators as the JJC should move in an inverse relationship with the GLD.  That is due to gold being used almost entirely for non-industrial end uses while copper is used almost industrial for industrial uses.

Up slightly for the week as traders thought more dramatic economic stimulus efforts would result from the Federal Open Market Committee meeting  other than an extension until the end of the year for Operation Twist, the SLV is down for the last month, quarter, six months and 52 weeks of market action.  Year to date, the SLV is off by 1.48%.

For the last year, however, the SLV is down 33.35%.  Volume was up today, with the SLV below its 20-day, 50-day and 200-day moving averages.  In the most obvious trend, it is trading much lower under its 200-day day moving average at 11.67% down than underneath the 20-day moving average, beneath it by only 0.17%.  The only move worth noting in the technical indicators for silver were the long engulfing green bodies last week after Treasury Secretary Geithner’s  gloomy testimony on The Hill and more bad economic news from the US peaked buying as traders thought Quantitative Easing 3 was coming.

SLV ETF Trading

SLV ETF Trading

If traders long on silver are looking for help from Bernanke, it will not be coming until after the November election, though it could be announced when he speaks later this month at Jackson Hole.


Chris Vermeulen

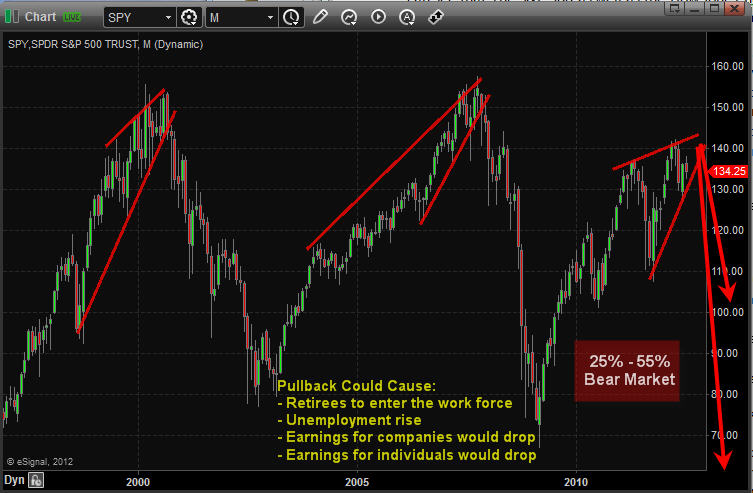
As mentioned last Friday just before things took a dive on the weekend, a look at the major market indices did not look promising.  If we take an even longer term look and examine the monthly charts we can see that The S&P 500 as well as the Dow Jones have been approaching multi-decade rising channel resistance lines.  Further, they also appear to be forming bearish rising wedge patterns.


Monthly Long Term Chart Analysis & Thoughts:

Monthly SPX Index Trading

As many of my longer term subscribers can attest to, I always preach that technical analysis is one part  art and one part science:  you can never be completely certain on what the outcome of a pattern is going to be.  However, we can use historical analysis to make better investments. The great American Novelist Mark Twain probably said it best in that “history does not repeat itself, but it rhymes”.  Regarding a rising wedge pattern, we know that roughly two-thirds of the time they will break to the downside.  This also means that one-third of the time they break to the upside.

In accomplishing our goal of capital growth we must do a number of things.  We must make returns on our investments, we must protect our investments, and we must limit our losses.  While all three aspects work in tandem with each other, there are times when focus must be allocated to one specific approach.

Regarding the current technical setup, I’m not so focused on the 67% chance that these wedges will break to the downside, but more so the impact of each outcome on the average Joe’s portfolio and mom and pop businesses.  The S&P 500 and the Dow are approaching long term resistance lines that have been in place for decades.  If we do break to the downside, which I suspect we will, there could be a very significant sell off with consequences that no one can predict at this point though I mention some things in the chart above.  Alternatively, there is significant overhead resistance in the various indices, and I don’t believe an upside break would be too monumental.

That being said, I always like to keep an open outlook and wait for the right opportunity.  I’m trying to think of scenarios that would prelude further upside action and I really am not coming up with much.  As evidenced by the completion of the recent 5 wave uptrend on the S&P that coincided nicely with the various quantitative easing policies, Ben Bernanke and the fed have had less and less impact.  I truly can’t see many fiscal developments that would prompt any significant bullish action.

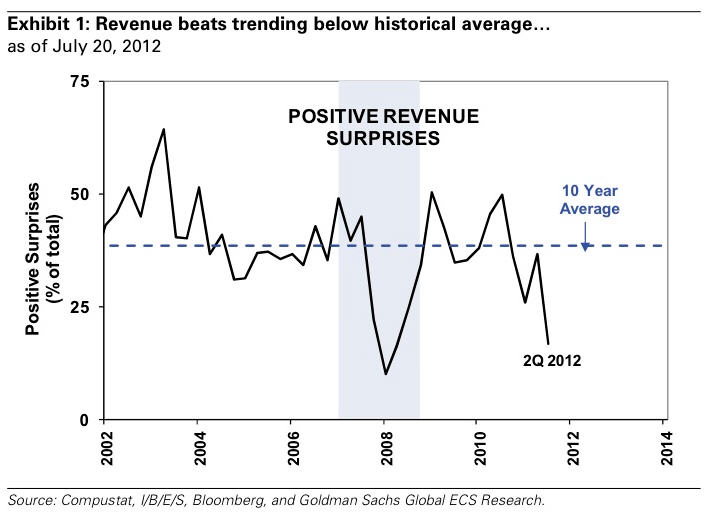
The only scenario I really think that could pump up equities is a series of positive earnings announcements.  A lot of expectations, earnings numbers, guidance, etc… have been revised downwards over the last couple of quarters, so there is the opportunity for some positive surprises that could lead to some bullish price action.  In absence of such a scenario, I really can’t think of much else that would prompt a run up.

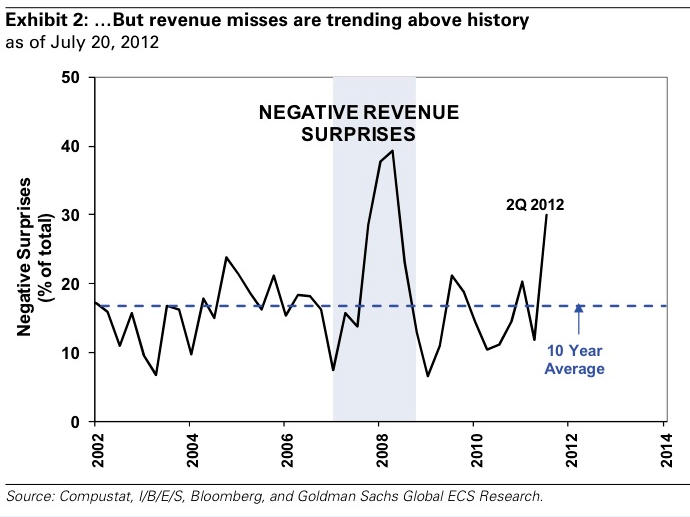
Look at these charts of positive and negative earnings surprises… and the dates and remember what happened following this negative data….


Positive Earnings Surprise

Earnings Positive SurprisesEarnings Positive Surprises


Negative Earnings Surprise

Earning Negative Surprises

That being said, I am recommending two courses of action.  For those steadfast bulls, lock in some profits and/or buy some protection.  Missing out on some of the upside is a lot better than losing some of the gains you have fought so hard for over the past couple of years.  For the more aggressive traders and investors, start following my updates a little more regularly as I foresee many shorting opportunities coming up in the future.  As many of you know, sell-offs are often quick and abrupt, and timing is extremely important when playing the downside.

Further, trading could get very volatile in the near future.  Historically, and even more so looking forward as August and September have been very costly for the average investor.  Our focus will be in taking the highest probability trades that offer the best risk to reward scenarios.  There will be times when we miss trades, and times when they’re not timed perfectly.  But, as those who have been with me for a while can attest to, patience pays off in the long run…

Join my Free Market Analysis & Trade Idea Newsletter Now: www.GoldAndOilGuy.com

Chris Vermeulen

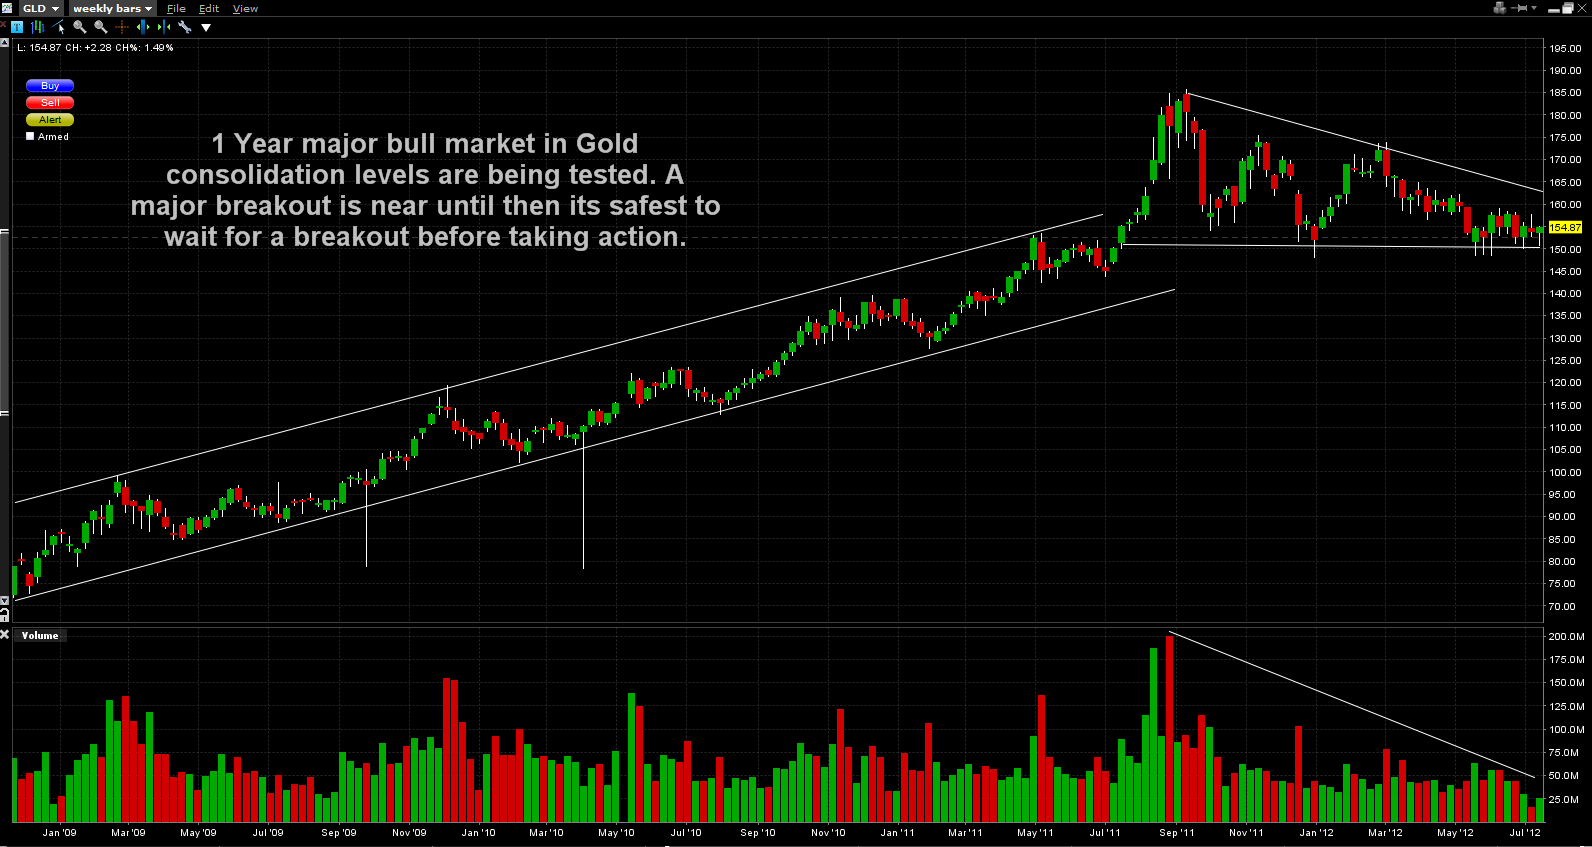
After making new highs about a year ago we have seen Silver and Gold consolidate for roughly the last twelve months.  Technically, it would typically be a bullish scenario with gold from the stand point that the last 12 months’ price action was a sideways consolidation in a bullish pennant formation.  However over the last year we have witnessed a series of lower highs and increasingly tested supports levels around $150 on GLD which raises caution.

  Click Gold Chart for Full Size

With the fed pulling any extensions on further quantitative easing in the form of QE3 or other programs, the bullish case has lately been criticised.  However I am still a firm believer that gold in most respects is a currency, and the only one that can maintain its value.  There are very serious issues looming in Europe and across the world that are far from resolution.  With few tools left in the toolbox to stimulate world economies, further easing can never be ruled out.

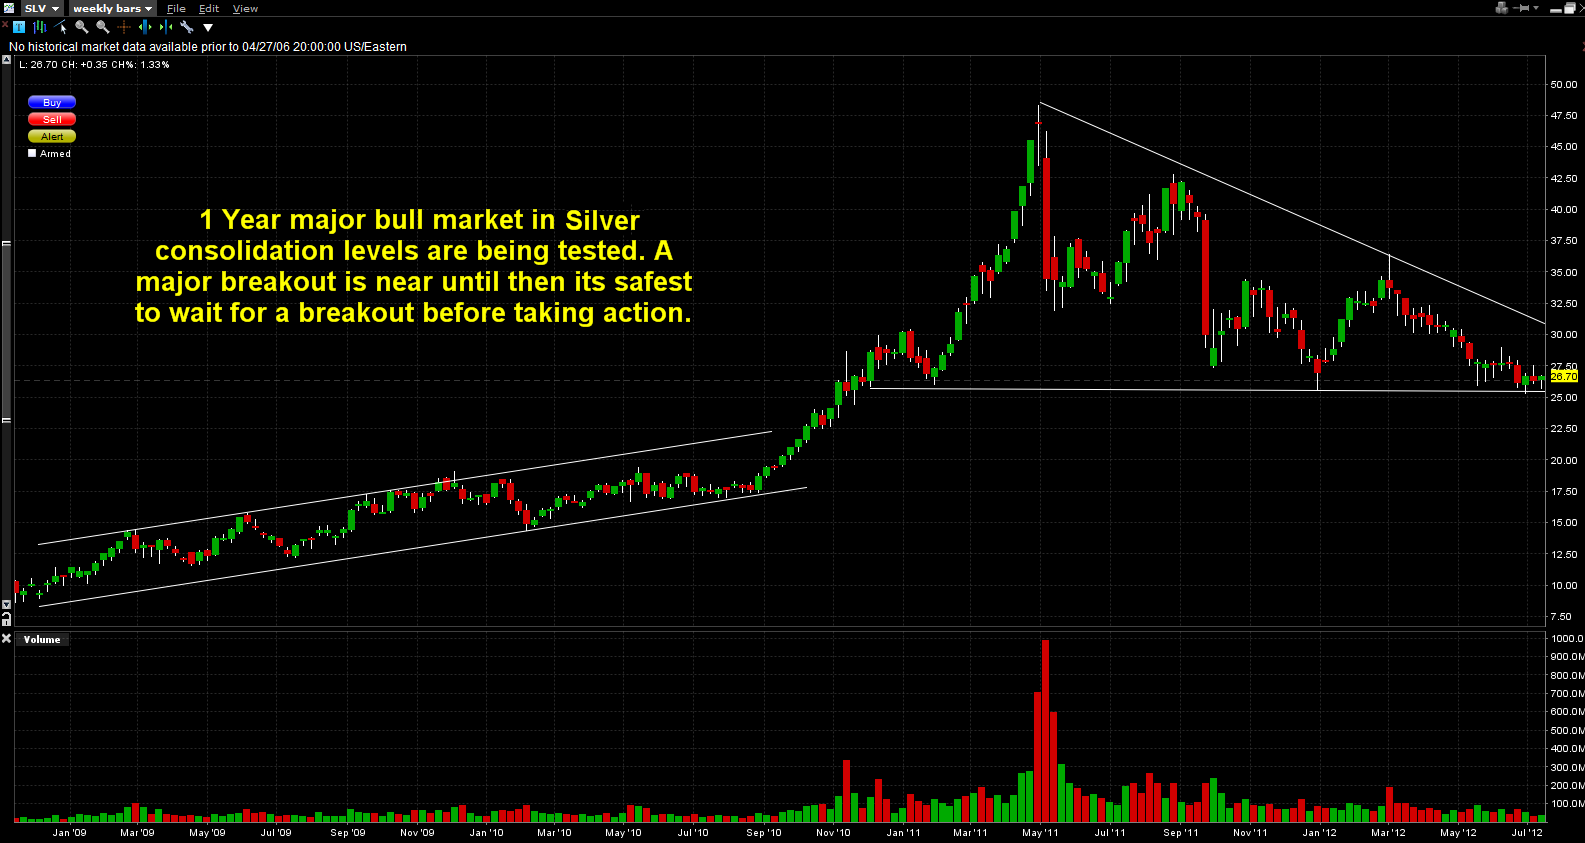
Silver, after breaking through strong resistance around $19- $20 in September 2011 went almost parabolic in spring 2011 prior to giving up most of its gains in the last year.  There seems to be significant support around $26 on SLV, however this level has been tested quite frequently over recent months and this again raises caution.  While silver owes some of its moves to its industrial application, the high correlation between the two metals is not to be ignored.

 Click Silver Chart for Full Size

I think the long-term trade will be long in both metals, but I’m waiting to see a significant breakout out of these consolidations on heavy volume to confirm a direction.  I would like to see both precious metals break out of their respective consolidations and ultimately have further confirmation in the USD.  Any major headlines over the next couple months involving Europe or quantitative easing may provide us with the trigger for the next big move.

Get My FREE gold cycles and trading analysis here: www.GoldAndOilGuy.com

Chris Vermeulen

Over the weekend I had an interesting conversation with a local trader. We typically meet a few times a year to share our market outlooks, new trading tools and techniques, and usually finish our session off in a debate about the US market manipulation and how to trade around it.

Talking about market manipulation always opens up a can of worms and sparks some interesting theories… And while everyone has their own views and opinion on this subject I thought I would briefly share the main points I pulled from our conversation.

I did talk about the dollar index last week, but the recent price action unfolding today is important so I’m going to recap on it again.


My Weekend Conversation Key Thoughts:

Point form thoughts supporting Lower Equity prices and a Higher Dollar:

–          Dollar index looks ready for a major rally (high dollar means lower stocks)

–          SP500 may have just formed a double top

–          SP500 closed strongly below the 20 day moving average

–          First week of May for the past two years have been intermediate market tops

Points supporting Higher Equity prices and a Lower Dollar:

–          Countries around the globe are trying to keep their currency value low including the United States.

–          Presidential cycle strongly favors higher stocks prices which means the dollar should not rally until Nov.

What do all these points mean? Let’s take a look at the dollar charts below…


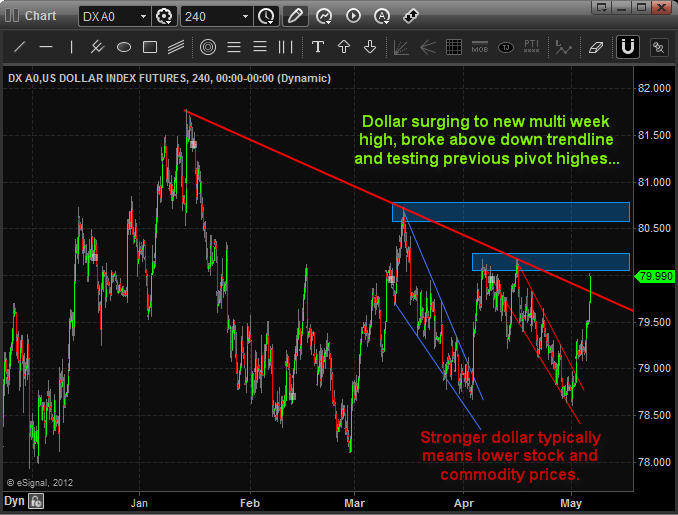
4 Hour Dollar Index Chart:

This chart time frame allows us to see all intraday price action while being able to zoom out several months for patterns along with key support and resistance levels.

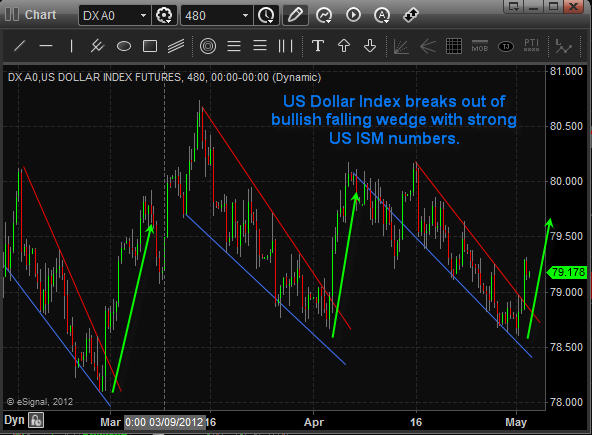
As you can see over the past few months the dollar has been consolidating sideways. Within this consolidation it has formed two bullish falling wedges with the most recent one breakout last week right on queue.

Using this 24 hour futures dollar index chart we can see where things are trading through the weekend. On Friday the dollar index closed around the 79.50 level. As you can see the dollar has surged Sunday night by more than half a penny breaking through its down trend line.

The next few weeks will continue to be exciting ones as strong moves in the dollar will create wild movements in stocks and commodities.


Long Term Weekly Dollar Index Chart:

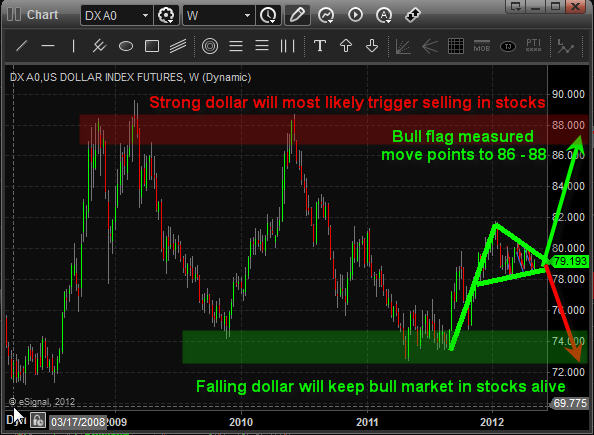
If you zoom WAY OUT using the weekly chart this shows you the two major areas where the dollar index is likely to reach come November. Also with these levels are my SP500 price points which are simply numbers I pulled from the charts using basic analysis. I say this because I’m not into long term forecasting but rather shorter term price movements. A lot can change between now and then.

So, if the dollar index rallies to the 86 – 88 level then I would expect the SP500 to be trading back down at the 1000 level. If this takes place, the Fed will likely issue QE3 to jam the dollar back down and boost equities.

The flip side of the coin is that the dollar rolls over here and gets pulled down. This will boost stock prices in favor for the president’s election. After that the dollar would likely rally which in turn would put a major top in the stock market, kick starting a bear market.


The big question…

Do you short the market in anticipation of rising dollar and falling stock prices? OR do you buck the trend and stick with the theory of a lower dollar value and presidential cycle?

The charts above clearly show how we are entering a major tipping point for the market and the next couple months are likely going to provide some big price swings for stocks, commodities and currencies.

If you want to get my thoughts and market ideas each morning before the opening bell be sure to join my video newsletter www.TheGoldAndOilGuy.com

Chris Vermeulen

Investors and traders just can’t seem to catch a break when it comes to economic news. For example Tuesday in the United States we saw strong ISM manufacturing numbers which surprised the market. The numbers were way above expectations and it triggered a feeding frenzy in US based investments like stocks and the green back.

The following session Italy reported terrible PMI and unemployment rate numbers which took most of the wind out the European and US stocks. One day the data is great, next day it’s bad…

The strong numbers in the US have everyone including myself thinking that this week’s jobless claims (unemployment rate) will be down. If this is the case then we will see stocks jump along with the dollar, much like what we saw trader do last Tuesday which is what Jim Cramer says best – BUY BUY BUY.

Normally we do not see the dollar index rally along with stocks but if EU continues to show signs of weakness then it is very likely the dollar and equities inverse relationship could decouple. Reason being investors around the globe will focus their money on the more stable US investments like the dollar and US stocks.

You can learn how to trade economic news with my free Economic Indicator Trading Tool: http://www.thetechnicaltraders.com/economic-indicators.pdf    


The Dollar is Trading at a Major Tipping Point – Weekly Chart

The dollar index is something that I watch very closely on a daily basis. Focusing on the weekly and 8 hour charts I look for support and resistance levels along with price patterns.

As you can see from the weekly dollar chart below, a large bull flag has formed. This pattern typically means higher prices and in this case the price target is between the 86 and 88 level.


There are few wild cards to toss into the game on what will unfold next:

  1. Currency manipulation seems to be strong and if the US wants a low dollar value then it’s likely it will stay low. This bodes well for stocks and commodities.
  2. Depending on what happens and how things unfold in Euro-land the dollar/stock relationship could decouple meaning they could start to rise together. If we get neutral economic data out of the EU and positive data out of the US it will likely boost the value of stocks and the dollar. But strong negative data out of the EU will more than likely just sent the dollar higher and spooking investors and triggering a selloff in stock prices.

Dollar Index Investing


Dollar Index 4 Hour Chart

I find the dollar index to be a great trading tool in helping me time short term reversals in the equities market.

Taking a look at the 8 hour chart below you can see recurring bullish falling wedge patterns. The most recent brake out was this week and I anticipate the 79.50+ levels to be reached in the near term. If the dollar does continue to move higher then I expect sideways to lower stock prices for a couple more sessions.

That being said, the mixed economic data between the US and EU is going to cause this scenario to be unpredictable. Depending on the jobless claims this week stocks could actually rally while the dollar moves higher. Unfortunately, this week’s mixed data does not provide any trading opportunities that I feel comfortable making.

Dollar Index Trading


Mid-Week Market Conclusion:

In short, I feel a higher dollar is likely to happen. As for stock prices, well they are more of a wild card at this time but my analysis slightly favors higher prices.

To quickly touch on precious metals, they are likely to be under pressure for a few sessions simply because of the rising dollar.

I hope my analysis helps paint a picture of what to expect in the coming days.

Happy Trading,
Chris Vermeulen
www.GoldAndOilGuy.com – ETF Trading Analysis & Alerts

Hey Trader’s!

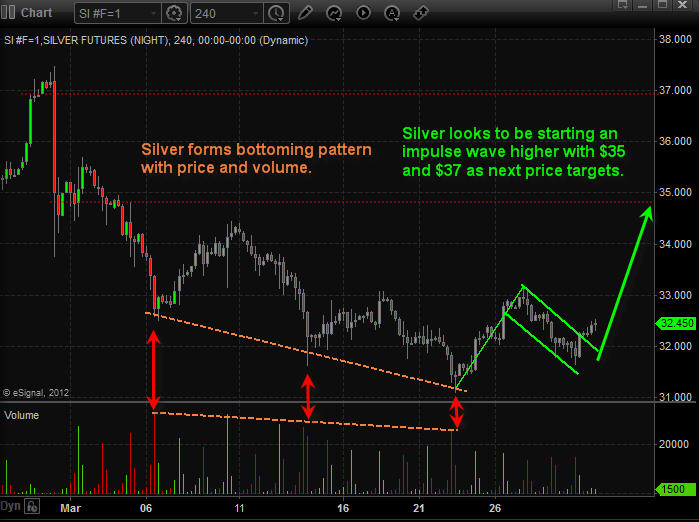
The next few trading sessions should be interesting with precious metals on the verge of a rally which should get the attention of traders and investors once again. If we can get investors to start looking at gold and silver again instead of high dividend paying stocks we will see gold hit $1800 an silver $37.

The SP500 has been pulling back and looks about ready to bounce going into the afternoon.

I recorded my morning analysis explaining what to expect in the market this week and the key support and resistance levels.

Watch Video Analysis: http://www.thetechnicaltraders.com/ETF-trading-videos/

Chris Vermeulen

The past couple months investors have been focusing on the equities market. And rightly so with stocks running higher and higher. Unfortunately most money managers and hedge funds are under performing or negative for the first quarter simply because of the way prices have advanced. New money has not been able to get involved unless some serious trading rules have been bent/broken (buying into an overbought market and chasing prices higher). This type of market is when aggressive/novice traders make a killing cause they cannot do anything wrong, but 9 times out of 10 that money is given back once the market starts trading sideways or reverses.

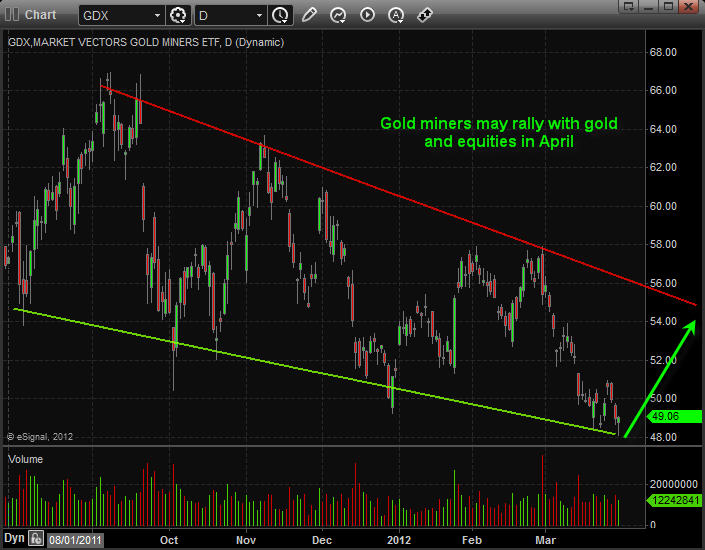
While everyone is currently focusing on stocks, its important to research areas of the market which are out of favor. The sector I like at the moment is precious metals. Gold and silver have been under pressure for several months falling out of the spot light which they once held for so long. After reviewing the charts it looks as though gold, silver and gold miner stocks are set to move higher for a few weeks or longer.

Below are the charts of gold and silver charts. Each candle stick is 4 hours allowing us to look back 1-2 months while still being able to see all the intraday price action (pivot highs, pivot lows, volume spikes and price patterns).

The 4 hour chart is one time frame most traders overlook but from my experience I find it to be the best one for spotting day trades, momentum trades and swing trades which pack a powerful and quick punch.

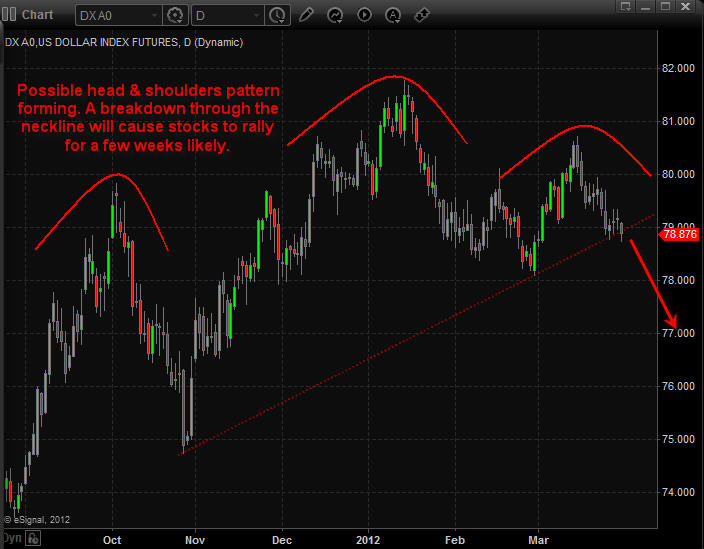
As you can see below with the annotated charts gold, silver and gold miner stocks are setting up for higher prices over the next 2-3 weeks. That being said we may see a couple days of weakness first before they start moving up again.

4 Hour Momentum Chart of Gold:


4 Hour Momentum Chart of Silver:


Daily Chart of Gold Miner Stocks:

Gold miner stocks have been under performing precious metals for over a year already. Looking at the daily chart we are starting to see signs that gold miner stocks could move up sharply at the trade down at support, oversold and with price/volume action signaling a possible bottom.


Daily Chart of US Dollar Index:

The US Dollar index has formed a possible large Head & Shoulders pattern meaning the dollar could fall sharply any day. The size of this chart pattern indicates that if the dollar breaks down below its support neckline the we should expect the dollar to fall for 2-3 weeks before finding support.
Keep in mind that a falling dollar typically means higher stock and commodity prices. If this senario plays out then we should see the market top late April which falls inline with the saying “Sell In May and Go Away”.


Precious Metals Conclusion:

Looking forward 2-3 weeks precious metals seem to be setting up for higher prices as we go into earning season and May. Overall the market is close to a top so it could be a bumpy ride as the market works on forming a top in April.

Chris Vermeulen
www.GoldAndOilGuy.com

Here is my video analysis on what to expect this week in silver, gold, oil and the SP500.

Watch Video Now: http://www.thetechnicaltraders.com/ETF-trading-videos/

Also if you have not signed up for Stocks, Futures and Options Magazine which is Free, you should do so now. They have had some great educational articles recently and if you want to master the market you must understand futures prices and how they are inter-connected. Get this Free Magazine Now
Chris Vermeulen
Founder of www.TheGoldAndOilGuy.com

Friday Technical Take Blog Post:
We are seeing stocks, oil and the dollar move up nicely today.

Stocks are pushing deep into a resistance level with very light volume… not a bullish sign. This is why we took profits yesterday with our SSO trade once we reached our dead cat bounce target of 2.5%. With it being Friday volume should only get lighter as the say progresses. I am starting to look at buying SDS as risk is low in my opinion but I’m going to let the morning play out first and re analyze in the afternoon.

Pre-Dead Cat Bounce Warning:

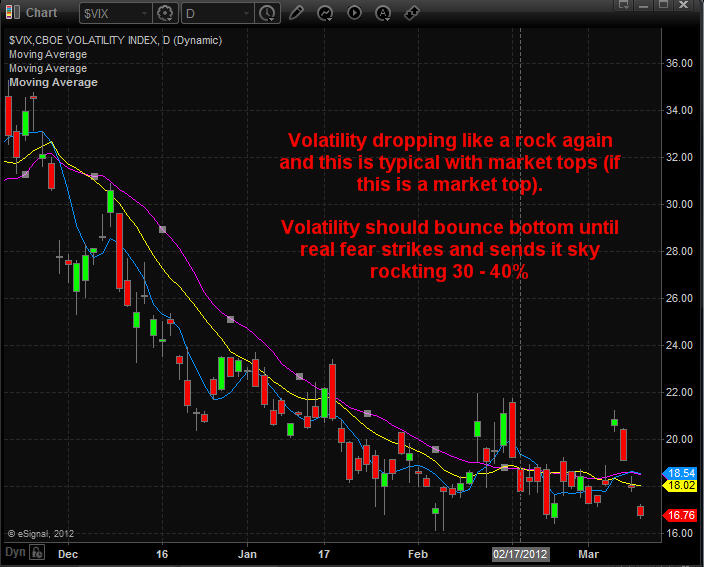
The rising market has sent the volatility index tumbling lower and this just goes to show why you must manage position and use protective stops. I know many of you were angry that I said to take partial profits and that we got stopped out yesterday on the VXX trade for a net gain of 2.9% in three days. Maybe one day emotional traders will see that you must trade with the market and adjust your trade outlook while in the trade. The market does not stop and wait for you to see the light, rather it will just steam roll you and never look back.

So with that being said I am starting to really like the VXX again for another buy signal. With any luck it could keep dropping for most of the session and we could go long this afternoon.


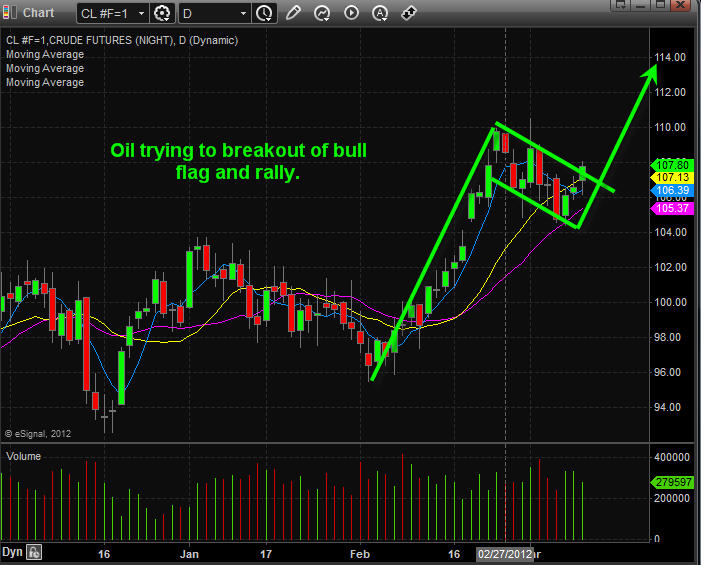
Crude oil is moving nicely in our favor today up another 2% on our 2x leveraged ETF’s. I am keeping my stop at breakeven for now as but that may change by the end of the day if we break the $109 level which is unlikely. Where to put your stops for any trade is always a tough call. It varies on the time frame, overall market condition and the size of your position so don’t think it’s just as simple s using the previous pivot high or low. That being said, those are good places for them if you have the timing correct or if the market co-operates with you…


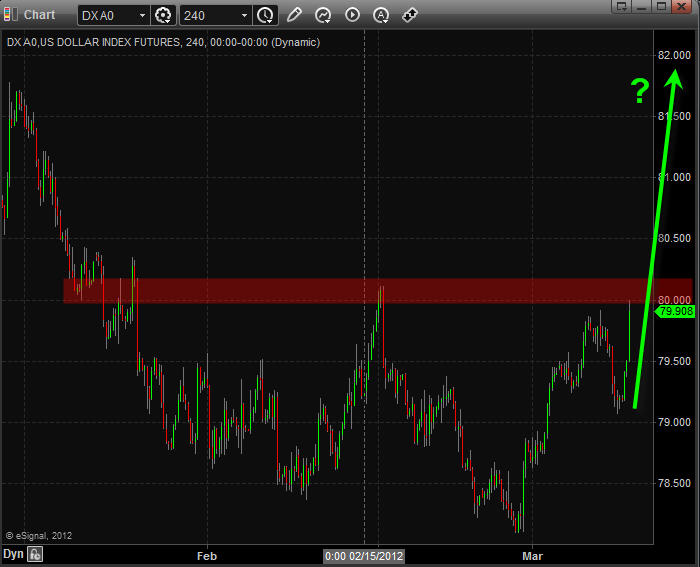
*One key thing to point out today, the dollar bounced off support which is what I warned about last night and again this morning in pre-market. The strong bounce in the dollar has not caused any selling in oil or stocks this morning. I think that is based on the strong jobs report this morning. More jobs means businesses should be getting stronger and the more gas/oil will be consumed. But if the dollar keeps on moving higher and breaks above this key resistance level in the next few trading sessions then it will likely cause selling in stocks. Oil may hold up because demand will still be there.

Let’s see how the morning and lunch unfolds and regroup.

Chris Vermeulen – Free Trade Ideas – www.GoldAndOilGuy.com