Good Morning,

I just want to touch on two things… the market and my new charting with NinjaTrader

Today’s video covers the SP500 in a little more detail along with natural gas and precious metals.

It is a big day for the financial sector (banking stocks) and if they turn around and rally expect the SP500 to post some solid gains.

Precious metals may keep selling off. Trend is still firmly down.

Natural Gas is looking lofty… I am starting to drool over a short play or inverse ETF play for that. I am keeping my eye on it.

Financials are on fire this morning, they did gap lower but have posted some big gains this morning. Anyone who got long in the past three days with me should be at breakeven or in the money now. Let’s hop this is a key pivot low and prices rally/grind higher into the holiday season/year end.

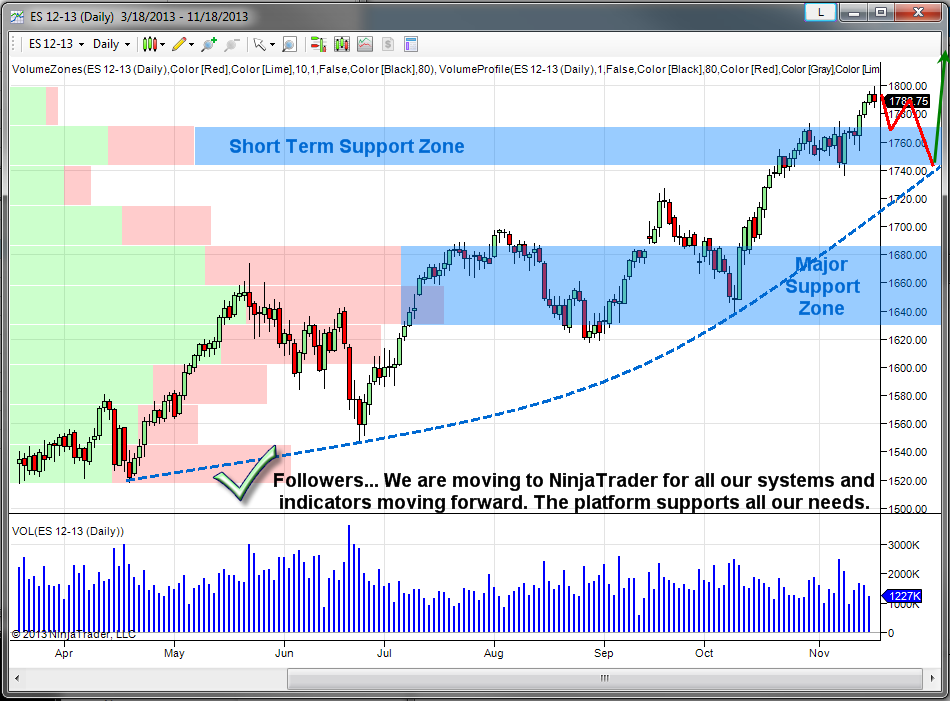
Below is a daily chart of the SP500 index using the NinjaTrader platform. Over the last few months as you likely know, we have been completing our fully automated SP500 trading system so that it will be available to our followers. Over the next month we will be phasing all our charting analysis, tools, indicators and systems to run on the NinjaTrader platform. Reason? because NinjaTrader Rocks! and supports all our custom indicators and automated trading systems much better than what we are using now.

Anyways, back to the chart below… As you can see there is potential for the SP500 to pullback several percentage points. As long as it stays above our blue support line and short term high volume zone we will remain long the market adding on dips.

NinjaTrader Platform for Automated Trading Systems & Charting

Talk soon,

Chris Vermeulen
NinjaTrader Partner


If you are a paid stockcharts.com user be sure to FOLLOW and VOTE here: https://stockcharts.com/public/1992897/

Follow My Stock & ETF Charts FREE Here: https://stockcharts.com/public/1992897/

Chris Vermeulen

How to turn your trading into a simple automated trading strategy: you know the difference among a winning and losing trade – we have all experienced both and know the excitement and the frustration associated with it.

The brutal honest truth is a tough pill to swallow. The fact that most of the time it’s not the strategy that has failed; it’s you (the trader) which is why you need a simple trading strategy drawn out on paper with detailed rules for you to follow.

In today’s report I am going to talk about how you can stop losing money and become a successful trader. We all know that before you even enter a position, you must know where you place your stop-loss order. If you don’t know where you stops are to be placed then you are trading with a major disadvantage.

Your position entry is not complete without having a stop price figured out. It blows my mind why so few investors use stop-losses. If you are guilty of not using stops, you need this information. It might be the difference between retiring on time with a big nest egg or retiring later and still just churning your account.

If you plan and place stops you are planning to win, but prepare to take losses because you will get stopped out and you will have to get back up, brush yourself off and trade another day. So with that said we need to look at the psychology around taking losses because it’s not easy to manage, and is the main reason individuals do not use stops. Being proved you were wrong flat out SUCKS!

Successful traders understand they must know where they are going to be stopped out before they enter a position. They have to know ahead of time what a wrong trade looks like so they can exit it quickly. This is a rudimentary fundamental that EVERY trader knows the answer for.

Do You Have A Trading Strategy That You Can Trade Like a Robot?

Can You Answer The Following Questions?

1. How do you know when to sit tight or cut your losses?

2. Do you have rules to tell you when to sell a losing position?

3. Do you have rules of when to move your stop to breakeven?

If you cannot answer these questions properly, you are not alone. And what it means is that you need to establish some rules for yourself. All the trading rules in the world are meaningless if you do not use them. That is why I am telling about what’s really going on with you when you refuse to manage your risk in a proactive and professional way.


Most traders refuse to take a loss for two basic reasons:

1. They cannot admit they are wrong.

For most traders, this is just too painful to admit. It’s interpreted as failure or feeds a persistent, negative self-image which none of us enjoy feeling.

Humans by nature prefer to remain in denial instead of acknowledging their losses are causing them pain. This type of trader often has to lose it all before he begins to change (or gives up trading). I know this very well. I lost it all twice when learning to trade. It was not until the second time that I hit rock bottom (financially and emotionally) that I embraced trading rules and hired a mentor to help keep me inline with my trades.

2. The loss is too big relative to their overall portfolio size so they can’t afford take the loss. 

Know this, there’s no such thing as just a paper loss. The investment (stocks, etf, options or futures contract) is worth what it’s quoted whether you realize it or not by closing the position.

Both of these examples are a form of self-delusion that millions of investors, both large and small, suffer from.

If what I am saying here is making you uncomfortable or bringing up feelings of anger or powerlessness, then that is a good sign. It means you have enough common sense and self-awareness to change what you are doing.

Example of How You Can Make Your Trading Strategy To Be More Automated:
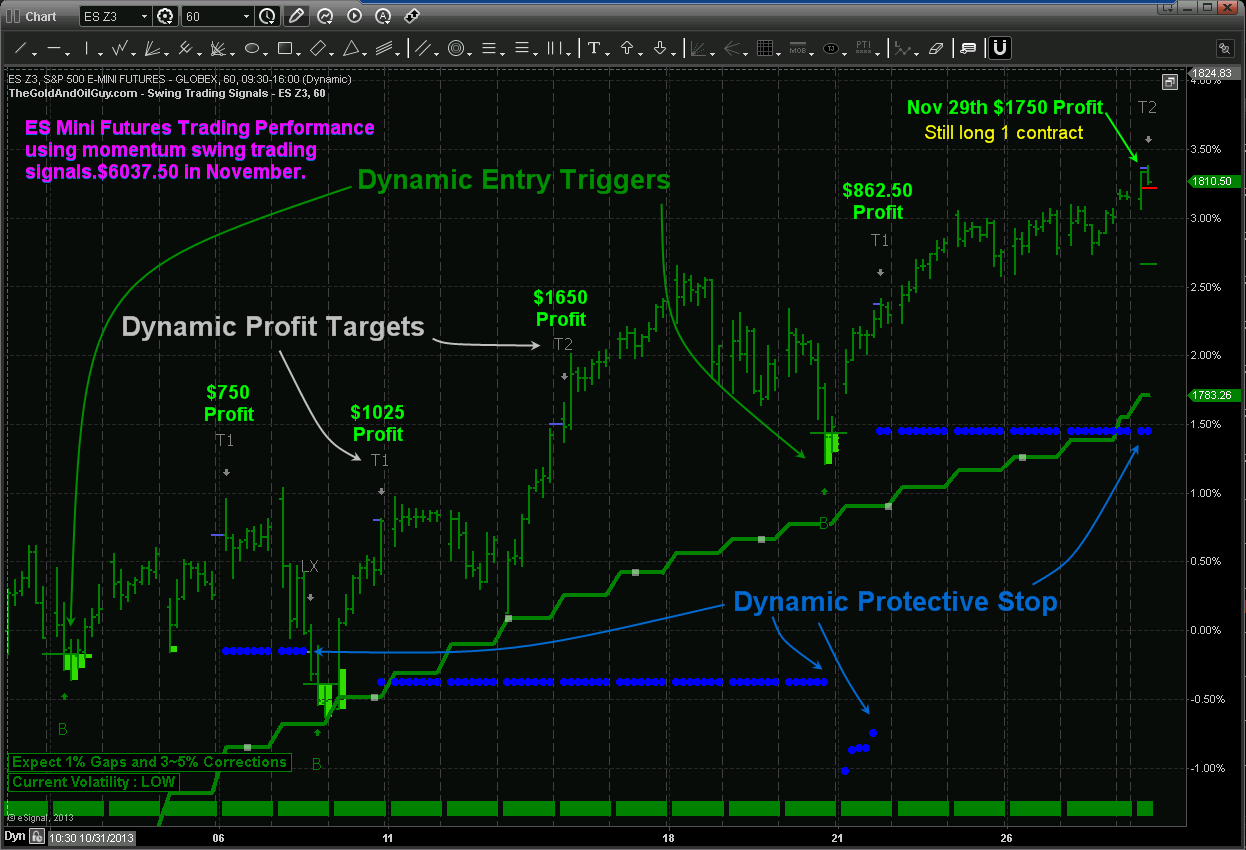
TGAOG

A successful trader uses a different strategy from that of a losing trader (you) by looking at the pain from the loss in an impersonal way. They know the loss as a sign that something went wrong with their approach, or their execution, but NOT that something is wrong with them.

Winning traders separate who they are from what they do. They learn and know, that their trading losses lie in their approach to trading the market and not a reflection of whom they are as a person. The pain they feel is quickly transmuted into motivation, which fuels their desire and determination to become a better trader through refining their trading strategies to better navigate the financial market place.

Both are learned responses and within your control. The opportunity for growth from the pain of our losses are the same. It’s what we do with this emotional pain of a loss that matters, not the loss itself.

Stick with my proven Simple Automated Trading System
Make winning a habit.


Learn About AlgoTrades & Get Free Monthly Investor Reports

See How My System Crushed The S&P 500 By 14.35%
In November With A 100% Success
Rate On Its Trades.


“Make 2014 the year to remember with some extra
trades from my new index trading system!”
 

Despite the insanity of recent market rally and overseas financial issues, my followers and I are enjoying continued success with my TheGoldAndOilGuy program. Those who trade futures could be earning a robust 82% average annual return in 2014 with the new implementation of my automated trading systems for the SP500 index.

Are you making money as the market continues to make new highs? If not, then you are likely trading from the gut and have a bias as to which way you want the market to move instead of following the major trends at play. November has been another highly profitable month for the system and subscribers pocketed more profits yet again today on our SP500 trade. 
 
AWESOME CHART/RESULTS FOR NOVEMBER: Based on $50K Account

Automated Trading Systems

TGAOG
If you’re ready to discover how to trade successfully in the shortest time possible, Then you need to get in on this special one-time deal being offered today…

LOOK AT WHAT SUBSCRIBERS SAYING!
 

Dude you are so awesome. Learning so much. Can’t thank you enough for the education and guidance you provide. -Luke Connel 


Hi Chris,
Thanks for the tip. I just sold the 10 weekly calls purchased shortly after you called this SDS play for .50 cents – they hit 1.01 yesterday while I had an appointment – today I sold for .94 – risked $500 made $440. Appreciate your updates and high profit trades! Regards, – Jim Thompson, North Caolina

Fantastic advise……..I’ve never seen anybody give the advise on time based on current market movements consistently like this.Great work Chris and please keep it up! Cheers !! – Michael I., Toronto, Canada

Hi Chirs,

I just wanted to say thanks for putting out the Morning Pre-Market Wrap Up videos.

Personally, I am so addicted to your morning videos that I feel like my morning pre-market routine is not complete until I view it. You have helped me progress in my market knowledge and trading so much I can’t imagine not having that resource each day.

If you ever putting out an educational DVD set containing all of your market knowledge, and maybe sharing how you obtained your trading skills. I for one would be very interested in getting it.

Thanks again for all you do, and the service just keeps getting better and better!
Sincerely, – Doug Givens


Hi Chris, I really admire your discipline, which in turn is helping develop mine – I am more than happy to sit on the sidelines and wait for the more probable setups, which inevitably come.
Keep up the stellar work..! Cheers, – Bry

Chris,
I like the way you keep us out of dangerous markets and prepare us for an upcoming, low risk, tradable trend. Glad you do not buckle under pressure from subscribers to make a fast but dangerous buck.
I am learning a lot about how to trade with you and appreciate the time you take to educate us. The last video about the oil futures market was eye-opening. Take care, – Lars


If you give me some time to prove myself in 2014 you should not only make money but learn to trade at the same time. 

If you think my automated trading system is just another internet marketing trading scam, I applaud your skepticism.

I come from a world where only results backed by cold, hard numbers have value, NOT empty words and hollow promises. So there’s no need for me to forgive you if you think my system which I have traded since 2006 and is automated to alert you only when the highest probability trades are available, is too good to be true.

In this day and age, you SHOULD be skeptical. But the results for my system have been explosive and it continues to outperform the SP500 index.

Basically, it’s beat the vast majority of hedge funds, pro-traders and money-managers!

Join today and get ready to make 2014 the most exciting year for trading yet.

TheGoldAndOilGuy newsletter will now incorporate some of this automated trading systems trades so we can benefit even more from the market.

 
Warning: There is a risk of loss in trading. It is the nature of commodity and securities trading that where there is the opportunity for profit, there is also the risk of loss. Securities trading involves a certain degree of risk, and may not be suitable for all investors. Derivative transactions, including futures and forex, are complex and carry the risk of substantial losses. Past performance is not necessarily indicative of future results. It is important you understand all the risks involved with trading, and you should only trade with risk capital. This information is for educational purposes only.

Precious Metals ETF Trading: It’s been a week since my last gold & silver report which I took a lot of heat because of my bearish outlook. Friday’s closing price has this sector trading precariously close to a major sell off if it’s not already started.

On a percentage bases I feel precious metals mining stocks as whole will be selling at a sharp discount in another week or three. ETF funds like the GDX, GDXJ and SIL have the most downside potential. The amount of emails I received from followers of those who have been buying more precious metals and gold stocks as price continues to fall was mind blowing.

If precious metals continue to fall on Monday and Tuesday of this week selling volume should spike as protective stops will be getting run and the individuals who are underwater with a large percentage of their portfolio in the precious metals sector could start getting margin calls and cause another washout, spike low similar to what we saw in 2008.

ETF Trading Charts:

Below are updated with Friday’s closing prices showing technical breakdowns across the board..

ETF Trading Strategies ETF Trades ETF Trade


Sweet & Sour ETF Trading Analysis:

Just to make things a little more interesting I would like to point out a couple other types of analysis.

cefSweet:  Through analysis of the CEF Central Fund of Canada Ltd. chart and evaluation it is clear precious metals are falling out of favor at an increased rate. This fund owns physical gold and silver bullion and investors are fleeing the fund so fast that it is now trading at a 7% discount of its asset value. While this may not seem good for metals I see it as a positive.

When everyone is running for one door after an extended moves has already taken place it tends to act as a contrarian indicator. Knowing that some of the largest percent moves in a trend takes place before reversing, I see this information as an early warning that a bottom will soon be put in place.


Sour: While the USD index has not been much help compared to 2012, I feel as though a rising dollar is likely to unfold for a couple weeks which may lend a hand to pulling the precious metals sector down.

ETF Trading Chart


Precious Metals ETF Trading Conclusion:

While I am starting to get bullish for a long term investment in precious metals I know that a bottom has likely not yet been made. But even if it has been, it is better to buy during a basing pattern or breakout to the upside from a basing pattern than to be underwater with a position for an extended period of time along with all the other negatives that come along with it.

I do like the idea of CEF as a long term investment when I feel the time is right. I have invested and traded it many times in the past. The key to trading the fund is to be sure you are buying it at fair value or a discount from the net asset value. You do not want to be buying it when it is trading at a 5-7% premium. The fund owns both gold and silver making it a simple diversified precious metals play.

Get More Free ETF Trading Ideas & Analysis at: www.GoldAndOilGuy.com

Chris Vermeulen


We all know quantitative easing devalues the Dollar but contrary to that general statement it looks as though we could see the dollar index continue to rise for a few more weeks.

If we analyze the chart of the Dollar ETF (UUP) it is clear that the short term momentum has turned up. The break above the down trend line and recent bounce off support bodes well for the dollar index.

The bull flag chart pattern that has formed in the past month has a measured move price target of roughly $22.30. The level also happens to be a key pivot point on the chart along with high volume resistance.

I expect the dollar to continue to work its way higher over the next week or two with $22.30 being the line in the sand where sellers will jump on price and drive it back down, or at minimum force price to consolidate for a few days.


US Dollar ETF Trading Strategy – Daily Chart Analysis

ETF Trading Strategy


Chris Vermeulen – www.GoldAndOilGuy.com – Free Trading Ideas

Silver, Gold & Miners About To Sell Off Again

A couple weeks ago I posted these same charts talking about the pending breakout (in either direction) with silver, gold and mining stocks. Fast forwarding to this week its clear this sector continues its struggle to rally. Key support levels are now being tested and if these levels fail prepare for a sharp correction with mining stocks showing the most downside potential of roughly 25% for the GDX ETF trading fund.

Let’s take a quick look at what is going on.

Gold Trading Chart:

The chart of gold shows price being wedge into the apex of the down sloping resistance trend line and the rising support trendline. Gold was trading below this level but has since bounced. But if gold closes the week below this line in the sand the price could start to fall quickly and test the $1200 per ounce within a week or two.

gold18


Silver Trading Chart:

Silver is under performing gold and trading below its support level currently. If silver does not recover by Friday’s closing bell then things could get ugly for a few weeks as investors start to exit their positions. That being said, I need to point out that silver is more of a wild card when using trend lines like this. Both gold and gold miners should be confirming this breakdown in silver if it is the real deal.

silver18


Gold Mining Stocks ETF:

The chart of gold miners I like the most. I like it because it’s pointing to lower prices, roughly 25% lower if the breakdown takes place. Gold mining stocks could be a fantastic long term investment if we see the $17.50 level reached on this GDX etf.

gdx18


Last week I talked about ETF trading strategies and the big picture on gold, silver, miners and bonds. They look to be nearing a major bottom and once they do bottom it should be a great buying opportunity for specific stocks or the entire sector.

The next few weeks are going to be crucial for precious metals and we will keep an eye on them as this bottom unfolds. Get more reports like this here: www.GoldAndOilGuy.com

Chris Vermeulen

Stock market continue its momentum from yesterday but struggled to climb. More weak comments from Fed Chair nominee Janet Yellen suggested that she would likely see QE continue for a while to help the US economy get back up on its feet.

QE liquidity has been one of the main forces driving the stock rally over the past year and today was no exception. The Dow and S&P broke out to new highs while the NASDAQ lagged a bit weighed down by Cisco’s poor earnings numbers. Gold and silver also rebounded today but with falling gold demand, it still has work to do to convince traders this is more than just a dead cat bounce.
 
Retailer Nordstrom beat expected earnings, which offset Wal-Mart’s disappointment numbers this morning. This news, along with Macy’s and JC Penney’s numbers suggest that high-end retailers are starting to outperform discounters, a sign on increasing consumer spending and an improving economy.
A Canadian magazine I read today shows that 91% of Canadian startup companies are planning to hire more staff in the 2014. That is very encouraging numbers…

ETF Trading Strategies video analysis and forecasts
SP500, gold, silver, oil, natural gas, bonds & the dollar index

This video provides insight on current trend and some new big trends likely to unfold early in 2014. With the proper ETF trading strategies we will be able to profit from both rising and falling market conditions.
Chris Vermeulen
www.GoldAndOilGuy.com – Free ETF Trading Strategies

My Stock market trend analysis is likely different from what you think is about to unfold. Keep an open mind as this is just showing you both sides of the coin from a technical stand point. Remember, the market likes to trend in the direction which causes the most investor pain.

Since the stock market bottom in 2009 equities has been rising which is great, but this train could be setting up to do the unthinkable. What do I mean? Well, let’s take a look at the two possible outcomes.

The Bear Market Trend & Investor Negative Credit

The S&P500 has been forming a large broadening formation over the last 13 years. The recent run to new highs and record amounts of money being borrowed to buy stocks on margin has me skeptical about prices continuing higher.

Take a look at the chart below which I found on the ZeroHedge website last week. This chart shows the SP500 index relative to positive and negative investor credit balances. As you can see we are starting to reach some extreme leverage again on the stock market. I do feel we are close to a strong correction or possible bear market, but we must remember that a correction may be all we get. It does not take much for this type of borrowed money to be washed clean and removed. A simple 2-6 week correction will do this and then stocks will be free to continue higher.

credit


Monthly Bearish Trend Outlook

Below you can see the simple logical move that should occur next for stocks based on the average bull market lasts four years (it has been four years) and the fact the negative credit is so high again.

Also, poor earnings continue to be released for many individual names across all sectors of the market. While corporate profits may be holding up or growing in some of the big name stocks, revenues are not. This means the big guys are simply laying off workers and cutting costs still.

Overall the stock market is entering its strongest period of the year. So things could get choppy here with strong up and down days until Jan. After that stocks could start to top out and eventually confirm a down trend. Keep in mind, major market tops are a process. They take 6-12 months to form so do not think this is a simple short trade. The market will be choppy until a confirmed down trend is in place.

MajorBear


Monthly BULLISH Trend Outlook

This scenario is the least likely one floating around market participant’s minds. It just does not seem possible with the global issues trying to be resolved. With the Federal Reserve continuing to print tens of billions of dollars each month inflating the stocks market this bullish scenario has some legs to stand on and makes for the perfect “Wall of Worry” for stocks to climb.

The US dollar is likely to continue falling in the long run, but I do not think it will collapse. Instead, it will likely grind lower and trade almost in a sideways pattern for years to come.

FoodForThought


Major Stock Market Trend Conclusion:

In summary, I remain bullish with the trend, but once price and the technical indicators confirm a down trend I will happily jump ships and take advantage of lower prices.

Remember, this is big picture stuff using Monthly and quarterly charts. So these plays will take some time to unfold and within these larger moves are many shorter term opportunities that we will be trading regardless of which direction the market is trending. As active traders and investors we will profit either way.

Get My Reports Free at: www.GoldAndOilguy.com

Chris Vermeulen


Traders and investors all around the world is having trouble climbing over the wall of worry/fear with the US stock market, and rightly so. There is a lot of things taking place and unfolding that carry a high level of uncertainty. Let’s face it, who wants to invest money into the market when it’s hard to come by (high unemployment, banks are still extremely tight with their money, companies are nowhere near wanting to hiring new staff).

The hard pill to swallow is the fact that the stock market loves to rise when uncertainty is high. It’s almost doing it just to drive investor’s nuts who sold out near market bottom or recent correction. You must overcome the urge to short the market when the economy looks so bearish in the years ahead, and continue to trade with the trend.

Short Term Investing – Weekly Volatility Index Chart

Below you can see the fear index. The chart is self-explanatory showing where it should move next. But if you are not familiar with the VIX then here is definition by investopedia:

“The first VIX, introduced by the CBOE in 1993, was a weighted measure of the implied volatility of eight S&P 100 at-the-money put and call options. Ten years later, it expanded to use options based on a broader index, the S&P 500, which allows for a more accurate view of investors’ expectations on future market volatility. VIX values greater than 30 are generally associated with a large amount of volatility as a result of investor fear or uncertainty, while values below 20 generally correspond to less stressful, even complacent, times in the markets.”

VixBottom


Weekly Investing Chart of the SP500 Index

After reviewing the VIX chart above which points to stocks nearing a level of selling pressure, then review the chart below we come to a conclusion that a minor pullback of 2-5% is likely to take place in the next week ortwo.

The divergence in the Relative Strength Index is a bearish sign for the broad market. While I feel a pullback is do and needed for the market to regroup, it is important to review the seasonality chart and know that we are entering one the strongest times of the year for stocks.

SP500Divergence


SP500 Seasonality Chart

Again, using the data from the previous two charts along with this graph clearly shows that a pullback in the stocks is likely going to be bought back up by the brave investors willing to override their fear and go with the trend. For more interesting charts check out my stock chartlists: https://stockcharts.com/public/1992897

 SP-Seasonality


The Wall Of Worry Conclusion:

In short, expect the stock market to correct in the next week or two. But once we get a correction of two percent or more, be prepared for buyers to step back in and buy things up into year end.

This WALL OF WORRY is about to GET HIGHER!

Get These Reports Delivered To
You Inbox Each Week Free:
www.GoldAndOilGuy.com

Chris Vermeulen