
It Can’t Wait Any Longer – Deja Vu!
The stock market tends to repeat itself on regular bases. Why? Because it moves mainly based on the emotions of market participants, with the exception of extreme times when the masses are moving the market with extreme fear or greed, at which point they are flooding the market with buy or sell orders to create a final pop or drop in the market just before a major market reversal.
As with everything in the universe, everything moves in cycles, periods of expansion and contraction, and there are regular wave-like patterns that happen on a regular basis no matter the time frame one is reviewing on a stock chart.
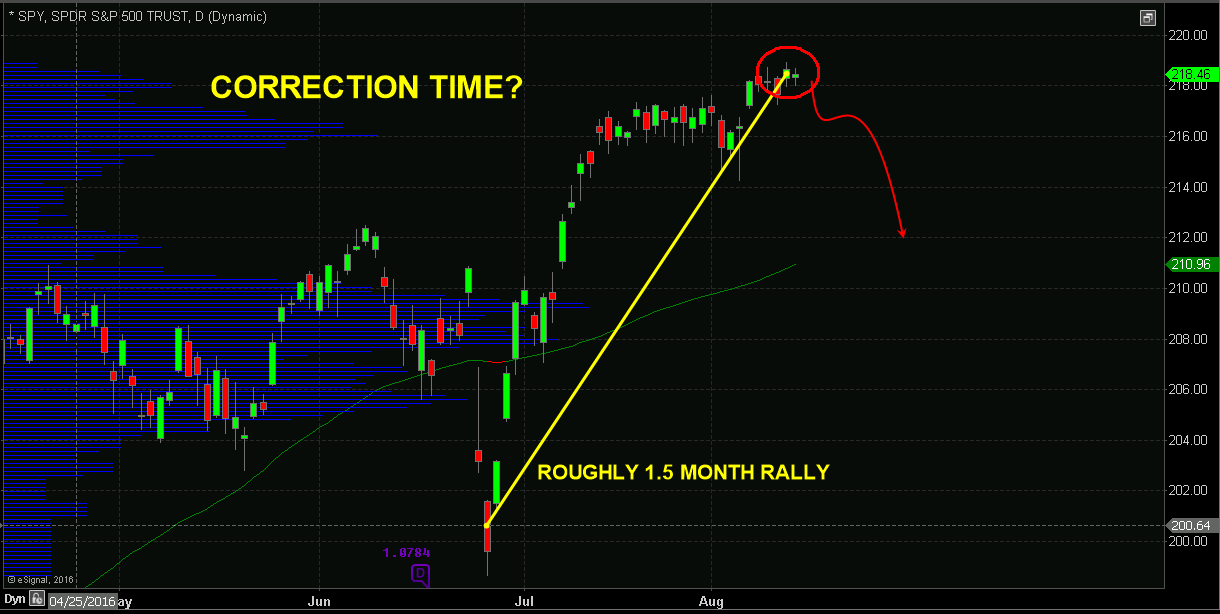
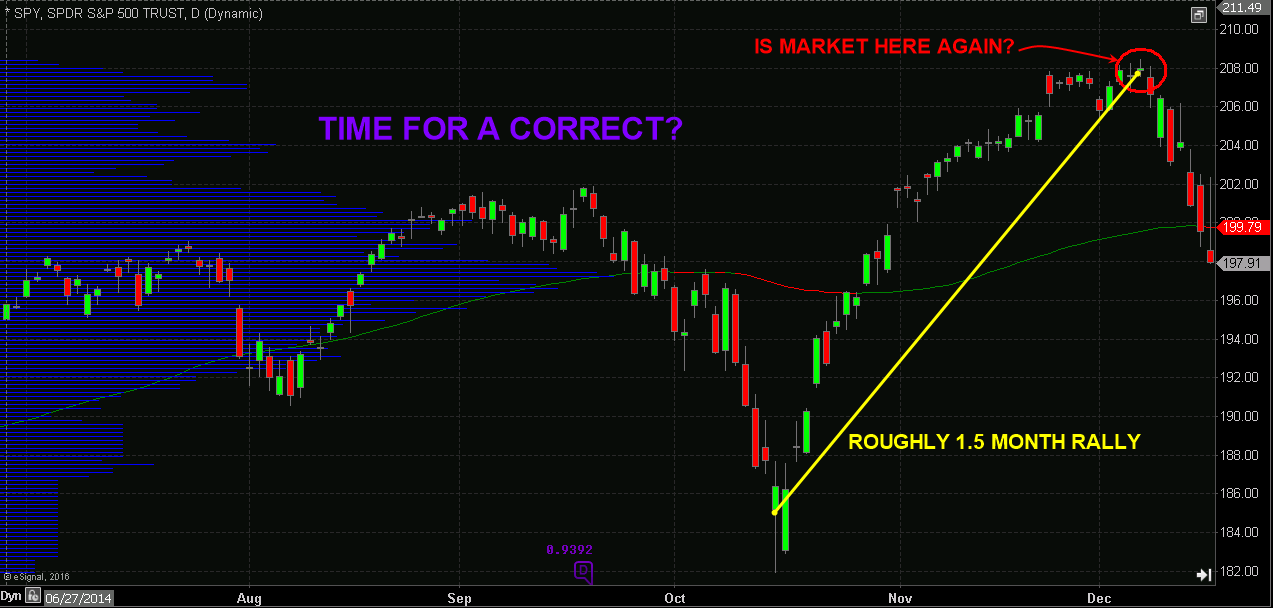
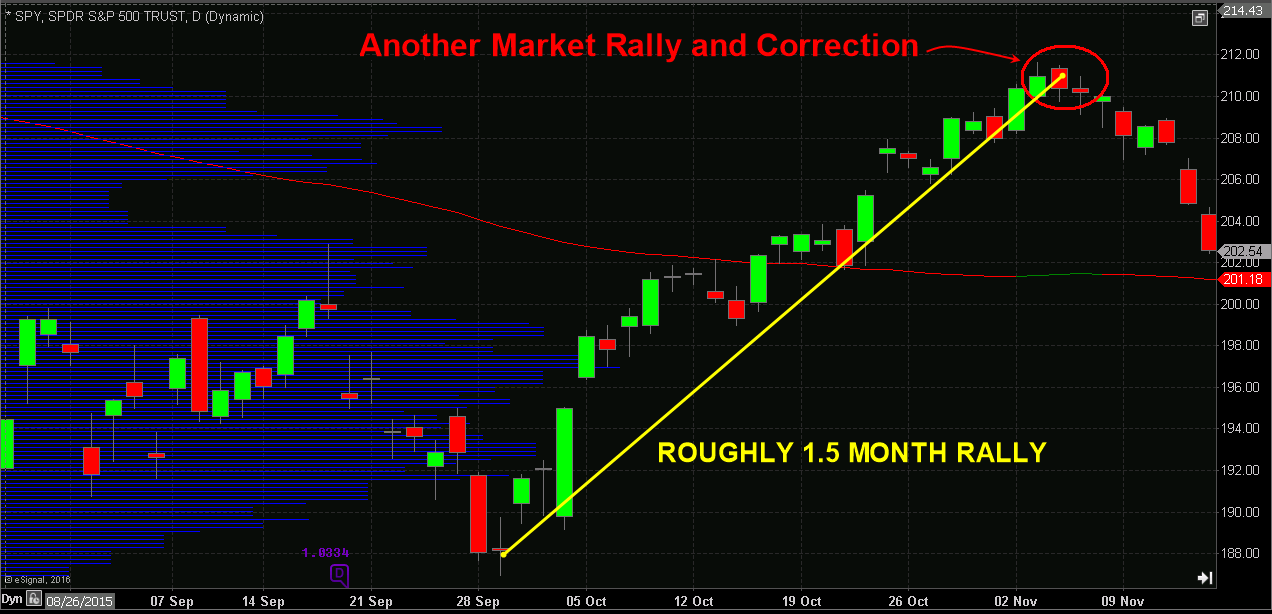
Below are three charts, each showing a similar price pattern of extreme washout lows, followed by roughly a 1.5-month rally taking investors on a roller coaster ride from fear and complete panic to greedy know-it-alls.
Current S&P 500 Daily Chart Price Action
October 2014 – S&P 500 Daily Chart Price Action
September 2015 – S&P 500 Daily Chart Price Action
Trading Conclusion:
In short, no pun intended, us large cap stocks look and feel toppy here. I feel a correction is likely to take place any day now, and the big question is “how much will the stock market pullback?
Will it be another 4-5% correction similar to the chart examples above? Or will it be something larger 8-15% correction?
Get My Stock and ETF Trade Signals Today
www.TheGoldAndOilGuy.com
Chris Vermeulen

