
The Collapsing Global Trade
The global economic trade is down 8.4 percent so far this year. Among the many economic indicators that experts use to gauge the health of the world economy, the Baltic Dry Index (BDI) usually goes unnoticed. This Index offers an indication of the global demand and supply of major stock materials that are used by manufacturers at the beginning of production. And the shocking truth is that the index has been plummeting to reach a new low not seen before.
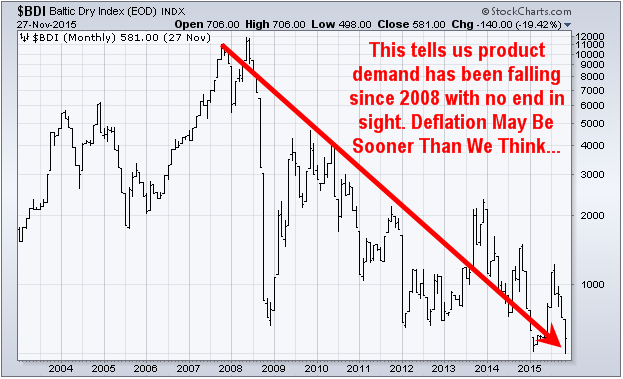
BDI is often considered a good indicator about the state of the global economy. Economic pundits consider the index as a crystal ball to provide insight about the general direction of the global economy.
An upward-trending BDI indicates strong global demand of commodities. A high BDI reading shows that producers are purchasing more raw materials, which in turn is indicative of growth in global economic activities. On the contrary, a downward trending BDI indicates slowdown in economic activities.
Just a month ago, BDI was showing a reading of 950, but now it has fallen all the way to 498. And when you look at the trade numbers of specific countries, the significance of the numbers become quite apparent.
US Economic Data Indicative of Imminent Global Meltdown
WARNING: The latest economic data released by the US Census Bureau shows that inventories increased again, wholesales declined again, and the inventory-to-sales ratio has reached the levels that were last seen just after the 2008 global meltdown.
Inventory-to-sales ratio is an important figure that shows how long the merchandise remained hung up before being sold. This ratio has been getting worse with each passing month. This recent spike to 1.31 in August this year is the same level it had reached after the economic crises began in 2008.
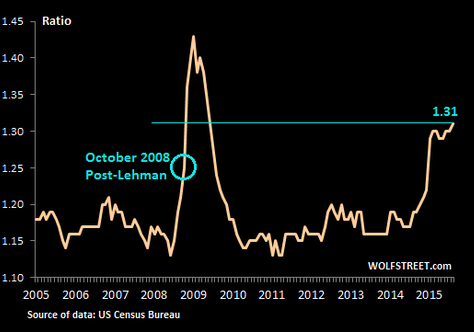
Wholesale merchants are hit the most with the increase in inventory-to-sales ratio as it has tied up their capital. When they are unable to get rid of the inventory, they resort to slash orders. This creates a chain reaction affecting every member in the supply chain that may lead to disastrous consequences. The effects can range from business cycle recession similar to one occurred in 2001 to a general global crises as seen in 2008.
This is extremely bad in my opinion as it means the world is scrambling to save money and not buy anything extra as they/we all fear something big and bad is going to happen eventually. Just imagine how slow sales will be and how high this inventory ratio will be once the next major financial crisis hits…
The dismal figures shown by Cass Freight Index (CFI) also point to an imminent collapse in global trade. The index has been used since 1990 to show monthly North American freight volumes and costs. Latest CFI figures show a declining trend of both shipment and expenditures which can be seen in the graph below.
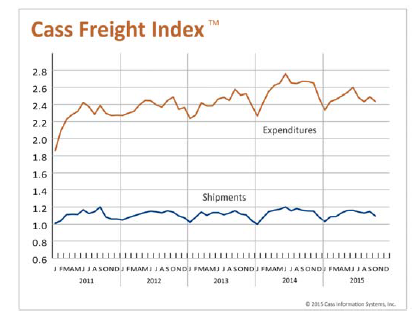
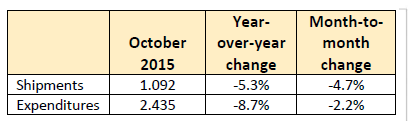 During the past four years, both freight volumes and expenditures remained low in the US. The index levels have been below even the 2013 levels for past several months. In October this year, the shipment index stood at 1.092, which represents a year-to-year decline of 5.3%. Moreover, the index level has declined 4.7% as compared to the previous month.
Expenditure index also showed a declining trend standing at 2.435 in October that represents a decline of 8.7% as compared to previous year. In many ways, the declining CFI levels hints of a general slowdown in the US economic activity that promises to have deep consequences both locally and in the global arena.
China Export and Imports are Collapsing – A Danger Sign for World Economy
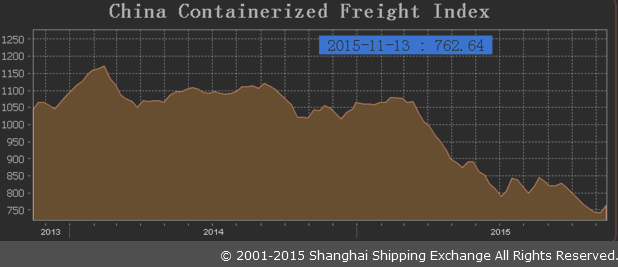
The economic picture of our biggest trade rival, China, is looking bleak as well. The country is being plumetted by two forces: declining competitiveness due to increase in wages and weak global demand. The red dragon at the moment is no longer looking as vicious as it seemed during the first half of this new millenium.
Chinese exports plummeted to $192.41 billion, declining 6.9% in October as compared to a year ago. Exports peaked in December last year when they stood at $227.5 billion and have fallen 15.4% since then. The imports also decreased closing at $130.8 billion in October, which represents an whopping 18.4% decrease compared to last year.
The dismal economic figures in both the US and China give indication of an imminent collapse in global trade with servere consequences. Economic figures in the Euro area also paint a bleak picture about the state of the world economy. Learn more about this in my book.
Should We Brace Ourselves for the Next Global Meltdown?
Maersk CEO, Nils Smedegaard Andersen, told Bloomberg that the global economic growth is declining, and that the figures are much worse as forecasted by the IMF and others. Contrary to what we may have been led to believe, the state of most of the world economy is in dire state.
If the economy was really doing well as suggested by President Barrack Obama and others, then why is the largest shipping line, Maersk, scaling back at capacity and eliminating jobs? Why is Target suddenly closing stores in the US? And most important of all, why are the largest banks in the west laying off thousands of workers?
All of this points to just one fact that the next global economic meltdown is upon us. What we are seeing are the precursors of a collapse in global trade. The declining trade and economic activities in the US, China, Europe and other many other regions that we have not touched point to the beginning of a crisis that will soon be making headlines of most newspapers around the world.
CYBER MONDAY SPECIAL – LEARN HOW TO PROFIT FROM THE COMING COLLAPSE: WWW.THEGOLDANDOILGUY.COM
Chris Vermeulen
