Posts

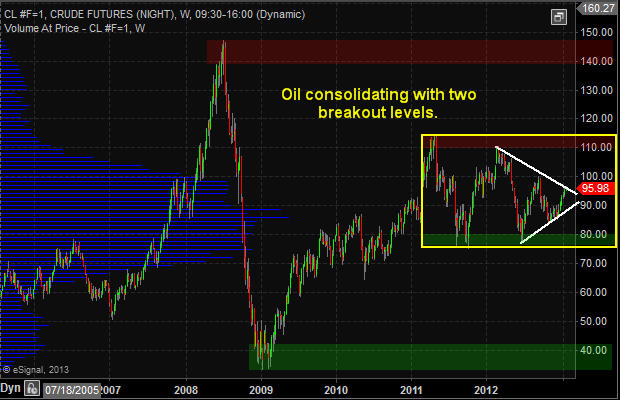
Crude oil has been trading ways for the past year between the 2011 high and low. The trading range through 2012 has been contracting with a series of lower highs and higher lows. This pennant formation because it is taking place after an uptrend is a bullish pattern with $110 and possibly even $140+ per barrel in the next 6-18 months.

If you look at the weekly investing chart of crude oil the key support and resistance levels area clearly marked. A breakout of the white pennant will trigger a move to the next support or resistance level. And judging from the positive economic numbers not only form the USA but globally the odds are increased for the $110+ price target to be reached sooner than later.

Crude Oil Price Chart – Weekly Investing

Oil Investing


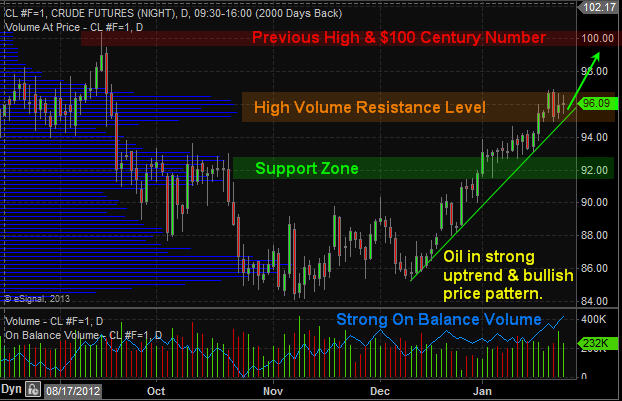
Crude Oil Price Chart – Daily short term Analysis & Target

If we zoom into the daily chart and analyze price and volume you will notice the $100 per barrel level is potentially only 2-3 days way… But keep in mind whole numbers (decade & Century Numbers) naturally act as support and resistance levels. So when the $100 century price is reached there will be a wave of sellers with fat thumbs who will slam the price back down to the $96 and possibly back down to the $92 level before oil continues higher.

Oil Trading


Utility Stocks – XLU – Weekly Investing Chart

The utility sector has done well and continues to look very bullish for 2013. This high dividend paying sector is liked by many and the price action speaks for its self… Keep in mind you can view my actual watchlist of stock and ETFs I trade in real-time with my analysis free: https://stockcharts.com/public/1992897

XLU Trading


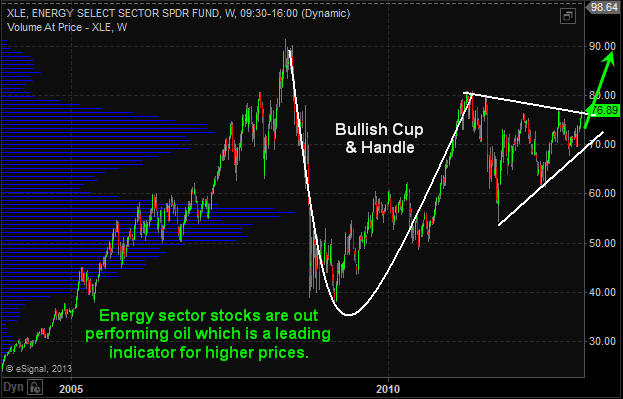
Energy Sector Weekly Investing Chart

Energy stocks which can be followed using the XLE exchange traded fund (ETF) typically leads the price of oil. Looking at energy stocks we can see that they are outperforming the price of crude oil and on the verge of breaking out of a large Cup & Handle pattern. If so then $90 is the next stop but prices may go much higher in the long run.

XLE Energy Stock Trading


Energy Stocks and Crude Oil Conclusion:

In short, crude oil is stuck in a large trading range much like gold and silver which I just wrote about here: http://www.thegoldandoilguy.com/precious-metals-miners-making-waves-and-new-trends/

Once a breakout takes place on either the white or yellow lines on the first crude oil weekly chart we should see oil, energy and utility stocks start making some big moves. Depending on the direction of the breakout (Up or Down) it must be played in that direction to generate substantial profits obviously.

Get my daily analysis, updates and trade alerts here: www.TheGoldAndOilGuy.com

Chris Vermeulen

It seems everyone is looking for a place to put their hard earned money as uncertainty around the globe continues to rise. Oil, Gold, and Silver which have been the hot investments for the past few years took it on the chin over the past month with oil falling 13%, gold dropping 15%, and silver with a whopping 30% decline. We did actually see sharply lower prices, but last week these oversold commodities had a bounce and recouped some of their losses.

It has been a month since I covered the dollar index in detail and back on August 31st I pointed to a potentially large shift in the US dollar. The charts were pointing to a sizable rally which would likely send stocks and all commodities crashing lower. Since then we have seen just that and the so called safe havens (Gold, Silver, Oil) have dropped taking most investment and retirement accounts down with them. I did talk about these so called safe havens a couple weeks back stating my point of view on them.

My Cole’s Note Summary: “I do not consider any investment vehicle a safe haven if it can drop 15% in value within 1-2 days. And I would never put a large position of my account especially a retirement account into these investments if I were over 50 yrs of age.”

So where are the big, smart, and conservative traders putting their money to work?

Let’s dig down and take a quick look at the charts…

The 20 Year Bond – Daily Chart:

US Dollar – Daily Chart:


Utility Sector (Dividend Paying Stocks) – Daily Chart:


Weekend Trading Conclusion:

In short, I feel both stocks and commodities are oversold but need more time to bottom and we may see a few more days of lower prices in the near future. I see the dollar starting to get toppy on the daily chart and once that rolls over then stocks should bottom along with gold, silver, and oil.

Once equity prices start to bounce I anticipate money to flow out of the safe haven (Bonds) and into stocks where there are much larger potential gains to be had. All this could play out in a couple days so I am keeping a very close eye on everything.

Last week we bought the inverse SP500 etf (SDS) anticipating another surge higher in the dollar which would send stocks down in value. So far we are sitting with a gain of 8.2% and the potential for another 4 – 10% if things play out as I expect. If you would like to receive my daily pre-market trading videos so you know exactly what to expect each session along with my ETF trades be sure to join my free newsletter and get my free book here: http://www.thegoldandoilguy.com/trade-money-emotions.php

Chris Vermeulen

Get these articles, reports and videos directly and instantly on your website using the Best Financial RSS Feed