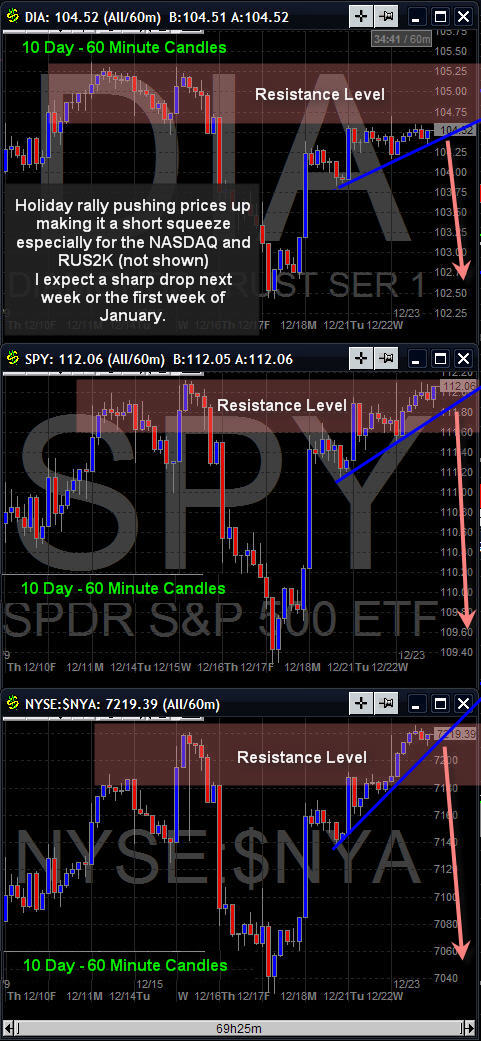
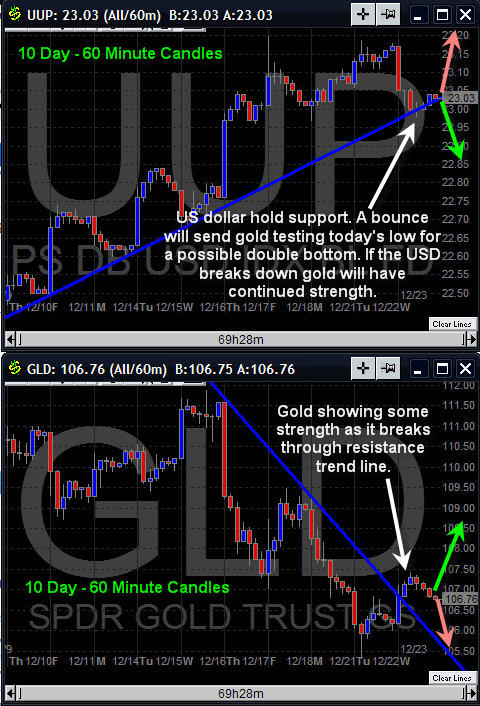
Well, here we are with only hours left before the year is over. Virtually every investment is up other than the US dollar.
Not much has changed since my last gold market trends report. But I have provided some interesting charts that show us what is possible in the coming weeks for the dollar, gold and natural gas.
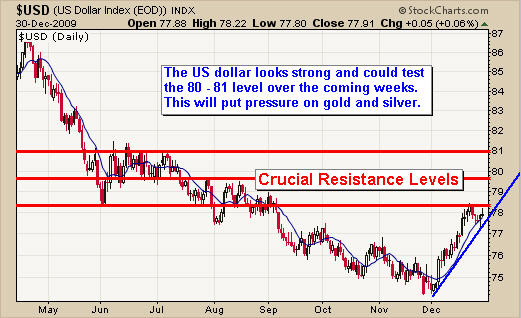
US Dollar Trend Analysis – Resistance Levels
The dollar has shown some strength in the past month. It was a no brainer trade for 2009. You were either long gold or short the dollar. The chart below shows the key resistance levels for the $USD. I have a feeling we are going to see the dollar test the 80 -81 levels before rolling over and heading south again.
If this happens then gold and silver will continue to pull back. I am actually hoping the dollar moves higher and gold drops back to test the $1000-1060 level. This would clear the way for gold and the dollar to continue with their longer term trends with increased momentum (dollar collapses, gold goes parabolic).
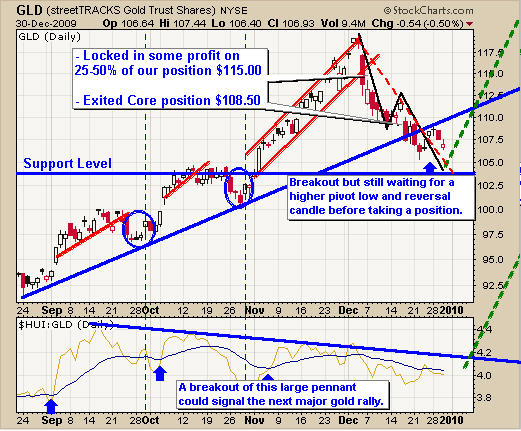
GLD Gold ETF – Daily Chart
The daily gold swing trading chart is really starting to look attractive for a buy signal. Depending on what the US dollar does in the coming days will set the tone for gold.
We could see gold start to rally starting tomorrow or it will become volatile and start to sell off sharply in the coming days. Right now we have very light volume so any moves/breakouts cannot be taken seriously or with a large position.
If the dollar starts to rally we could see the GLD ETF drop to the $97.50 – $103 level.
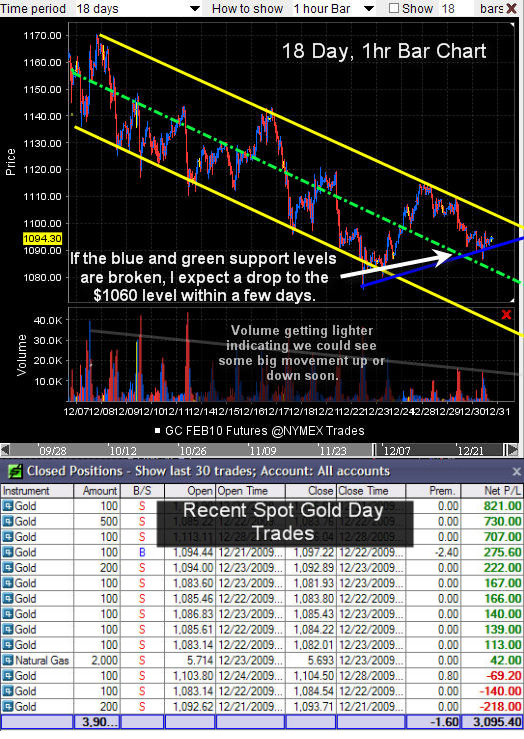
Spot Gold Trend Analysis – 18 Day, 1hr Bar Chart
Starting in 2010 I will be providing futures trading analysis and signals so I thought I would provide a chart of the spot gold trend I have been day trading over the holidays.
This may seem like I am going against my #1 trading Rule – Never Trade Against the Trend, but the trend changes depending on time frame and trading style you are using. In short, gold reversed very strong 18 days ago just as we anticipated it would. The selling momentum was so strong it made for excellent gold futures day trading setups which I took advantage of over the past 10 trading days.
The chart below is of the 100 ounce gold GC Feb 10 futures contract which I traded. The chart is shrunk down and does not show my setups, nor does the chart look very sexy, but it clearly shows the direction of the trend and the BIG SELLING VOLUME.
The table shows my recent trades and if you take a close look all of the trades I did were Short Trades. Because the momentum and trend is down on this time frame I only traded perfect short setups (profiting from gold as it loses value).
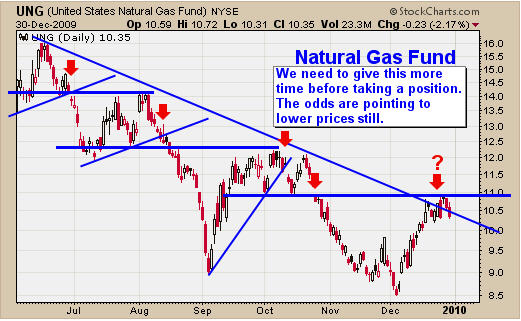
UNG Natural Gas Trading Fund
UNG appears to be trading at resistance and starting to look like its rolling over. It did move above last weeks high which voids the reversal candle we had Tuesday and Thursday, or else it would have been a short setup for us. I don’t chase a trade, that’s my #2 rule, so I am waiting for a possible bounce here, test of resistance then another reversal back down.
Commodity & ETF Year End Trends:
In short, we continue the waiting game for more setups in the coming weeks as volatility and volume creep back into the market. The dollar and gold are currently trading at pivot points and no one knows which way to play them.
Trading futures run virtually 24 hours a day and have provided some excellent trading opportunities that I will be providing in the coming weeks for traders.
Natural Gas is trading at pivot point and looking ready for another move down.
Crude oil and the board market I feel will top out in the next 2-5 days but nothing worth putting any money on at this time.
I would like to thank everyone for their kind words and support over the past 12 months. I wish you all a happy and safe New Years!
Get My Free Trading Charts:
Chris Vermeulen
www.GoldAndOilGuy.com – Gold Trend Analysis & Signals

