This week we have a major wild card (Election) happening on Tuesday. Most of you know I don’t get involved with political discussion for several reasons… one of them being that I am Canadian “an outsider” looking in.
That being said, it looks and feels as though the market has been propped up and oil has been held down from an invisible force. Lots of theories going around saying higher stock and lower/stable oil prices will give voters the warm fuzzies to keep the current leaders elected… I prefer trading the charts and not getting caught in the Wall St. hype.
Let’s take a quick look at some charts
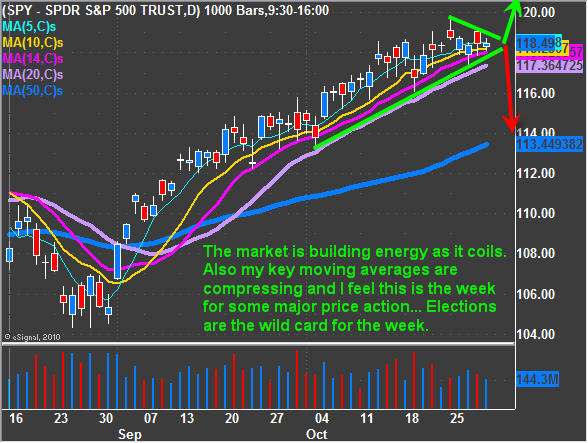
SPY – SP500 ETF Trading Vehicle
The broad market has been finding buyers as the beginning of each month and it looks as though it’s ready for another bounce. I do want to note that Tuesday or Wednesday we could see a very sharp move in the market as investors around the world digest the outcome. It is very important to keep positions small and or use protective stops incase of a flash crash or flash rally for those of you trying to pick a top.
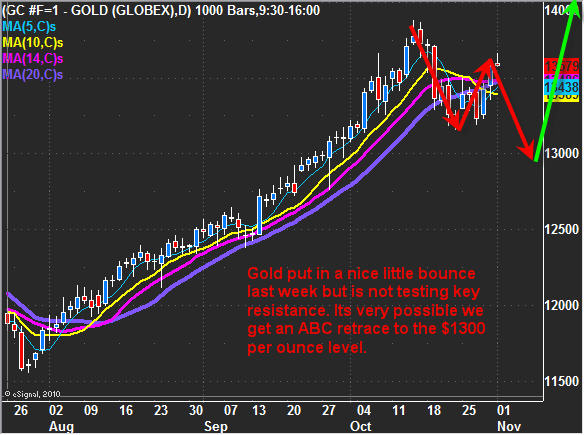
Gold Price – Futures Contract
The price of gold looks to be setting up for another wave down in my opinion. More often than not we see a sharp pullback, sideways chop then a pop above recent highs. It’s that pop above recent highs which tends to suck in long positions only to roll over and make new lows quickly after. As noted in previous reports, gold has support around $1300 area and that’s what I am looking for. Again this week’s election will trump recent price action so we really just need to sit tight until the smoke settles.
Crude Oil Futures:
Crude oil has been trading sideways for a solid month while the US dollar has been dropping at tremendous rate. Many oil traders believe the price is being manipulated to stay down until the election is finished because of the strong negative affect rising oil prices have on the economy/end user/voters.
Weekend Trading Conclusion:
In short, this is a going to be a wild week in the market. Keeping position sizes small and using protective stops is crucial during times like these. We have taken profits on both of our positions from last week and have moved our stops to breakeven for the balance just incase of a crash.
Overall, I am neutral on the market for a couple days until we see what type of blip we get on the charts.
If you would like to receive my Daily Trading Commentary, Charts and Trades be sure to join my newsletter: www.TheGoldAndOilGuy.com
Chris Vermeulen


