It has been a bumpy ride for precious metal investors over the past couple of years and it unfortunately I do not think its over just yet.
The good news is that the bottom has likely been put in for gold, silver and gold miners BUT the recent rally in these metals and miner looks to be coming to an end. While we could see another pop in price over the next week or so the price, volume and momentum see to be stalling out.
What does this mean? It means we should expect short term weakness and lower prices over the next month or two.
Below are three charts I posted several months ago on my free stockcharts list. These forecast were based off simple technical analysis using cycles, Fibonacci and price patterns. As you can see we are not trading at my key pivot level which I expect selling pressure to start to increase and eventually overpower the buyers sending the prices lower.
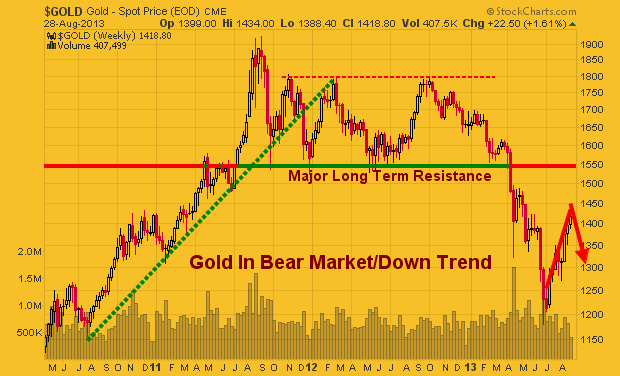
Gold Trading Weekly Chart:
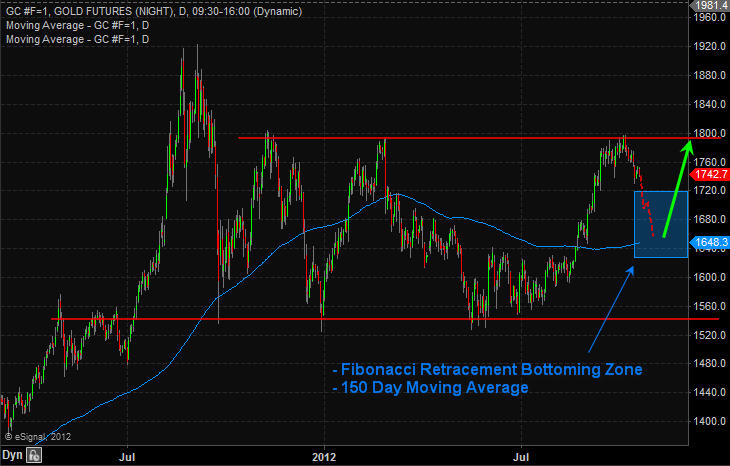
Here you can see that gold is technically in a bear market when viewing it on the weekly chart. If you were to pull up a daily chart you would likely notice how the price of gold is trading at a key resistance level on the chart and has reached its full flag measured move.
What does this mean? It means the odds are pointing to lower prices for gold in the next few weeks. Keep in mind though I do feel as though a major bottom has been put in place for the precious metals sector. So buyers are likely to step back in around the $1300 area.
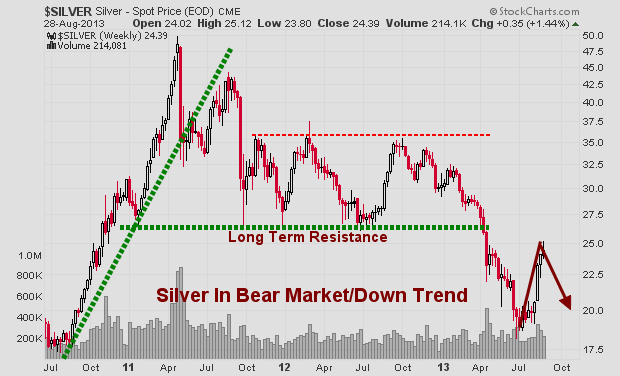
Silver Trading Weekly Chart:
Silver has a little bit different looking chart but the same analysis applies here as it did in gold.
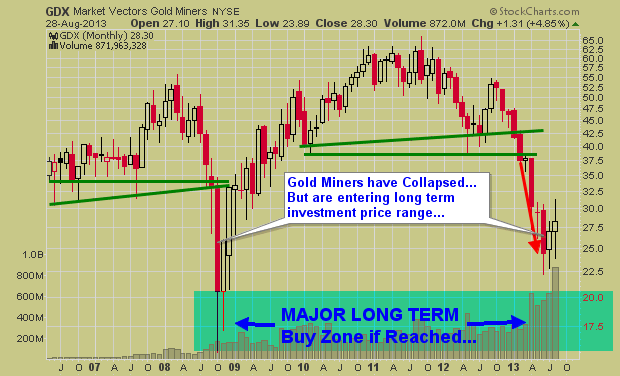
Gold Miners Trading Monthly Chart:
Gold miners may have bottomed on this monthly investing timeframe chart but the daily chart which you will see next clearly shows short term weakness has started.
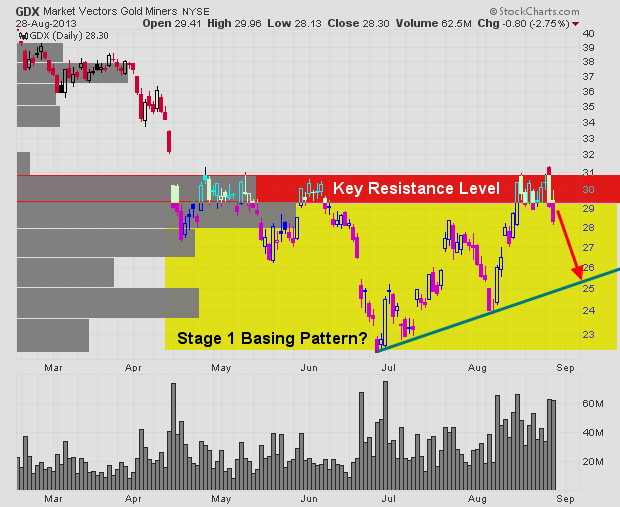
Gold Miners Trading Daily Chart:
This daily chart really shows my thinking for miners and the overall precious metals sector as a whole. The recent weakness in gold miners to the down side point to distribution of shares. This is very negative for the price of physical gold and silver as gold mining stocks tend to lead physical metals.
The yellow box shows a possible major stage 1 basing pattern forming. If this is the case, then we will have a great opportunity in the coming months when the precious metals down trend completes a reversal and start heading higher.
How to Trade Precious Metals & Gold Miners Conclusion:
In short, I think that staying in cash or shorting metals is the play for the next couple weeks. After that anything can happen and until price breaks down or finally completes the basing pattern and confirms a market bottom I would be very cautious trading here.
In the last week members of my trading newsletter took profits on our short SP500 trade and we closed a long trade in natural gas for a quick 6.5% gain. Join our community of traders and have your money on the right side of the market!
http://www.thegoldandoilguy.com/wp-content/uploads/2014/11/tgaoglogo.png00adminhttp://www.thegoldandoilguy.com/wp-content/uploads/2014/11/tgaoglogo.pngadmin2013-05-03 08:46:222013-05-03 08:46:22Best Video Analysis for Today and May Trading
Despite the decline this past week, gold seems to be regaining favor with global investors, as just a week earlier it had been flirting with the $1,800 an ounce mark. Quite a change from the sentiment in early summer when some investors were questioning whether the yellow metal’s decade-long bull run was coming to a close.
The rebound in investor sentiment toward gold, of course, coincided with the launching of open-ended QE3 (or QE infinity) by the Federal Reserve. Since then gold has “barely paused for breath. It has, as discussed previously, touched all-time highs in terms of euros or Swiss francs.
QE3 certainly seemed to worry some investors. These people moving into gold are concerned about things such as competitive devaluations and the debasement of currencies in an attempt to pay back enormous debt loads with a cheaper currency. This road – currency debasement – eventually leads to inflation most believe.
So it is really is not surprising that, according to UBS, investors in exchange traded funds raised their holdings by 158 tons since the beginning of August to a record 2,681 tons of bullion recently.
Many of the world’s best investors are in agreement with the average person putting his or her money into gold. The list of names is impressive: George Soros, John Paulson, Ray Dalio and Bill Gross.
Ray Dalio, founder and chief investment officer of Bridgewater Associates – the world’s largest macro hedge fund, told CNBC viewers recently: “Gold should be part of everybody’s portfolio. We have a situation now when you have too much debt. Too much debt leads to the printing of money to make it easier to service. All of those things mean that some portion [of a portfolio] should be in gold.”
Dalio’s conclusion? “Only gold and real assets would survive.”
All of this positive macro news about gold has managed to influence the gold chart too. According to asset manager Blackrock, “the gold chart has turned decidedly bullish.” Blackrock was speaking about the so-called “golden cross”. That occurs when the 50-day moving average moves above the 200-day moving average.
Blackrock noted that the last time gold’s chart looked so good was shortly after the Federal Reserve announced QE1, the first round of money printing. It said that if gold does the same thing it did back then, the price of the precious metal will hit $2,400 an ounce by next summer. Of course, macro factors like Chinese and Indian demand for physical gold will play a major role in whether we reach those lofty levels.
While I am bullish on gold longer term the chart patterns, volume and sentiment for both gold and silver are overwhelmingly bearish looking for the next couple weeks. I sharp pullback is likely to unfold before they take another run at resistance and breakout to new highs.
Chris Vermeulen
http://www.thegoldandoilguy.com/wp-content/uploads/2014/11/tgaoglogo.png00adminhttp://www.thegoldandoilguy.com/wp-content/uploads/2014/11/tgaoglogo.pngadmin2012-10-18 08:59:392014-03-04 13:32:45Gold Is Not Back In Favor Yet…
Bill Gross is one of the most recognizable names in the investment world. He is the founder and co-chief investment officer at bond fund giant PIMCO. His long-term track record regarding bonds is among the best and he still runs the world’s biggest bond fund, the PIMCO Total Return Fund.
Gross is also known for speaking quite bluntly about the United States’ growing debt problem. His latest monthly market commentary came with a warning for the U.S. and investors alike. Gross stated that a number of recent studies have concluded that “The U.S. balance sheet, its deficit and its ‘fiscal gap’ is in flames and that its fire department is apparently asleep at the station house.”
The recent studies Gross pointed to came from the Congressional Budget Office, the International Monetary Fund and the Bank of International Settlements. The studies calculated that the United States needs to cut spending or raise taxes by 11% of GDP over the next 5-10 years. This translates to $1.6 trillion per year. That compares to the country’s 8% of GDP deficit in 2011. Those numbers put the U.S. in the ‘ring of fire’ with other countries with similar fiscal gap sizes. These countries include Greece, Spain, Japan, France and the U.K.
Gross warned that the U.S. debt problems have put the country in this “ring of fire” that will burn most investors. The only investors who will not get “burned”? He says the lucky few will be those that are protected by gold and other real assets, protected from a severe U.S. dollar depreciation caused by the Federal Reserve’s money printing.
In a white paper titled “GOLD – The Simple Facts” posted on PIMCO’s website, PIMCO analysts Nicholas J. Johnson and Mihir P. Worah also said some interesting things. Here is an excerpt, “Our bottom line: given current valuations and central bank policies, we see gold as a compelling inflation hedge and store of value that is potentially superior to fiat currencies.” They pointed out the positive supply/demand characteristics of gold as a big plus in their scenario. The PIMCO analysts went on to say, “We believe investors should consider allocating gold and other precious metals to a diversified investment portfolio.”
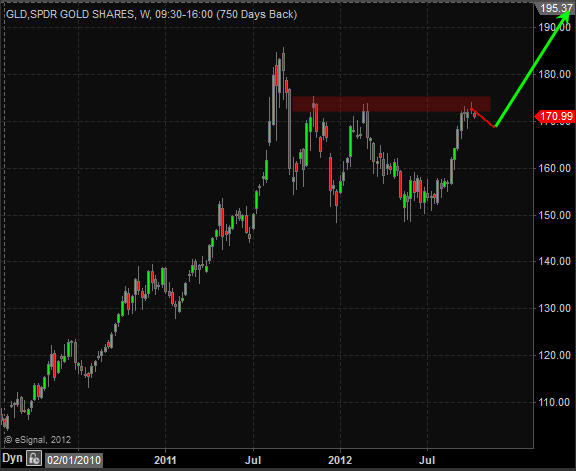
That is quite a statement coming from a “mainstream” investment firm. Wall Street’s usual reaction to gold is that it is a barbarous relic whose only use is in jewelry and that no sane investor should put any money into it, even paper gold instruments such as gold ETFs like the SPDR Gold Shares (NYSE: GLD) and others.
After Bill Gross’ bullish words, gold prices were trading a 7-month high on Thursday before falling Friday to finish the week at about $1776.00 an ounce.
Chris Vermeulen
http://www.thegoldandoilguy.com/wp-content/uploads/2014/11/tgaoglogo.png00adminhttp://www.thegoldandoilguy.com/wp-content/uploads/2014/11/tgaoglogo.pngadmin2012-10-10 09:30:362014-03-04 14:06:13Bill Gross Says Gold Will Thrive in ‘Ring of Fire’
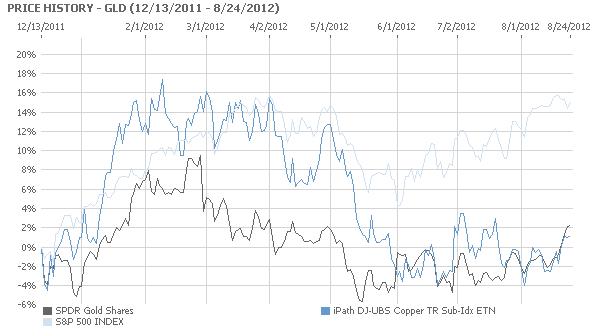
There should be an inverse relationship between gold (NYSEARCA: GLD) and copper (NYSEARCA: JJC).
Most of gold is used for investment purposes. As a result, it rises when there is economic weakness and investors lose confidence in the fiat currency of a country. Most of copper is used for industrial purposes. Therefore, the price of The Red Metal should increase when economies are booming, as there is a greater demand for it from the factories operating at full throttle and for the buildings being constructed.
Gold Bullion Prices
As the chart below evinces, the inverse relationship between the exchange traded for gold, SPDR Gold Shares, and the exchange traded fund for copper, iPath Copper, has broken down due to traders positioning themselves for the introduction of Quantitative Easing 3 when Federal Reserve Chairman Ben Bernanke speaks at Jackson Hole this Friday.
Continuing economic weakness in the United States will almost certainly lead the Federal Reserve to act in way that is more powerful than Operation Twist, the selling of short term securities to buy those with a longer term. Based on the most recent data, economic growth in the United States is falling as the unemployment rate is rising. A recent statement by the Federal Reserve was unusually clear in calling for greater action.
Both the JJC and the GLD have risen together as traders expect more economic stimulus from the United States Government. This will weaken the US Dollar and raise the price of commodities, as happened with Quantitative Easing 2. During the period of Quantitative Easing 2, from November 2010 to June 11, the US Dollar fell in value and the GLD and the JJC soared, along with other commodity prices, particularly oil. This pattern is being repeated as traders are preparing for the initiation of Quantitative Easing 3 when Bernanke speaks Friday, or at the next Federal Open Market Committee meeting.
Gold Spot Price Chart
TheTechnicalTraders Analysis & Trade Idea Delivered To Your INBOX!
http://www.thegoldandoilguy.com/wp-content/uploads/2014/11/tgaoglogo.png00adminhttp://www.thegoldandoilguy.com/wp-content/uploads/2014/11/tgaoglogo.pngadmin2012-08-27 08:23:092014-03-06 07:44:53Gold and Copper Rising Due to QE3 Hopes
“You can’t understand what lays ahead if you don’t understand the past”
~ Satellite, Rise Against ~
Members of my service as well as long time readers know that I do a lot of analysis based on the past. I am constantly looking at long-term historical price charts and data. As a trader, I am always looking for an edge.
Obviously the keys to long-term success involve proper position sizing, risk management mechanisms, and ultimately leveraging probability. Professional traders are masters of these tenets. These characteristics are what separate successful traders from average traders over the long haul.
Sometimes through my rigorous analysis I come across price charts and oscillators that help put together a picture that helps shape my view of the marketplace. The past few months have been some of the most difficult market conditions that I have seen in some time.
The “wall of worries” permeates the financial landscape as risk at present seems unprecedented. The list of macroeconomic concerns ranges from the European sovereign debt crisis to escalation of military action in the Middle East.
I could probably write an entire article about the various risks that plague global financial markets at present, but I try to focus on the positive in any situation. Right now remaining optimistic is a daily battle amid the constant barrage of depressed economic data. Instead of focusing on all of the various risks, I focus on finding opportunities where probabilities are favorable based primarily on historical price data, cycle analysis, and tape reading.
Back on April 9th I proffered an article that discussed my expectation that the U.S. Dollar Index would rally while risk assets such as equities and oil prices would collapse. Additionally I commented on my expectations for weakness in gold, silver, and the entire mining complex. I was wrong about the timing of the U.S. Dollar’s advance, but the ultimate price action analysis was correct.
The following quote came from that article, “As shown above, I believe that short term targets to the downside are likely somewhere in the 1,475 – 1,525 price range. I think gold will find a major bottom near these levels and a strong bounce will play out.” (Click here to view the entire article)
When I originally wrote that article referring to a decline in gold prices gold futures were trading around 1,630 an ounce. Price rallied sharply higher after my article went public, but fast forward to today and my concerns appear to be well founded. I am a long-term gold bull and I ultimately believe that new highs will occur in the future. However, gold and gold miner’s may have further to fall before they find major support.
As stated above, my original expectations for the Dollar Index did not happen in the time frame I was anticipating. However, the belief that a rally was forthcoming proved to be accurate as can be seen from the price chart of the U.S. Dollar Index shown below.
U.S. Dollar Index Daily Chart
As can be seen above, the price action is confirming serious strength. The weekly close on Friday saw the Dollar close above a key short-term resistance level. Additionally I would point out the double bottom that has been carved out on the chart above which is also bullish. Should resistance near 80.76 give way to higher prices a test of the recent highs is quite possible.
The technical picture suggests higher prices in the near term for the greenback. From a fundamental viewpoint, recent economic data also suggests that higher prices may await as one the largest weekly debt issuance of 2012 among sovereigns within the Eurozone will transpire next week. If any of the debt auctions go poorly it will reflect negatively on the Euro currency and help push the Dollar higher.
Most of the debt issuance is outside of the 3 year maturity window so the LTRO justification to encumber risk does not apply. Next week we will find out just how serious investors are about accepting default risk on European debt instruments. I would be shocked if the ECB sits idly by, but the sheer amount of capital required to safeguard debt issuance next week is extreme, even for a major central bank.
The Euro currency continues to fall and has broken key resistance around the 1.30 price level on the EUR/USD currency pair. Price is not collapsing as of yet, but we are seeing a slow and steady slog lower for the Euro. This price action serves to boost the Dollar which ultimately places downward pressure on risk assets such as equities and oil. Additionally, it reduces the valuation of gold. The daily chart of gold futures is shown below.
Gold Futures Daily Chart
The recent price action in gold has been quite ugly and price is resting at key support stemming from an intermediate-term descending channel shown above. Should the lower bound break to the downside a sharp move lower could play out.
It is important to remember that gold is coming off a monster multi-year bull run and it only serves to make sense that a nasty pullback that shakes out the bulls would be forthcoming. I continue to believe that strong support and buyers will come back into gold around the 1,450 – 1,550 price range as significant long-term support levels should hold up prices. The key support zone is clearly illustrated in the chart above.
I continue to wait for price to reach that key support level and based on the current proximity those support levels are magnetizing price toward them. When long-term support / resistance levels are near price a test is a common occurrence. The most important question to ask is whether the support zone shown above will hold, or will even lower prices ultimately play out?
Gold and silver both are starting to become oversold on the daily time frame. While the gold bugs have been feeling pain the past few weeks, the gold miners have been taken out back to the woodshed for a good whipping. The miners have been absolutely crushed in 2012 .
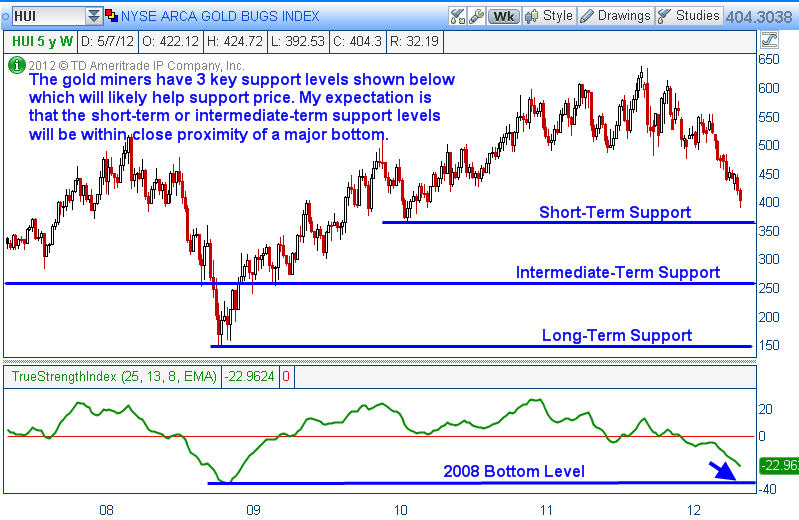
My long term analysis revealed something quite extraordinary on the longer term weekly chart of the HUI gold mining index which I believe is critical for readers to watch and monitor. We are nearing valuation levels based on the true strength index that have not been seen since the market crash that took place back in 2008. The weekly chart of the gold bugs index is shown below.
Gold Bugs Index Weekly Chart
As can be seen above, the Gold Bugs Index (HUI) has been under considerable selling pressure since early September of 2011. However, note how low the True Strength Index is based on 5 years of price data. We are nearing the same level that we saw back in 2008 which marked a major bottom that ultimately resulted in a monster move to the upside for the gold miners.
I am of the opinion that this chart demonstrates quite clearly that a great buying opportunity for gold, silver, and the miners is likely going to present itself in the near future. I will be watching this price relationship over the next few weeks waiting for a strong entry point for a longer-term purchase. After this pullback concludes, the potential returns that could occur in gold, silver, and the miners could be breathtaking.
With 3 clear support levels, a defined risk approach could be used in order to scale in or to reduce market risk should prices continue to move below each support level. While the time is not right just yet, more than likely a solid long-term risk / reward trade may very well present itself in the precious metals and mining space. I am likely a bit early, but the ultimate end game as it relates to fiat currency is documented throughout history. The final result has a finality that few truly comprehend.
Happy Trading and Investing!
JW Jones & Chris Vermeulen
This material should not be considered investment advice. J.W. Jones is not a registered investment advisor. Under no circumstances should any content from this article or the OptionsTradingSignals.com website be used or interpreted as a recommendation to buy or sell any type of security or commodity contract. This material is not a solicitation for a trading approach to financial markets. Any investment decisions must in all cases be made by the reader or by his or her registered investment advisor. This information is for educational purposes only.
http://www.thegoldandoilguy.com/wp-content/uploads/2014/11/tgaoglogo.png00adminhttp://www.thegoldandoilguy.com/wp-content/uploads/2014/11/tgaoglogo.pngadmin2012-05-14 08:38:042014-03-06 11:51:18Gold & Gold Miners Are Closing in on a Major Bottom
“No State shall enter into any Treaty, Alliance, or Confederation; grant Letters of Marque and Reprisal; coin Money; emit Bills of Credit; make any Thing but gold and silver Coin a Tender in Payment of Debts; pass any Bill of Attainder, ex post facto Law, or Law impairing the Obligation of Contracts, or grant any Title of Nobility.”
~ United States Constitution, Excerpt from Article 1, Section 10 ~
A quick glance at most of the headlines over the weekend and the primary focus seemed to be either calling a near term top in domestic equity indices or a focus on the Greek debt situation. Why is anyone even paying attention to what is going on over there? Until the ISDA declares a default where the underlying Credit Default Swaps (CDS) are triggered, it is all just noise.
The ECB has broken the rule of law by placing itself as the senior creditor ahead of private creditors, the Greek government is trying to pass retroactive legislation to trap private sector creditors holding out of the PSI, and the leader of Greece was not even elected by the people of Greece – how much more manipulation and insanity do we need to monitor?
Similar to the price action since 2008, central banks around the world control everything from financial markets to the ascent of political leaders. These same political leaders help central bankers and planners control policy and decision making at the highest government levels in Europe and around the world. It would seem that the United States should change the motto from “We the People” to “We the Bankers.”
However, there is one particular asset class that even the central bankers have a hard time controlling. While they can impact short term price action through direct currency manipulation initiatives, in the longer-term gold is likely to move in only one direction – higher.
The price action on Tuesday reminded market participants that actions such as the Greek bailout come at a cost. Quantitative easing and/or printing money (depending on what one wishes to call the practice of producing fiat currency out of thin air) has a direct impact on the price of gold.
Many financial pundits argue that gold has no utility, but what they fail to recognize is that gold is the senior currency to all other fiat currencies. Silver is also a form of currency and is senior to all other fiat currencies as well. While one can draw the utility of gold into question, the idea that gold is the senior most currency to all other fiat currencies is not new.
The Constitution of the United States of America, which is over 200 years old, refers to gold and silver as forms of payment. Looking back thousands of years the Romans used gold coins as a form of currency. The idea that gold and silver are currencies is certainly not a grandiose thought or a stretch of historical concept. Trying to depict gold as a worthless asset depends on your view and consideration of fiat currency.
There are those that would argue that the Federal Reserve of the United States is not actively manipulating economic conditions domestically or abroad. For those that view gold as a poor investment or hedge against currency devaluation need to consider the charts illustrated below. The chart below was produced by Thomas Gresham of Gresham’s Law.
Total Asset Growth of the Federal Reserve System – 1915 – 2012
It is rather obvious by looking at this chart that the Federal Reserve has actively sought to enter domestic and foreign financial markets. The surge in balance sheet assets serves to prove how far the Federal Reserve Bank is willing to go to maintain markets which seemingly are only allowed to move higher over time.
This chart is bearish for nearly any form of paper backed assets. The above referenced chart is long-term bearish for the Dollar and Treasuries and long-term bullish for physical gold and silver. As the Federal Reserve continues to debase the U.S. Dollar in concert with other central banks’ monetary easing programs, gold and silver prices over time are destined to move higher in virtually every form of fiat currency.
During the same time frame that the Federal Reserve has seen its balance sheet grow exponentially, the rapid rise of M2 money supply is staggering. The long term chart of M2 is compared to gold futures in the charts presented below.
M2 Money Stock
Gold Futures Monthly Chart
It is rather obvious what has happened to the price of gold as the M2 money supply has grown. The idea that the Federal Reserve has not already destroyed a significant amount of the purchasing power of the Dollar can easily be refuted by the two charts shown above.
In the short-term, gold and silver could suffer from a pullback, but in the intermediate to longer term it is unlikely that we have seen the highs of this bull market for either metal. As long as central banks around the world continue to print money and expand their balance sheets gold and silver will remain in a long-term bull market. The daily chart of gold futures is presented below.
Gold Futures Daily Chart
As can be seen above, it is not out of the question that we could see gold pullback to test one of the key moving averages in coming days/weeks. However, I expect the key support area to hold in the event of a sharp selloff. Ultimately, I expect to see a breakout over the resistance zone in the days/weeks ahead. However, I would not be surprised to see gold consolidate or work marginally lower from current prices before breaking out to the upside. Right now the primary threat in this fledgling gold rally is a short-term spike higher in the U.S. Dollar. The primary catalyst which could drive a flight to the Dollar involves the sovereign debt situation in Greece and the Eurozone as a whole.
While the short-term price action may be bearish, the intermediate to longer term time frames are quite bullish for metals as central banks will continue to race to debase their currencies. Quantitative easing in the U.S. and around the world will become pervasive and gold prices could potentially soar in value. The data from the Federal Reserve Bank itself suggests that they are indeed increasing the money supply. As time has passed, the money supply and gold have seemingly grown in lockstep with one another. Surely inquiring minds do not consider this mutual relationship between gold and the money supply to be purely coincidental.
As further evidence that the Federal Reserve continues to use quantitative easing to manipulate asset prices through direct entry into financial markets, a chart of the velocity of M2 clearly depicts that the velocity of money is declining. I am not an expert regarding macroeconomic data, but if the velocity of money is declining to 1960’s levels would it be a stretch to say that we may be going through a period of stagflation? The chart below illustrates the Velocity of M2 Money Stock courtesy of the St. Louis Federal Reserve Bank.
Velocity of M2 Money Stock
For those unfamiliar with the term velocity of money, it is simply the rate of turnover in the overall money supply. The velocity of M2 is expressed as the number of times that a Dollar is used to purchase final goods or services which are included in the total gross domestic product.
Conclusion
The short term technical picture in gold is a bit suspect due to overhead resistance and recent U.S. Dollar strength. However, the longer term macro factors that impact the value of the U.S. Dollar and precious metals are all telling us the same thing.
As time wears on and central banks do even more to prop up the broader economy and failing financial institutions, it is without question in my mind that gold and silver will both benefit handsomely from these decisions being made by central bankers from around the world.
Ultimately, I am very bullish of gold and silver in the intermediate to longer-term, but in the immediate short-term frame gold could consolidate or pullback before breaking out to the upside.
This material should not be considered investment advice. J.W. Jones is not a registered investment advisor. Under no circumstances should any content from this article or the OptionsTradingSignals.com website be used or interpreted as a recommendation to buy or sell any type of security or commodity contract. This material is not a solicitation for a trading approach to financial markets. Any investment decisions must in all cases be made by the reader or by his or her registered investment advisor. This information is for educational purposes only.
http://www.thegoldandoilguy.com/wp-content/uploads/2014/11/tgaoglogo.png00adminhttp://www.thegoldandoilguy.com/wp-content/uploads/2014/11/tgaoglogo.pngadmin2012-02-21 20:21:262014-03-06 12:19:16The Long-Term Fundamental Case for Gold
Now that Mr. Bernanke’s speech is old news, what was the financial media thinking exactly? A significant number of financial writers have been anticipating discussion of QE III or QE III Lite which clearly were never even on the Fed Chief’s radar this week. The focus of the Jackson Hole Summit was how to achieve long-run growth, not conduct discussion of monetary policy.
QE III will not be discussed openly until the next FOMC meeting in September, which noticeably was extended to two days. Besides the extension and the Fed Chairman’s prediction of growth in the back half of the year, the remainder of Mr. Bernanke’s speech was nothing more than a brief synopsis of what he has already said in the recent past.
While Chairman Bernanke focuses on the U.S. economy, I have been more inclined to monitor the action across the pond. Price action in Europe is having a major impact on financial markets here in the United States. Traders are monitoring credit default swap (CDS) spreads on European sovereign debt as well as on domestic and European banks.
Recently U.S. banks have seen the CDS swaps on their debt rising indicating that the marketplace believes their debt is a greater risk to investors. While the price action is nowhere near the 2008 & 2009 levels, current prices are relatively consistent with what was seen during the correction in the late spring of 2010. While there is no reason to panic at this point, this is a trend that I will be monitoring closely going forward.
For now, I continue to believe that equity markets will rally in coming weeks as conditions are extremely oversold. The price action so far today makes sense as the wild price swings helped flush out weak hands that were long. Consequently, the snap back rally pushed shorts into stop levels as well.
A significant move lower does not seem likely at this point, but a retest of the recent lows is possible, if not probable. I would remind readers that stock market crashes generally happen within the context of an oversold market. While the likelihood of a crash is remote, it is still possible and tight risk definition in this environment is warranted regardless of which side of the tape a trader is playing.
One price chart that I have been watching closely is the German DAX. The German DAX is presently a thermometer for traders to monitor the situation in Europe. The reason the German stock market index is so important is due to the financial strength of Germany within the Eurozone. Without Germany, the Eurozone would crumble in on itself and the Euro currency would be in trouble. Recently Germany’s equity markets have been crushed and the daily chart below illustrates the recent carnage:
Another metric I monitor regularly is market momentum. The chart below illustrates the number of domestic stocks trading above their 200 period moving averages. As can be seen below, the U.S. equity market has not been this “oversold” since back in 2009. Chart courtesy of Barchart.com.
In my previous article posted back on August 18th, I discussed the likelihood for stocks to pullback and put in some form of a basing pattern. I wrote the following statement in that article:
“It is entirely plausible that Mr. Market thrusts lower from here to shake out longs. If that scenario plays out it could potentially carve out a double bottom or another basing pattern which would give active traders another entry point to get long.”
Since August 18th, we have seen the S&P 500 push lower and there is a double bottom on the daily chart which is capturing quite a bit of attention in the trading community. I would also draw your attention to the wedge pattern that is also present. A breakout higher or lower out of this wedge pattern will be the clue that will indicate Mr. Market’s short term price direction. I continue to believe we will see a breakout higher, but a retest of the lows is always a possibility. The daily chart of the S&P 500 Index is shown below:
In the short to intermediate term, I believe we will see higher prices and a test of the key S&P 1,220 area or possibly a re-test of the key S&P 1,250 price level which corresponds with the March 2011 pivot lows. Additional resistance would come in around the 1,260 – 1.270 area which marks the neckline of the recent head and shoulders pattern which triggered the selloff in the S&P 500. The daily chart of the SPX below illustrates the key resistance areas:
Gold Analysis
My most recent article argued that gold prices were going parabolic and that a pullback was likely. We have seen a major pullback in gold prices. Admittedly, I was about $200 an ounce early on my call, but members of my service were able to capitalize on an option trade that captured 32% based on maximum risk through the use of a double calendar spread. While my timing was not precise, the juiced volatility in the GLD options allowed me to roll contracts forward and make additional adjustments to produce a strong gain for the service.
Some traders argue that gold prices are going to rally back sharply in short order, which I find hard to believe. Instead, I am of the opinion that we could see additional downside in the weeks/months ahead in gold prices. There is an ominous pattern starting to form on the gold daily chart which if it is carved out and triggered, it could produce the next leg of this selloff. The daily chart of gold is shown below:
While it is far too early to determine if a head and shoulders pattern will be carved out or if lower prices take place, I am of the opinion that this selloff will offer an attractive entry point for longer term investors. At this point it is a bit too early to get involved, but if my analysis is accurate the next leg of the gold bull market will be potentially extreme.
While I believe stocks will rally in the short to intermediate term, I am of the opinion that we have officially entered the next phase of the bear market. The next wave lower in stocks is going to be just as severe as the likely rally in gold.
The reason I believe gold will rally is primarily due to future weakness in Europe. If European banks have a credit crisis, a sovereign nation unexpectedly defaults, Germany leaves the Eurozone, or a currency crisis transpires gold prices should soar while U.S. equity prices tank.
While it is far too early to make that determination, if the S&P 500 puts in a lower high on this next advance higher and consequently takes out the recent lows on a selloff, the bear will be in full swing and gold prices should take off. The chart below illustrates my expectations for the S&P 500 in the future:
The next few weeks are going to be very telling about the future in domestic markets. Is this just a correction that pushes stocks higher by the end of the year, or is this the beginning of something far worse?
For now I am going with the latter, but price action in coming weeks will offer clues about what lies ahead for U.S. equity markets. Right now this is nothing more than speculation, but the next few months should be very interesting. Risk remains exceedingly high.
This material should not be considered investment advice. J.W. Jones is not a registered investment advisor. Under no circumstances should any content from this article or the OptionsTradingSignals.com website be used or interpreted as a recommendation to buy or sell any type of security or commodity contract. This material is not a solicitation for a trading approach to financial markets. Any investment decisions must in all cases be made by the reader or by his or her registered investment advisor. This information is for educational purposes only.
http://www.thegoldandoilguy.com/wp-content/uploads/2014/11/tgaoglogo.png00adminhttp://www.thegoldandoilguy.com/wp-content/uploads/2014/11/tgaoglogo.pngadmin2011-08-28 22:39:452014-03-07 11:52:30What Could Lie Ahead for the S&P 500 & Gold
This week we have a major wild card (Election) happening on Tuesday. Most of you know I don’t get involved with political discussion for several reasons… one of them being that I am Canadian “an outsider” looking in.
That being said, it looks and feels as though the market has been propped up and oil has been held down from an invisible force. Lots of theories going around saying higher stock and lower/stable oil prices will give voters the warm fuzzies to keep the current leaders elected… I prefer trading the charts and not getting caught in the Wall St. hype.
Let’s take a quick look at some charts
SPY – SP500 ETF Trading Vehicle
The broad market has been finding buyers as the beginning of each month and it looks as though it’s ready for another bounce. I do want to note that Tuesday or Wednesday we could see a very sharp move in the market as investors around the world digest the outcome. It is very important to keep positions small and or use protective stops incase of a flash crash or flash rally for those of you trying to pick a top.
Gold Price – Futures Contract
The price of gold looks to be setting up for another wave down in my opinion. More often than not we see a sharp pullback, sideways chop then a pop above recent highs. It’s that pop above recent highs which tends to suck in long positions only to roll over and make new lows quickly after. As noted in previous reports, gold has support around $1300 area and that’s what I am looking for. Again this week’s election will trump recent price action so we really just need to sit tight until the smoke settles.
Crude Oil Futures:
Crude oil has been trading sideways for a solid month while the US dollar has been dropping at tremendous rate. Many oil traders believe the price is being manipulated to stay down until the election is finished because of the strong negative affect rising oil prices have on the economy/end user/voters.
Weekend Trading Conclusion:
In short, this is a going to be a wild week in the market. Keeping position sizes small and using protective stops is crucial during times like these. We have taken profits on both of our positions from last week and have moved our stops to breakeven for the balance just incase of a crash.
Overall, I am neutral on the market for a couple days until we see what type of blip we get on the charts.
If you would like to receive my Daily Trading Commentary, Charts and Trades be sure to join my newsletter: www.TheGoldAndOilGuy.com
http://www.thegoldandoilguy.com/wp-content/uploads/2014/11/tgaoglogo.png00adminhttp://www.thegoldandoilguy.com/wp-content/uploads/2014/11/tgaoglogo.pngadmin2010-11-01 00:03:352014-03-10 08:53:09Gold, Oil, SPX Trading Around the Election
Overall this week has not been that exciting. Volume is below average as the big money traders slowly get back into action and wait for Fridays economic data to come out.
We have seen gold, silver and oil put in a nice rally this week but they are still not in the clear. If we get flat or better unemployment numbers we should see the US dollar rally. This seems to be exactly what the chart is telling us when using technical analysis. Here are the numbers for Friday.
Friday unemployment numbers come out for both the US & Canada.
7:00 AM ET – Canadian Unemployment Rate, Forecast 8.5%, Previous 8.5%
8:30 AM ET – USD Nonfarm Payrolls, Forecast 0%, Previous -11K
8:30 AM ET – USD Unemployment Rate, Forecast 10.1%, Previous 10%
US Dollar Daily Trend
The current trend of the dollar is now up when looking at the daily chart (higher highs and lows). The strong price thrust in December has formed a nice flag pattern. This is a continuation pattern meaning the dollar should continue higher once this pause is complete.
US Dollar Trend
Gold Futures Trading Trend – 60 Minute Candle Chart
As you can see from the chart below gold has made a short term bottom and is trading at a major resistance level. The question is, does gold reverse and head sharply lower or does it break through the resistance level?
Could this be the start of a new leg higher or a C wave lower (ABC retrace)?
I hope it is an ABC retrace which is a bullish price pattern and it flushes out the weak positions before heading higher.
These are questions no one knows for sure but understanding where the current price is trading and that volatility could pick up very quickly in the next couple days is crucial. When volatility is about to increase managing your open positions or adjusting any possible new trades is an important part of being a successful trader.
Rule #1 Keep overall risk per trade low
If volatility is about to increase I usually trade smaller positions unless I am in the zone and feeling the markets each and every move.
Rule #2 Never let a winning trade turn into a loser
I scale out of positions a little quicker during volatile times to lock in a small profit (20-30% of position) which minimizes my overall risk. This also alleviates some stress as you now have a small profit and you feel good mentally.
Gold Futures Trend Trading
Crude Oil – Daily Trend Trading Chart
Many of us have had a great run with oil. Some of us traded the USO fund which is equivalent to buying oil at $71. Volatility was high during the time of the trade so we scaled out of the position at $75, $77.50 and $80. Some of you still have a small core position still in place which is fantastic to see!
Currently oil looks long in the teeth and ready for a pullback which could end up working perfect with Friday’s Economic news. Only time will tell so lets take it one candle at a time.
Trend Of Crude Oil
Commodity Trend Trading Conclusion:
In short, this is the first week of the year with light volume as traders get back in the groove and wait for 2010’s first big economic news to hit the wires. No many of us want to stick their necks out just yet.
I don’t know what will happen but my thoughts are the news will be positive, even if its not. Some very well educated individuals think the unemployment numbers are false giving everyone the impression things are getting better. I don’t really know what to think, but I did just see Mr. Moores most recent file on Tuesday and I think it is very possible the US is pulling a long con on Americans. All I can say is thank god I’m Canadian Eh! lol
Anyways if the numbers are positive we will see money move into the US dollar, gold and oil will reverse back down. Stocks I think are decoupling from the inverse relationship with the dollar and if that is the case stocks should do well.
Trading before big news can be deadly so I continue wait until Friday or next week before doing much.
If you would like these trading reports delivered to your inbox:
http://www.thegoldandoilguy.com/wp-content/uploads/2014/11/tgaoglogo.png00adminhttp://www.thegoldandoilguy.com/wp-content/uploads/2014/11/tgaoglogo.pngadmin2010-01-06 23:45:202014-03-10 10:32:45Nonfarm Payrolls This Friday Could Dampen Commodities