Posts

Our research team authored an article suggesting that our Adaptive Dynamic Learning Predictive Modeling system indicated the US major markets were 12% to 15% overvalued on May 23, 2020.  This was just before the last “euphoric” phase of the recent rally took began the week after our prediction.  From the date of May 23, 2020, to the recent peak in the markets, the SPY rallied another 9.72% above the price levels when we made the ADL prediction.  This suggests that the major markets rallied to levels near 21% to 24% overvalued near the recent peak.

Please take a moment to review our original ADL article here: https://www.thetechnicaltraders.com/predictive-modeling-suggests-us-markets-12-over-valued/

In keeping with our research team’s conclusions, the downside price move that initiated on Wednesday, June 10, 2020, after the US Fed statements, and really broke down on June 11, 2020, will likely continue resulting in the US major markets attempting to find support near our ADL predictive modeling system levels.  The downside price trend could extend below our ADL price target levels if the selling in the markets pushes into an extreme selling event.  It is not uncommon for the price to attempt to move through the ADL price levels attempting to find support and/or resistance.

Before you continue, be sure to opt-in to our free market trend signals 
before closing this page, so you don’t miss our next special report!

ORIGINAL ES ADL PREDICTED TARGET LEVEL WEEKLY

This is the ES chart showing our ADL predictive modeling system results from the May 23, 2020 date.  You can see the ADL predicted price levels near 2520 on this chart and the fact that the markets rallied away from these levels in late May created what we call a “price anomaly”.  This is when price moves away from the ADL levels in a manner that is somewhat unreasonable.  The same thing happened during the peak price level in early February 2018 and the October peak in 2018.

SPY ADL PREDICTED TARGET LEVEL DAILY

Based on our ADL predictive modeling system and the targeted price levels, we believe the SPY will fall to levels close to or below $260 over the next 10 to 15+ days.  It makes perfect sense that the markets over-extended a speculative price rally based on the context that the US economy would rebound from the COVID-19 shutdown.

Now that the US Fed has deflated that expectation and the riots and other issues related to social and political events are pending, we believe a “sudden realization” within the markets could send the US stock market price levels much lower over the next 2+ weeks – eventually attempting to find support near recent lows.

We actually posted our technical forecast for the market crash, the 30% rally, and called this blow-off top and reversal 4 days before it happened in this video a while back.

CONCLUDING THOUGHTS:

Remember, developing a winning strategy is not about trading every trend and day-trading every move, it is about timing your trades and strategically positioning your portfolio to take advantage of the “best asset now”.  We’ve developed proprietary technology that assists us in determining the best assets to be invested in and our predictive modeling and other proprietary tools assist us in identifying confirmed trade triggers.  Our objective is to assist our clients in generating consistent profits – not hundreds of trades.

If you were caught on the wrong side of this move recently, please remember that we tried to warn you of our multiple research articles and clear content.  We’ve been warning that this upside rally was a speculative price move driven by foreign and US investors believing the V-shaped recovery was real.  The reality of the situation is that this recovery is going to be much more volatile than many people believe.  This is a global economic event – not just a Fed Blip or some other isolated panic volatility.

You better stay on top of these trends and risks in the markets to stay ahead of these bigger moves.

As a technical analyst and trader since 1997, I have been through a few bull/bear market cycles in stocks and commodities. I believe I have a good pulse on the market and timing key turning points for investing and short-term swing traders. 2020 is an incredible year for traders and investors.  Don’t miss all the incredible trends and trade setups.

Subscribers of my Active ETF Swing Trading Newsletter had our trading accounts close at a new high watermark. We not only exited the equities market as it started to roll over in February, but we profited from the sell-off in a very controlled way with TLT bonds for a 20% gain. This week we closed out SPY ETF trade taking advantage of this bounce and entered a new trade with our account is at another all-time high value.

Ride my coattails as I navigate these financial markets and build wealth while others watch most of their retirement funds drop another 35-65% during the rest of this financial crisis going into late 2020 and early 2021.

Just think of this for a minute. While most of us have active trading accounts, what is even more important are our long-term investment and retirement accounts. Why? Because they are, in most cases, our largest store of wealth other than our homes, and if they are not protected during the next bear market, you could lose 25-50% or more of your net worth. The good news is we can preserve and even grow our long term capital when things get ugly like they are now and ill show you how. One of the best trades is one your financial advisor will never let you do because they do not make money from the trade/position but we do have a way for you or your advisor can take advantage of the market gyrations with our Technical Wealth Advisor investing signals.

If you have any type of retirement account and are looking for signals when to own equities, bonds, or cash, be sure to become a member of my Passive Long-Term ETF Investing Signals which we issued a new signal for subscribers.

Chris Vermeulen
Chief Market Strategies
Founder of Technical Traders Ltd.

New economic data being released as earnings start to hit may alter how investors perceive the recent price recovery in the US and global markets.  Many institutional analysts began suggesting “the bottom is in” and recently began to issue stronger forward guidance.  The new data suggests we are seeing an economic contraction that, in some cases, maybe 2x or 3x the contraction that took place in the 2008-09 Credit Crisis.

The US stock markets reacted to this news and earnings data by collapsing over -2% in early trading.  Gold and Silver are both lower as we write this article which would indicate weakness across the broader market.  We continue to believe a deeper price low will set up in the near future with the US and global stock prices attempting to retest recent price lows – possibly falling below these levels.  We believe the collateral damage to consumer engagement, manufacturing, transportation, retail/leisure, real estate and other sectors of the economy is just now starting to become evident.  What the economy may look like near Mid-May is anyone’s guess.

MANUFACTURING OUTPUT INDEX

One of the most interesting data items published recently in the US Manufacturing Output Index which reported at -6.3%.  This is the largest downside (negative) print going back over 20 years.  It is nearly 2x larger than the deepest levels from the 2008-09 Credit Crisis and nearly 6x the levels of the 2001 9/11 terrorist attacks.  This time it really is different.

Before we continue, be sure to opt-in to our free market trend signals 
before closing this page, so you don’t miss our next special report!

NEW YORK EMPIRE STATE MANUFACTURING INDEX

The New York Empire State Manufacturing Index was no different – posting a level at -78.20%.  This massive negative number is nearly 2x the deepest levels printed during the 2008-09 Credit Crisis and clearly illustrates how the COVID-19 virus event has disrupted manufacturing output across the globe.  Depressed manufacturing translates into decreased shipping, decreased supply, decreased demand, and decreased overall economic engagement (employment, support services, taxes, and others).  A number similar to the lows of 2008-09 would be sufficiently terrible.  A number that is 2x below the lowest levels in 2008-09 is absolutely destructive to forward expectations.

NAHB REAL ESTATE INDEX

Real estate is starting to feel the pinch too.  The NAHB Real Estate Index came in at 30.  The only times in history where this level has been reached were September 1990, October 2006, and June 2007.  These areas in history clearly point to an early recession indicator in the markets.  We found it interesting that September 2001 (9/11) didn’t experience any major downside print in the NAHB index.  The lowest level reached after 9/11 was 46 (November 2001).  The current 30 level is shocking.  If history is any indication of what to expect in the future, this real estate index may attempt to set up an extended bottom near or below 15 to 20 over the next 12+ months.

REDBOOK INDEX

Lastly, the Redbook Index – which printed a level of -8.3.  This index of over 9000 retail locations is one of the broadest market indicators of consumer/retail-based activity in the US.  Obviously, with the shutdown taking place within the US and across the globe, we were not expecting any type of fantastic number. Yet our concern is that consumer engagement continues to slowly emerge from the shutdown over the next 12+ months and the collapse in retail may become prolonged

Historically, this is the deepest level printed on the Redbook Index since 2008-09.  We believe the continued shutdown and disruption to traditional manufacturing, supply and retail will continue to present very negative outcomes for global economic measures.  Thus, we believe the risks to the US and global stock market are still very real for skilled traders.

CONCLUDING THOUGHTS:

The US Fed and global central banks are doing everything possible to support a shocked global economy – yet they can’t print enough money to replace the global activity of consumers, manufacturers, and traditional economic functions. They can just attempt to “patch things up” while they wait for consumers and manufacturers to begin operating near-normal levels.

It is very important for skilled traders to understand the bigger economic risks that are at play and to understand the process of price moves within the current market cycle.  I was recently interviewed about my market opinions and stated very clearly how investors could fall into a “suckers rally” trap.  Listen to my talk here.

Be prepared for more downside risks and a potential for a much deeper price bottom over the next 6+ months.  Those individuals/firms suggesting “the bottom is in” are certainly jumping the shark, in our opinion, right now.  It’s a pretty big event to come out right now and tell investors “buy these dips because we believe the US Fed has everything under control”.  Be cautious and use your own skills to wait for a proper bottom setup.

I have to toot my own horn here a little because subscribers and I had our trading accounts close at a new high watermark for our accounts. We not only exited the equities market as it started to roll over, but we profited from the sell-off in a very controlled way, and yesterday we locked in more profits with our SPY ETF trade on this bounce.

As a technical analyst and trader since 1997, I have been through a few bull/bear market cycles in stocks and commodities. I believe I have a good pulse on the market and timing key turning points for investing and short-term swing traders. 2020 is going to be an incredible year for skilled traders.  Don’t miss all the incredible moves and trade setups.

I hope you found this informative, and if you would like to get a pre-market video every day before the opening bell, along with my trade alerts. These simple to follow ETF swing trades have our trading accounts sitting at new high water marks yet again this week, not many traders can say that this year. Visit my Active ETF Trading Newsletter.

We all have trading accounts, and while our trading accounts are important, what is even more important are our long-term investment and retirement accounts. Why? Because they are, in most cases, our largest store of wealth other than our homes, and if they are not protected during a time like this, you could lose 25-50% or more of your entire net worth. The good news is we can preserve and even grow our long term capital when things get ugly like they are now and ill show you how and one of the best trades is one your financial advisor will never let you do because they do not make money from the trade/position.

If you have any type of retirement account and are looking for signals when to own equities, bonds, or cash, be sure to become a member of my Long-Term Investing Signals which we issued a new signal for subscribers.

Ride my coattails as I navigate these financial markets and build wealth while others lose nearly everything they own during the next financial crisis.

Chris Vermeulen
Chief Market Strategies
Founder of Technical Traders Ltd.

Chris Vermeulen www.TheGoldAndOilGuy.com

Over the past week I have been keeping my eye on several key sectors and stocks for potentially large end of year rallies to lock in more gains before 2013.

My recent calls have been RIMM (up 54%), AAPL (up 5%), FB (up 8%) so it’s been a great month thus far. That being said there are three other plays that look amazing and one of them is the utilities sector.

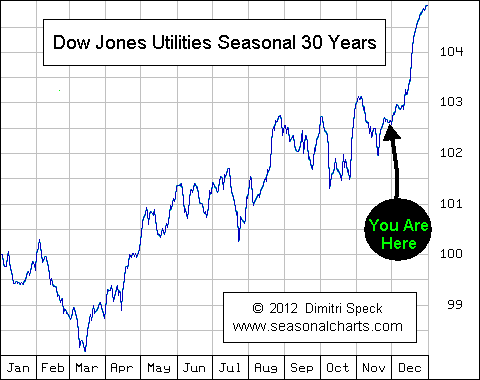
Looking back 30 years clearly utilities have a tendency to rally going into year end. What makes this setup so exciting is that the Obama tax for 2013 has caused many investors to lock in capital gains along with dividend gains so the utility sector has recently been beaten.

I always like to cheer for the underdogs because they can make large moves quickly and this season its utility stocks.

30 Year Seasonality – Utilities Stocks

Utility Stocks Seasonality


Utility Sector ETFs:

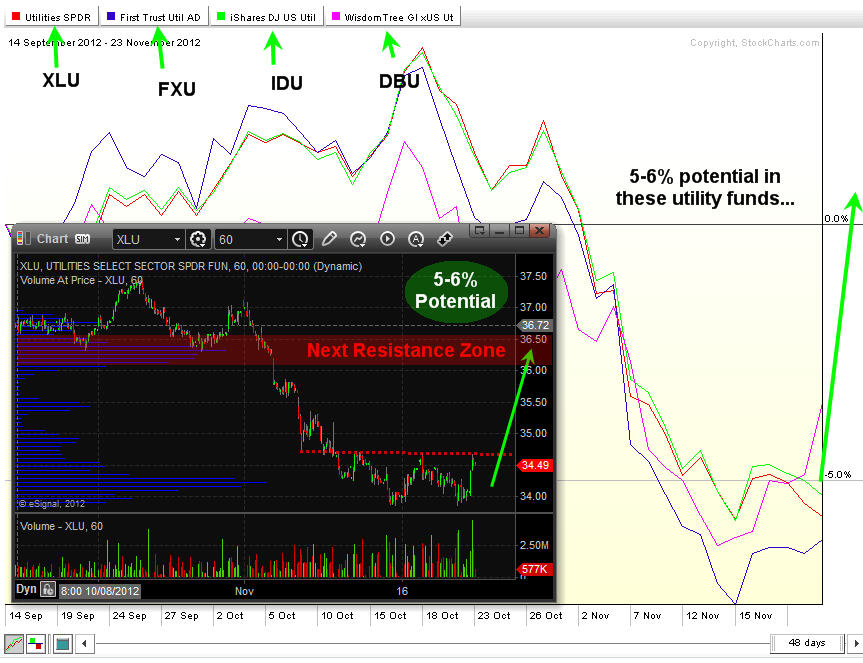
In the graph below I show the main utility ETFs for trading. Simple analysis clearly shows the selling momentum is slowing and where price should go if it can breakout above the red dotted resistance line. Exchange traded funds XLU, FXU, IDU, and DBU are the funds I found to be setting up.

Utility Sector ETFs


Utilities Sector Trading Conclusion:

While I feel utilities are about start moving higher it is important to mention that the broad market is setting up for a 1-3 day pullback. If the stock market does pullback this week then we should see utilities pullback also. What I am looking for is a minor pullback in XLU with price holding up above $34 while the stock market pulls back.

If you would like to get my simple yet profitable ETF & Stock Trading Ideas then join my newsletter today: www.TheGoldAndOilGuy.com

Chris Vermeulen

Add to SocialTrade

The market continues to whipsaw traders out of positions as volatility rises. I have put together a few charts to show you where each of our commodities are trading along with the SPX (SP500 index).

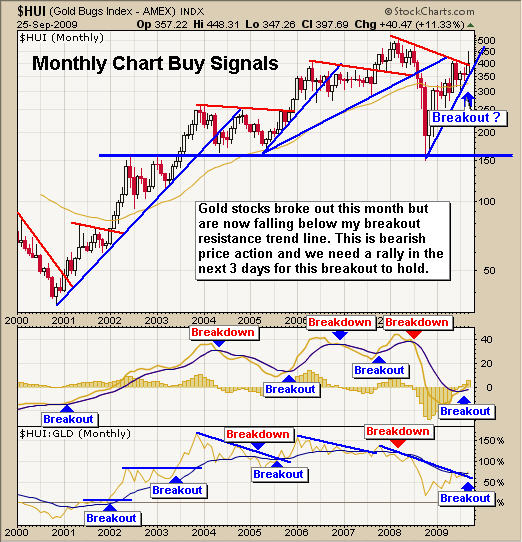
My Gold Stock Breakout Model – Monthly Chart
I use this chart to keep my big picture trades on the right side of gold. I found that gold stocks tend to lead the price of gold so watching this gold stock index on the monthly, weekly and daily charts can provide me with short term tops and bottoms for trading gold bullion, GLD or DGP exchange traded funds.

The monthly chart clearly shows the rally in stocks has now sold back down to my resistance trend line. If we do not get a rally this week in gold stocks, then I think we could see gold trade sideways or down for several months.

HUI Gold Stock Newsletter

HUI Gold Stock Newsletter

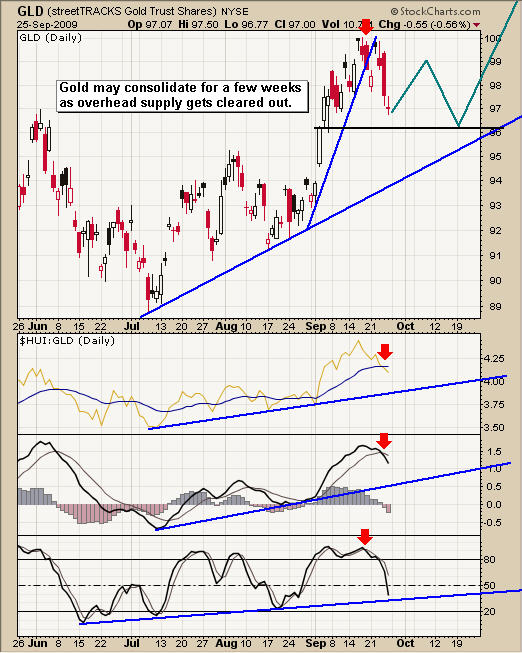
GLD Gold ETF Trading Fund – Newsletter
The daily gold bullion fund shows the recent price action and what I think could happen in the coming weeks. In the past couple days gold has moved to a short term support level where I think we could see buyers step in.

We took some profits near the high and continue to hold a core position until we have another technical breakdown or new setup to add more to the position again.

GLD Gold ETF Trading Newsletter

GLD Gold ETF Trading Newsletter

SLV Silver ETF Trading Fund – Newsletter
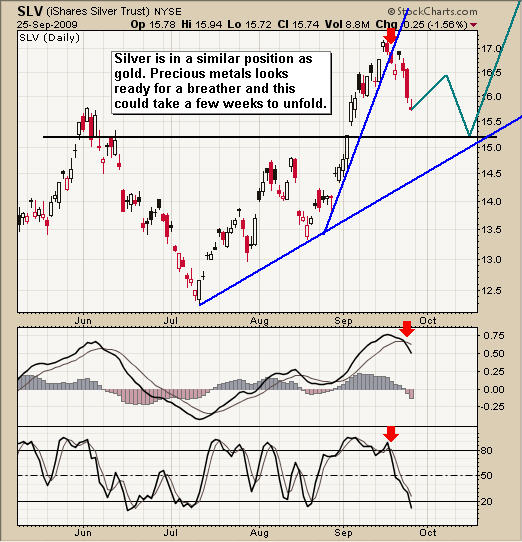
Silver is in the same boat as gold. We have taken some profits and are still holding a core position with protective stops in place just incase the market does head lower from here.

Silver SLV ETF Trading Newsletter

Silver SLV ETF Trading Newsletter

USO Crude Oil Trading Fund – Newsletter
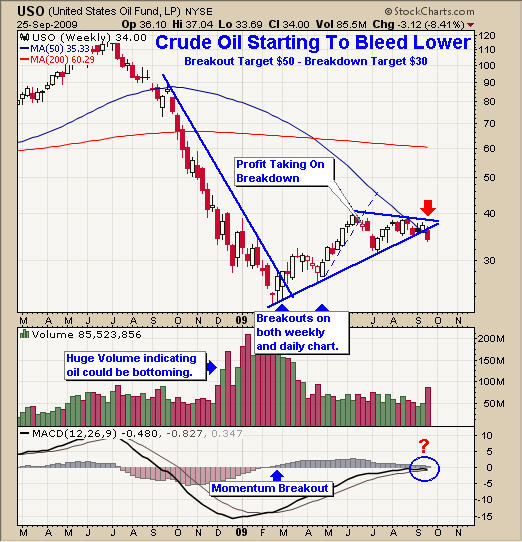
Crude oil started to bleed lower last week as the price sliced through the multi month support trend line. Volume shot up as stop orders get triggered on the way down. We finally have a move outside of the pennant formation that has been in place for several months. Now we can start looking for a low risk setup for trading crude oil again.

Crude Oil USO Trading Newsletter

Crude Oil USO Trading Newsletter

UNG Natural Gas Trading Fund – Newsletter
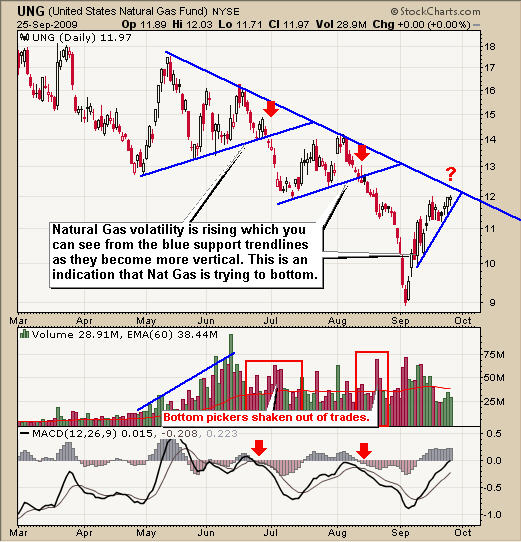
Natural gas has really come back to life. I mentioned on September 2nd that natural gas (UNG) looked like a buy between $9 – $9.50 and it has now rallied 25% since that point. But stepping back and looking at the chart we can see resistance is hovering over head between the $12 – $12.25.

I may send out a setup for a short play if we get one but I feel the heavy sell off in August was the final wave down, flushing out traders. Speculative traders seem to have moved into natural gas and I think they will continue to buy it for some time. Pullbacks will be sharp but most likely followed with more buying as we enter the cooler months of the year.

Natural Gas UNG Trading Newsletter

Natural Gas UNG Trading Newsletter

SPX Index Trading – Active Trading Partners
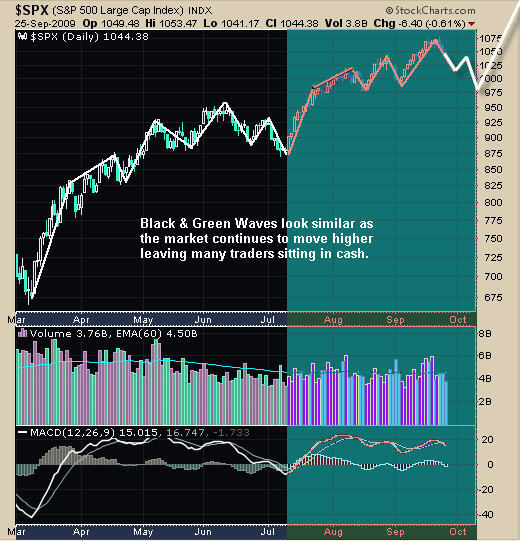
I thought that I would show a quick picture of the SPX because it shows the psychology of traders and how it repeats it’s self over and over. The black and green waves are virtually the same patterns.

I feel as though the market is ready for a larger pullback than what we had in June/July but my focus will be to buy in the oversold dips and lighten my positions in overbought conditions (scaling in and out of positions) until the trend confirms it has reversed.

SPX SP500 Trading Newsletter

SPX SP500 Trading Newsletter

My Market Trading Newsletter Conclusion:
Gold stocks are pulling back and precious metals continue to move with the overall market action. I do feel that gold and silver will break this relationship and start to move higher in the coming months but until that happens I remain cautious with my positions tightening my stops.

Crude oil is starting to come alive and I am now looking for some low risk setups for energy related funds. Last week’s technical breakdown could provide us with a big move in the coming months.

Natural Gas continues to hold up but is now trading near resistance. Depending how many spec traders there are still lingering around (as most lost their shirts in the recent months), will dictate how much higher natural gas will move. The 25-30% rally in the past month has been very powerful and this could be just the beginning. I am now waiting for another setup that could be a long or a short trade depending on what happens next.

If you would like to get my Bi-Weekly Trading Reports via email please visit my websites at: www.TheGoldAndOilGuy.com for commodities and www.ActiveTradingPartners.com for Stock Trading.

I hope everyone had a great weekend!
Chris Vermeulen