Posts

The SP500 remains in a strong uptrend, but the index has posted a sizable gains for 2013 thus far so it’s only logical that a pullback within this bull market takes place sooner than later.

With May now upon us and historically prices fall more times than not I feel a 3-4 weeks correction is on the verge of starting. This Friday we just had very strong economic numbers confirming the economy is recovering. This news has sent stocks sharply higher as shorts cover their positions and investors who are not yet long get into position to profit from higher prices. But the herd psychology and their trades are typically incorrect as they invest based on fear and greed. The old saying is buy on negative news and sell on positive news will typically get you on the correct side of the market more times than not if used with price, volume and cycles.

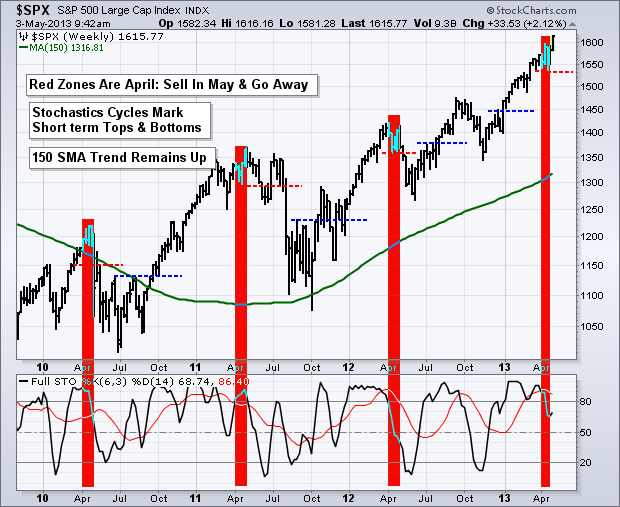
The Technical Traders – SP500 Index Weekly Chart

If we look at the price of the SP500 we need it to breakdown below the recent pivot low before I become bearish.

Volume which is not shown on this chart is below average as price moves higher and this is a bearish sign also.

Looking at a basic cycle using the stochastics indicator we can see that the current cycle is starting to turn down. Cycles tend to lead price during an uptrend so we could still have stocks move higher for another week or so but be aware that when price starts to drop its likely a market top. But until then you must respect the uptrend. Stocks can remain overbought and toppy looking for months… so done be gambling and trying to pick a top until we see breakdown start.

spy2


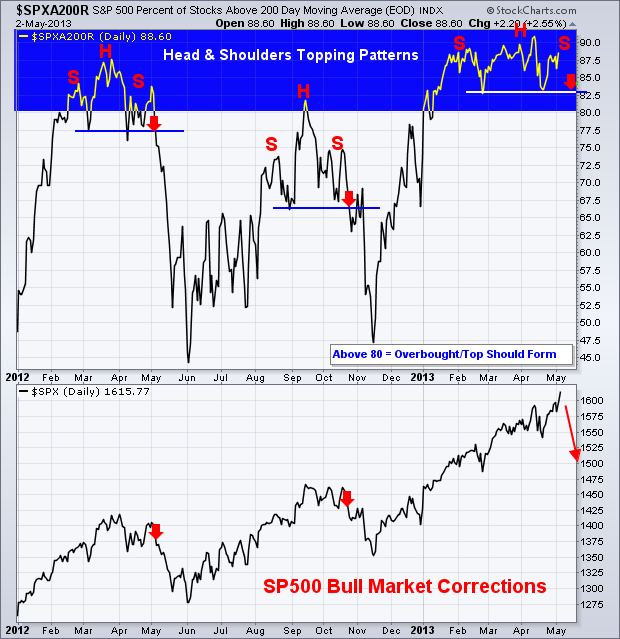
SP500 Stocks Trading Above 200 Moving Average – The Technical Traders View

Stocks trading above the 200 day moving average is a great indicator for helping spot broad market underlying strength/weakness. It does lag the market but is still very powerful. The chart below shows this info and my thinking of what is likely to unfold sooner than later though price may still rise for several days yet.

I also use a similar chart for timing swing trades and market tops which are based on stocks trading above the 20 day moving average. This chart is not shown here but is now trading at a level which generally triggers selling/market top.

spy1


Stock Market and SP500 Trading and Investing Conclusion:

In short, I am still bullish on the market as I focus on trading with the trend. I do not pick market tops and I do not pick market bottoms. Knowing that stocks make their biggest moves at the end of their uptrend and at the end of a down trend it’s only common sense that risk is extremely high if you are betting against the current trend.

The best thing to do is wait for a technical breakdown and reversal which puts the odds more in your favor with much less risk and typically a clear line in the sand to exit the position if you are incorrect.

The last major stock market top which formed in September of last year had a series of strong news and strong price action persuading the herd to buy stocks. Instead it was the last impulse wave up just before a strong correction took place. That is much like what we see now with the economic news.

Join my free newsletter and stay on right side of the market while reducing your trading/investing stress. My simple yet effective analysis walks you through the market each week without bias. Remember Price and Volume is what makes you money trading NOT news or forecasts.

Join My Newsletter Free Today: http://www.thegoldandoilguy.com/trade-money-emotions.php

Chris Vermeulen

Today the stock market bled out with a river of red candles. All of the recent gains vanished in one session. Strong selling volume sessions like this are typically a warning sign that distribution selling is starting to enter the market.

Distribution selling is when the big money players start unloading large positions in anticipation of a market top. They do try to hide it by selling into good news or earnings when the average investors are buying into all the hype of better than expected earnings on the news. As average investors jump into the market because of the good news, this extra liquidity helps the big money players (banks, hedge funds, etc..) sell large amounts of their positions to the eager buyers. This is why the “buy on rumor and sell on the news” saying is kicked around wall street….

To me, panic selling is typically seen as a bullish sign to enter the market simply because if everyone is/has rushed to the door to sell what they own, then really most of the down side risk has been taken out of the market. That being said after an extended multi month rally and higher than selling volume I look at it more like distribution selling and a shift in momentum.

I feel the precious metals sector will be starting something like this in the near futures, and possibly it has already started as seen in the rising volume on the down days.

Let’s take a look at the charts…

AAPL – Apple Stock 10 Minute Chart
Two days ago AAPL shares took big hit because of some medical issues with the CEO, the shares did float back up. But what is important here is the distribution selling which took place after Apple came out with much better than expected earnings. The general public loves to buy good news especially when it’s for a famous company. But large sellers stepped in unloading as much of their position as they could before making it look to obvious.

The average investor listening on the radio or catching snippets on the news do not pick up on these things which is why the big money players can get away with this over and over again.

GS – Goldman Sachs 10 Minute Chart
Goldman came out with average earnings being just above estimates and the share price took a beating with very strong volume.

Distribution selling looks to be entering the market and this is a bearish sign. I would not be surprised if we see the market top out in the next 5-10 trading sessions.

SPY – SP500 10 Minute Chart
Here you can see my green panic selling indicator spiking up much higher than normal dwarfing the past sell off spikes. This makes me think the big money is now starting to unload which will shift the current upward momentum to more of a sideways whipsaw type of price action. Eventually it will roll over and a new down trend will start.

As you can see from this chart the SP500 is trading down at a support level so a bounce is likely going to take place. If in fact today was the first distribution day then the big money should let the price inflate back up to the recent highs and possibly make a new high to help keep investors bullish before the hit their SELL BUTTON again… They like to play these games and understanding them is a key part of trading. Expect choppy price action for a week or two…

Silver Daily Chart – The Next Wave of Selling?
I look at silver and gold as one… so what I show here is the exact same for gold.

As you can see silver is trading under 3 of its key moving averages and todays bounce was sold into after testing the 14 and 20 period moving averages.

Take a looking at the bottom of the chart and you can see distribution selling volume as the spikes are all down days. If silver breaks below the $28 level then we could easily and quickly see the $26 and maybe even the $24 level.

The Mid-Week Market & Metals Trading Conclusion:
In short, the financial power players are pulling out all the tricks to shake traders out of their positions. A lot of people shorted the market in the past 2 weeks only to get hung out to dry and most likely stopped out of their short positions for a loss. Fortunately we did the opposite taking another long position in the SP500 ETFS because my market internal indicators, market breadth and simple trading strategy clearly pointed out that the average investor was trying to pick a top by shorting the market. As we all know, the market is designed to hurt the masses which is why I focus on the underlying trends, price action, volume and market sentiment for timing trend changes.

That being said, I still think the market could grind higher and make another new high. But any rally or new high will most likely get stepped on with heavy selling. Expect strong selling days followed by a couple days of light volume sessions where the price drifts back up into resistance levels. This could take a week or two to unfold so don’t jump the gun and short yet. It’s best to see more distribution selling before picking a top.

If you like this trading reports or if you would like to get my daily pre-market trading videos, intraday charts, updates and trade alerts be sure to join my newsletter: http://www.thegoldandoilguy.com/trade-money-emotions.php

Chris Vermeulen