Posts

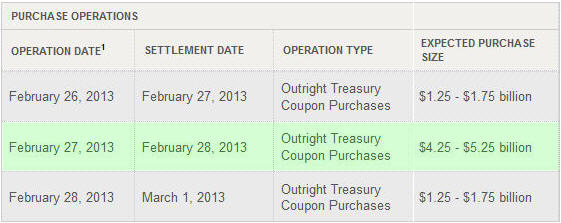
Since the middle of April everyone and including their grandmother seems to have been building a short position in the equities market and we know picking tops or bottoms fighting the major underlying trend is risky business but most individuals cannot resist.

The rush one gets trying to pick a major top or bottom is flat out exciting and that is what makes it so darn addicting and irresistible. If you have ever nailed a market top or bottom then you know just how much money can be made. That one big win naturally draws you back to keep doing it much like how a casino works. The chemicals released in the brain during these extremely exciting times are strong enough that even the most focused traders fall victim to breaking rules and trying these type of bets/trades.

So if are going to try to pick a top you better be sure the charts and odds are leaning in your favor as much as possible before starting to build a position.

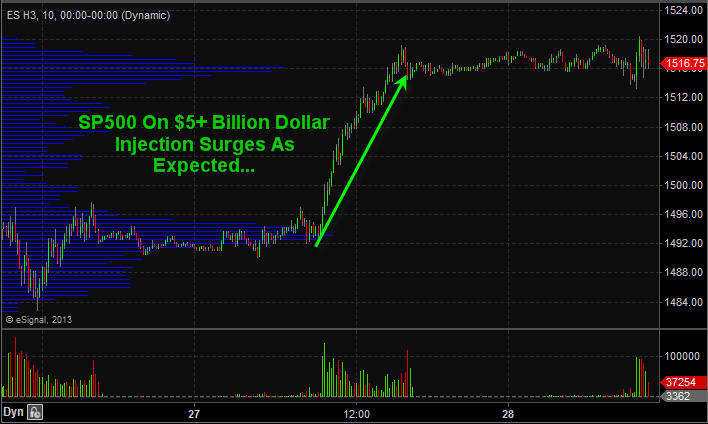
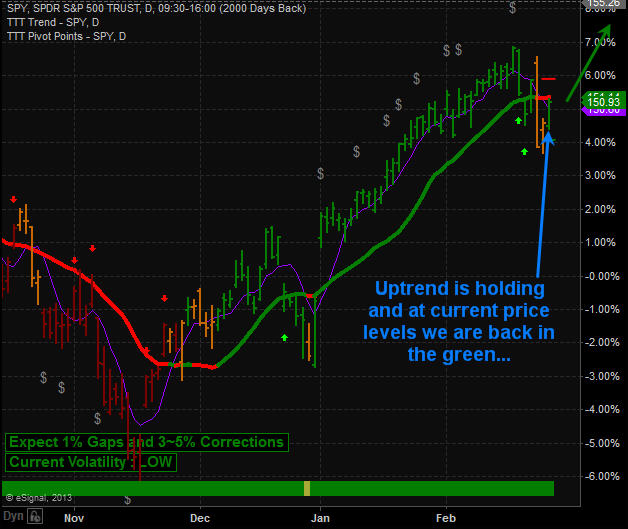
Below are a few charts with my analysis and thoughts overlaid showing you some of the things I look at when thinking about a counter trend trade like picking a top within a bull market.

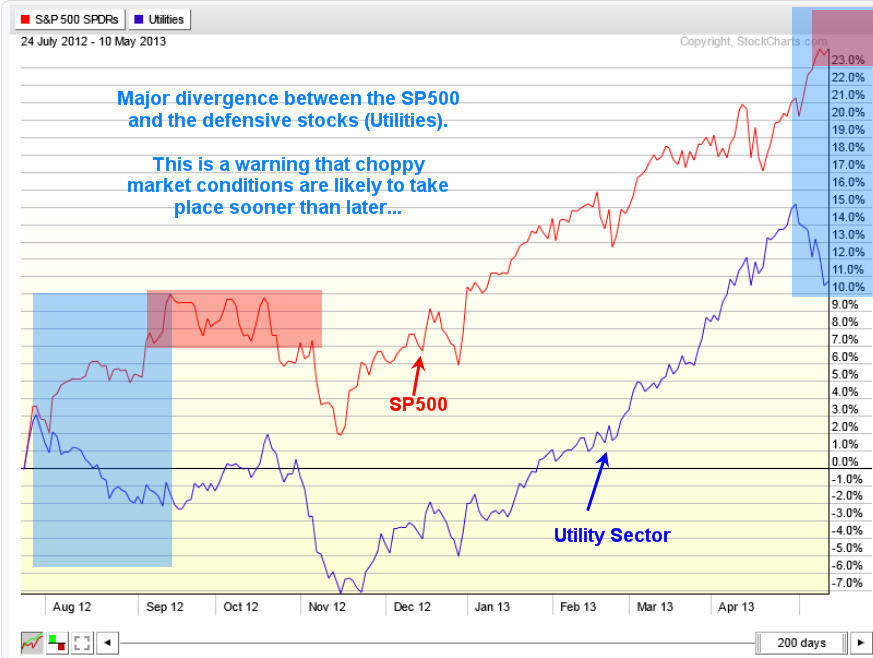
Utility Stocks vs SP500 Index Daily Performance Chart:

The SPY and XLU performance chart below clearly shows how the majority of traders move out of the slow moving defensive stocks (utilities – XLU) and starts to put their money into more risky stocks. This helps boost the broad market. I see the same thing in bonds and gold this month which is a sign that a market top is nearing.

That being said when a market tops it is generally a process which takes time. Most traders think tops area one day event but most of the times it takes weeks to unfold as the upward momentum slows and the big smart money players slowly hand off their long positions to the greedy emotion drove traders.

Look at the chart below and notice the first red box during September and October. As you can see it took nearly 6 weeks for that top to form before actually falling off. That same thing could easily happen again this time, though I do feel it will be more violent this time around.

SPYXLU


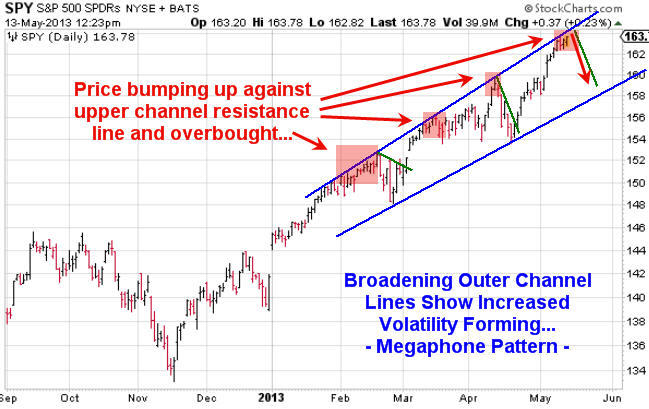
SPY ETF Trading Chart Shows Instability and Resistance:

Using simple trend line analysis we see the equities market is trading at resistance and sideways or lower prices are more likely in the next week or two.

SPYResistance


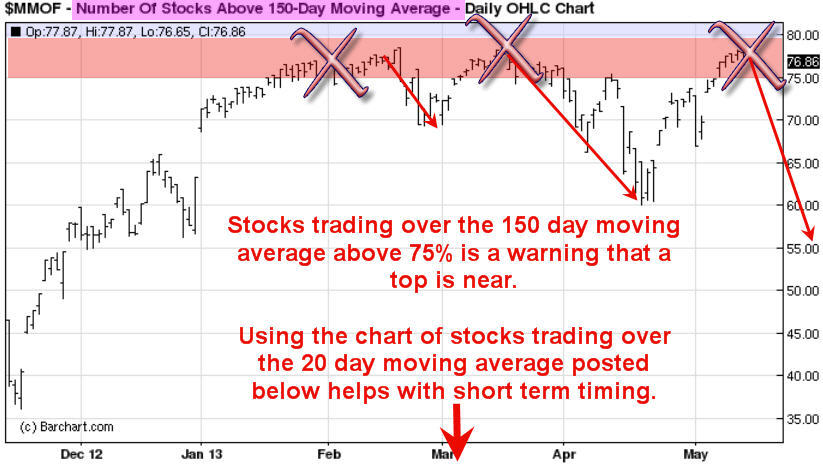
Stocks Trading Above 150 Day Moving Average Chart:

This chart because it’s based on a very long term moving average (150sma) is a slow mover and does not work well for timing traded. But with that said it does clearly warn you when stocks are getting a little overpriced and sellers could start at any time.

General rule is not to invest money on the long side when this chart is above the 75% level. Rather wait for a pullback below it.

BarC150


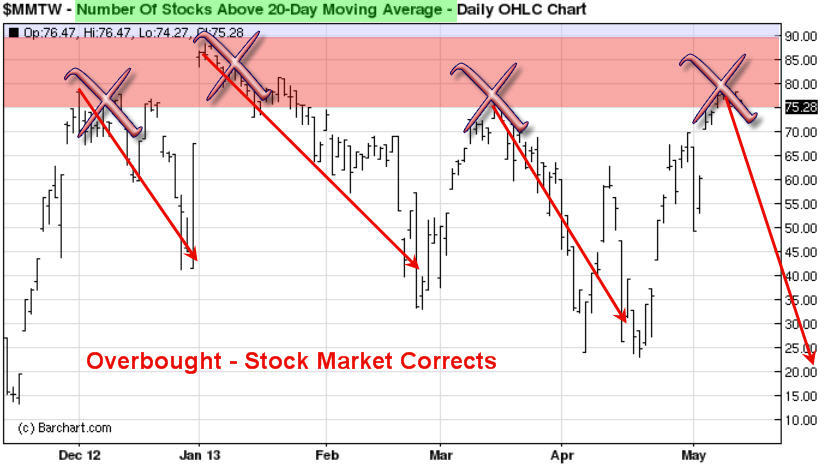
Stocks Trading Above 20 Day Moving Average Chart:

This chart is based on the 20 day moving average which moves quickly. Because it reacts quicker to recent price action it can be a great help in timing an entry point for a market top or bottom. It does not pin point the day/top it does give you a one or two week window of when price should start to correct. You can view this chart below live but without my analysis here: http://www.thetechnicaltraders.com/stock-market-momentum/

BarC20


How to Spot and Time Stock Market Tops Conclusion:

As we all know or will soon find out, trading is one of the toughest businesses or and one of the most expensive hobbies that one will try to master. Hence the 95-99% failure rate of individuals who try to understand how the market functions, position management, how to control their own emotions and to create/follow a winning strategy.

With over 8000 public traded stocks, exchange traded funds, options, bonds, commodities, futures, forex, currencies etc… to pick from its easy to get overwhelmed and just start doing more or less random trades without a proven, documented rule based strategy. This type of trading results in frustration, loss of money and the eventual closure of a trading account. During this process most individuals will also lose friends, family and in many cased self-confidence.

So the next time you think about betting against the trend to pick a top or a bottom you better make darn sure you have waited well beyond the first day you feel like the market is topping out. Stocks trading over the 150 and 20 day moving averages should be in the upper reversal zones and money should be flowing out of bonds and other safe haven/defensive stocks to fuel the last rally/surge higher in the broad market.

Also I would like to note that I do follow the index futures and volume very closely on both the intraday and daily charts. This is where the big money does a lot of trading. Knowing when futures contracts are being sold or bought with heavy volume is very important data in helping time tops and bottoms more accurately. And the more experience you have in trading also plays a large part in your success in trading tops and bottoms.

Download my FREE eBook on Controlling Your Trades, Money & Emotions: http://www.thegoldandoilguy.com/trade-money-emotions.php

Chris Vermeulen

This week I talked about how the uptrend is to be the focus of trading positions until a down trend is actually confirmed via price and volume action. The SP500 was very close to reversing down this week but with the POMO’s (permanent open market operations) scheduled largest injection of money for February of over $5 billion dollars sent stocks soaring jamming stocks back up into its uptrend.

Take a look at the normal daily injections and then look at Feb 27th’s….

pomo2


SP500 Futures 10 Minute Chart Zoomed Back 48 Hours…

MarketPomoPush


SP500 Trend – Green, Orange, Red candles indicate trend direction

PomomSavesUpTrend


Short Term Trading Conclusion:

Following the bigger underlying trend of the market along with the big money will keep you on the right side of the market more times than not. My trading strategy which is now programmed into my trading system clearly tells me the current market trend, entry signals, profit taking, stop adjustments and exit prices.

Creating a proven trading strategy which works in all market conditions and having it programmed to do 95% of the analysis for you keep my trading emotions in check, saves me time and money and keeps things simple which is the key for long term success. So keep your eye on the POMO’s injection schedule each month for days to focus on long day trades or entry points for swing trades.

Receive Free Weekly Reports, Trading Tips and my Book: www.GoldAndOilGuy.com

Chris Vermeulen

The stock market is at a very critical pivot point which I feel will generate opportunities in December and for the first quarter of 2013.

Trading with the trend is not always an easy task. It is human nature to predict and jump to conclusions and usually it’s better to trade with the trend no matter what your emotions are telling you. The current trend is down and I stick with that until we are proven wrong.

If you carefully analyze the charts below you will understand where we are trading in the market and what the risks are at this point. The question is are in the middle of a trend reversal back up, or is this just a bounce within a down trend? Either way, any pullback this week should be aggressively managed to lock in gains and tighten stops because it could go either way and you do not want to be on the wrong side of the table.

The chart below shows the US dollar index 4 hour chart. It looks as though we should start to see a bounce this week and that should put pressure on stocks and commodities.

The SP500 (SPY etf) below that shows my analysis and key price levels. I took a short position on the SPY Friday afternoon as I feel a pullback is imminent. That being said, all I need is one big down day and I will be pulling money off the table to lock in gains and tighten my stop.

If a detailed educational lesson on stock market cycles read my mini course here: http://www.thegoldandoilguy.com/downloads/COAAROTB.pdf

Dollar Index and SPY ETF Trading

My trading charts make reading the market simple, quick and precise so if you want this type of analysis and trade ideas delivered to your inbox every day including my Pre-Market video analysis then join my newsletter here: www.TheGoldAndOilGuy.com

Chris Vermeulen

Everyone knows people make mistakes when rushed to do something or if they are scared of something bad happening. We also know fear and greed is what moves the market each month, week, day and tick… So when the majority of investors are selling their shares at the same time you must recognize the psychology behind it and prepare for a low risk trading opportunity in the days that follow.

Stepping back and looking at the general vibe in the financial arena we hear about Quantitative Easing II coming to an end which should help the dollar gain strength again. A rising dollar means lower stock and commodity prices. Also keep in mind the United States is in so much trouble they will always have quantitative easing even if they are not calling it QE, that’s my opinion anyways…


In addition, everyone was talking about the saying “sell in May and go away”. Take a look at the chart of the SP500. The first session in May was the highest point and the SP500 has only gone down since then. The chart below shows my fear indicator and with the masses all selling in the month of May I have to think it’s getting ready to bottom and start another 5-6% rally from down here. Keep in mind I am more neutral on the overall market for the longer term. In the next month or two I figure we see higher prices from here but come August we could see the dollar bottom and stocks sell off in a more significant manner.


Last but not least, gold and silver…
Looking back in time and reviewing inter-market relationships with gold and silver I feel more and more investors are becoming bearish and moving their money into safe havens like gold and silver. Recently we saw a sharp pullback in both gold and silver. The price and volume action that took place was a clear sign of distribution selling meaning big money players taking money out of those investments. I see this pattern happen in stocks, indexes and commodities all the time and it generally warrants caution!

My trading buddy JW Jones over at OptionsTradingSignals.com has some very exciting ways to profit from these choppy market conditions with limited risk. If you are into options then check it out.

Typically we will see a few more new highs being reached which are quickly followed with strong selling. What happens is that the big money players allow the price to make a new high and that hits the headline news, CNBC, BNN etc…. drawing in new buyers and a surge of volume for the big money guys to sell into and exit their positions at the top. It also helps cover up their large volume selling.

Below is what I am thinking will take place in gold this summer.


Weekend Trend Conclusion:
In short, I feel the dollar will continue to slide lower, both stocks and commodities should have some strength over the next 1-2 months but after that all bets are off and it will be time to re-evaluate things.

The next week in the market will most likely make or break this outlook as the overall market is trading at a tipping point. Let’s see how this week pans out then take another look at the charts.

Get my trading reports free each week here: www.thegoldandoilguy.com/trade-money-emotions.php

Chris Vermeulen

Over the past couple months everyone seems to have been preparing for a sharp market correction. Crazy part is that the SP500 dropped about 10% from the high and that is a typical bull market correction. The thing is… the stock market has a way of slowly unfolding making it look and feel minor, then before you know it, the correction is over and it’s back to an uptrend. That is kind of how this one unfolded.

The good news is that we caught the low risk portion of the correction locking in a 4.5% drop, and we are now in a long trade and in the money by 2.5% with very little down side risk at this point. Time will tell if this up trend is sustainable or not…

Now, let’s take a look at the charts…

Dollar 60 minute intraday chart
As you can see below the dollar looks to have started a breakdown today. If there is continued selling pressure in the next couple days then expect to stocks and commodities to move higher as the US Dollar drops. It is important to know that when a bullish pattern fails we typically see a very strong reaction in the opposite direction (down) catching the majority off guard and they rush to the door.

SPY Broad Market ETF – Daily Chart
A couple weeks ago we watched the market go into a free fall creating a washout bottom. From there we saw prices bounce back and retake my key moving averages. This gave us a bullish bias and dips should be looked at as buying opportunities. I will admit that stocks still have a long way to go before the masses are convinced. I feel we need to see the February and March highs get taken out first. Once they get taken out there should be strong buying as short covering (protective stops from traders who are short) causes a surge in buying pressure sending stocks sharply higher yet again.

My trading buddy David Banister at Active Trading Partners is starting to see small cap stocks come back to life. Money is starting to flow into these lucrative areas of the market and he is on top of things… This week’s trade is up 20% in less than 24 hours which is very exciting.

Gold Daily Chart
Gold has been moving up this year but the current price action is not really getting me excited to buy just yet. Recently we have seen strong selling volume and very light buying volume. My bias still favors higher prices but there is still a good chance we get another dip in the coming sessions.

Mid-Week Trading Conclusion:
In short, I feel as though the dollar will trigger the next wave of buying in stocks and commodities for the next week or two… We should see the dollar make a clean moving in either direction shortly and that will help guide my analysis, positions and setups. I hope this analysis helps you to see the market from a different perspective.

If you would like to get my mid-week reports free please join my free newsletter here: http://www.thegoldandoilguy.com/trade-money-emotions.php

Chris Vermeulen

Sunday Aug 29th, 2010
Last week was a relatively strong week for stocks and commodities. Although the SP500 closed slightly lower on the week the price action Friday was strong. The recent pop in commodities has everyone feeling good and bullish again and we all know how the market works… When everyone is feeling good the market has a way of shaking things up.

Below are a few charts showing heavy volume resistance levels that will most likely cause the broad market & commodities to pullback or trade sideways for a few days as buyers and sellers play tug-o-war.

SLV – Silver Bullion ETF Trading

Silver had a very nice pop last week but if you step back and look the recent price action you can see that it’s still trading below the previous major bounce from back in June. It looks as though silver is a little over extended as large percentage moves tend to give back 25-50% of the mover shortly after.

Take a look at the price by volume bar. It shows there has been heavy volume traded at that $19.00 level and the previous time it was reached sellers stepped back in pulling silver down.

GLD – Gold Bullion ETF Trading

Gold is trading deep into the resistance level and struggling to hold up. Last week we went long GLD after the bullish engulfing candle and took profits near the high two days later on Thursday’s price. Although gold is trading at resistance the intraday price action remains somewhat bullish/neutral for the time being.

USO – Oil ETF Trading

The oil ETF broke down from its large multi-month bear flag and is now bouncing up to test that breakdown/resistance level. This could be a possible kiss good bye. I will keep my eye on this commodity as it could provide us with a great shorting opportunity in the coming days.

SPY – SP500 ETF Trading

The equities market has been tried to bottom all week and Friday’s price action looks strong. While the chart looks strong the market internals are telling me the opposite. Last week we saw a gap down and Friday that gap window was filled. With heavy volume resistance just above the current price the odds are pointing to lower prices.

Weekend Equities and Commodities ETF Trading Report:

In short, it looks as though everything is trading just under or at resistance levels. That means sellers will start to enter the market and cause prices to stall (trade sideways/choppy) and or reverse lower.

That being said, with Friday’s strong close for oil and the sp500 I am expecting a gap higher in the morning because traders will review those charts this weekend and enter the market Monday feeling bullish.

If you would like to get my ETF Trade Alerts for Low Risk Setups checkout my service at: www.TheGoldAndOilGuy.com/specialoffer/signup.html

Chris Vermeulen

The market continues to whipsaw traders out of positions as volatility rises. I have put together a few charts to show you where each of our commodities are trading along with the SPX (SP500 index).

My Gold Stock Breakout Model – Monthly Chart
I use this chart to keep my big picture trades on the right side of gold. I found that gold stocks tend to lead the price of gold so watching this gold stock index on the monthly, weekly and daily charts can provide me with short term tops and bottoms for trading gold bullion, GLD or DGP exchange traded funds.

The monthly chart clearly shows the rally in stocks has now sold back down to my resistance trend line. If we do not get a rally this week in gold stocks, then I think we could see gold trade sideways or down for several months.

HUI Gold Stock Newsletter

HUI Gold Stock Newsletter

GLD Gold ETF Trading Fund – Newsletter
The daily gold bullion fund shows the recent price action and what I think could happen in the coming weeks. In the past couple days gold has moved to a short term support level where I think we could see buyers step in.

We took some profits near the high and continue to hold a core position until we have another technical breakdown or new setup to add more to the position again.

GLD Gold ETF Trading Newsletter

GLD Gold ETF Trading Newsletter

SLV Silver ETF Trading Fund – Newsletter
Silver is in the same boat as gold. We have taken some profits and are still holding a core position with protective stops in place just incase the market does head lower from here.

Silver SLV ETF Trading Newsletter

Silver SLV ETF Trading Newsletter

USO Crude Oil Trading Fund – Newsletter
Crude oil started to bleed lower last week as the price sliced through the multi month support trend line. Volume shot up as stop orders get triggered on the way down. We finally have a move outside of the pennant formation that has been in place for several months. Now we can start looking for a low risk setup for trading crude oil again.

Crude Oil USO Trading Newsletter

Crude Oil USO Trading Newsletter

UNG Natural Gas Trading Fund – Newsletter
Natural gas has really come back to life. I mentioned on September 2nd that natural gas (UNG) looked like a buy between $9 – $9.50 and it has now rallied 25% since that point. But stepping back and looking at the chart we can see resistance is hovering over head between the $12 – $12.25.

I may send out a setup for a short play if we get one but I feel the heavy sell off in August was the final wave down, flushing out traders. Speculative traders seem to have moved into natural gas and I think they will continue to buy it for some time. Pullbacks will be sharp but most likely followed with more buying as we enter the cooler months of the year.

Natural Gas UNG Trading Newsletter

Natural Gas UNG Trading Newsletter

SPX Index Trading – Active Trading Partners
I thought that I would show a quick picture of the SPX because it shows the psychology of traders and how it repeats it’s self over and over. The black and green waves are virtually the same patterns.

I feel as though the market is ready for a larger pullback than what we had in June/July but my focus will be to buy in the oversold dips and lighten my positions in overbought conditions (scaling in and out of positions) until the trend confirms it has reversed.

SPX SP500 Trading Newsletter

SPX SP500 Trading Newsletter

My Market Trading Newsletter Conclusion:
Gold stocks are pulling back and precious metals continue to move with the overall market action. I do feel that gold and silver will break this relationship and start to move higher in the coming months but until that happens I remain cautious with my positions tightening my stops.

Crude oil is starting to come alive and I am now looking for some low risk setups for energy related funds. Last week’s technical breakdown could provide us with a big move in the coming months.

Natural Gas continues to hold up but is now trading near resistance. Depending how many spec traders there are still lingering around (as most lost their shirts in the recent months), will dictate how much higher natural gas will move. The 25-30% rally in the past month has been very powerful and this could be just the beginning. I am now waiting for another setup that could be a long or a short trade depending on what happens next.

If you would like to get my Bi-Weekly Trading Reports via email please visit my websites at: www.TheGoldAndOilGuy.com for commodities and www.ActiveTradingPartners.com for Stock Trading.

I hope everyone had a great weekend!
Chris Vermeulen