Posts

May 2, 2010
The past couple weeks we have seen sellers control the price of gold. This can be seen on the charts by the light volume drifts up then heavy volume sell selling sending this metal sharply lower. This type of price action provides some excellent intraday shorting opportunities.

On the other hand the SP500 has been doing quite the opposite providing some very profitable intraday buying opportunities for those who have the time to trade during the day.

Below I show a couple of low risk intraday trading opportunities which lasted a couple days providing massive gains, tiny down side risk and immediate price action. But what I think is about to happen in the next week or so will turn the tables with gold providing great buying opportunities and the SP500 with some great shorting opportunities, opposite to what is happening now.

Two Shorting Opportunities in Gold Making 210% Return in 3 Days

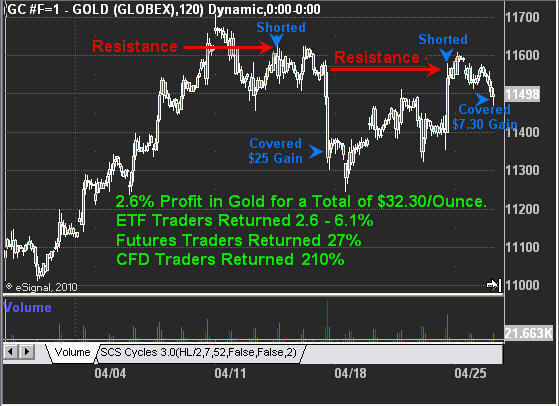
The fist two weeks of April gold had formed an excellent mini head & shoulders topping pattern. This is a pattern which I find very profitable when trading the intraday charts.

The first chart is of the 2 hour intraday gold chart spanning 25 days. On this chart gold had formed a mini head & shoulders topping pattern which day traders were able to take advantage of with very little risk.

Once the first wave of selling was finished and gold reached our price target of $1134, we exited our position and waited for another intraday setup. It was only a couple days later when gold has setup for another opportunity to short which an even more potential than the first trade as it had the possibility of dropping to the $1115 level. This would have provided a $40 move in gold washing the market of weak positions setting itself up for another big rally.

Our first price target was reached at $1147.7 where we took some profits and moved our stop to break-even (our entry price) for the balance of our position. Doing this guarantees the trades will be a winner no matter what happens. As you can see on the chart depending what investment type you trade you would have earned 2.6% – 210% return on your investment.

Gold Short Intraday Trading

Gold’s Surprise Rally – Spain Was A Pain

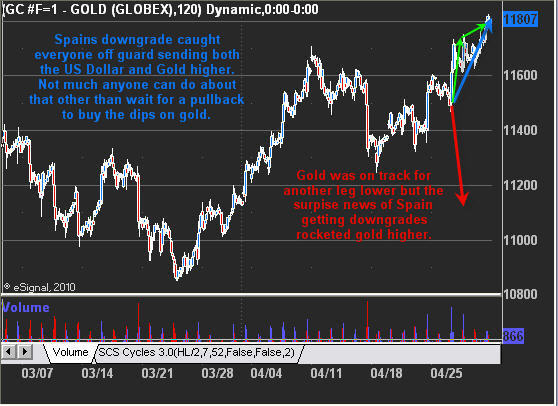
Last week Spain was downgraded causing large selling pressure on the Euro as everyone sold the Euro and moved their money into a safer investment like the US Dollar and Gold. This sent both dramatically higher at the same time. The chart below shows the same 2 hour chart of gold but is zoomed out so you can see farther back and also the most recent rally in gold.

The red arrow on gold shows where gold was most likely to go in the coming days, but instead it rocketed higher on the Euro-land news hitting the wires. Most of the price advance happened within the first 4 hours and since then the price has drifted sideways and grinded its way a little higher.

Gold Surprise Rally

SP500 Buying Opportunity Makes 135% Gain in 3 Days

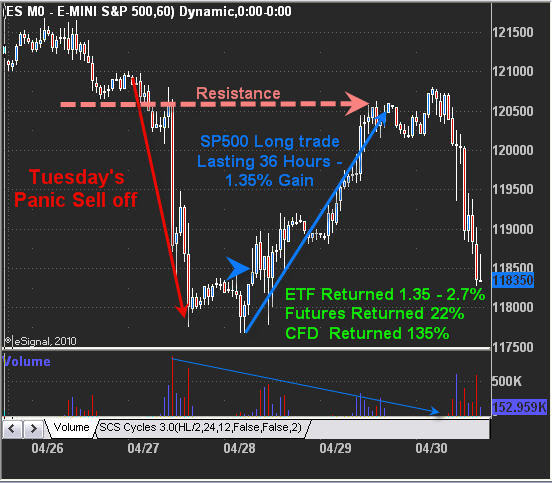
During the day on Wednesday I had low risk entry point for day traders on the SP500. The setup is simple really. Tuesday’s panic selling sent the market tumbling in a very short period of time putting the market in an oversold condition. A condition like this provides excellent low risk/instant price movement type of setup.

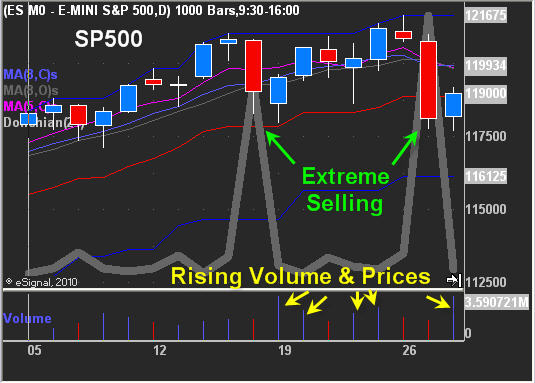
Take a look at the volume on the chart… Volume on the ES Mini SP Futures contract was not very heavy during the sell offs. But the days following shows strong buying volume indicating big money was buying up stocks at these discounted prices. This is great to see.

ES Mini Trading Strategy

60 Minute SP500 Trading Chart

As you can see from the chart below Tuesday’s heavy volume sell off was an almost straight drop. That type of move generally provides a trad-able bounce or drift higher within a few days which tests the level were prices started to drop originally (the breakdown level).

The price of the SP500 drifted up into resistance with declining volume meaning traders are not willing to pay the higher price for the index. This is a sign of weakness and worked out perfectly with our price target of $1205-1206 at which point we took money off the table and moved our stop up to lock in some solid gains if the market did in fact reverse back down after reaching the key resistance level.

SP500 Day Trading Strategy

Gold & SP500 Trading Conclusion:

Some very exciting times lie ahead as I feel gold and the SP500 are changing short term trend directions. Gold which was down the past month is now headed higher as we are looking for low volume pullbacks to take long positions.

And the SP500 looks ready to take a swan dive to correct/digest some of the monster rally it has put in since the February low. With any luck we will get a nice shorting opportunity to catch some of the move down and then we should be setup for another large rally.

In short, we are looking for gold to dip to enter long and the SP500 to breakdown this week then form a low volume bounce/drift into a resistance level which we will try to short once the bounce loses its upward momentum. I feel we will have a bunch of day trades in the near future along with some great swing trades at the key turning points.

Get My Gold and SP500 ETF Swing Trading Signals: www.TheGoldAndOilGuy.com
My Intraday, Swing Trades and Trading Strategy: www.FuturesTradingSignals.com
You can also Trade Explosive Stocks with me at: www.ActiveTradingPartners.com

Chris Vermeulen

Disclaimer: I currently do not own gold and SP500 ETFs or Futures contracts.

Last week was exciting as we saw stocks and gold close above the February highs which confirms we are in a new up trend. The question everyone is wondering is:
.

How far will this market go before rolling over?

This is a tough question but we can get a good feeling about the risk and if it’s worth putting money to work or not at this point. Here are my quick points and thoughts about the stocks indexes at the current price (March 5th closing price).
• The market is extremely overbought on the hourly and daily charts. Buying here is just chasing prices around, and that is a net losing game.
• Small Cap stocks have been on fire making a new higher for the year. This is very bullish but again buying here carries too much risk because after such a sharp price appreciation, we can see it all be given back just as quick.
• Volume over the past three weeks has been below average and when I see higher prices on declining volume I expect prices to drop very quickly once the thrust upwards ends.
.

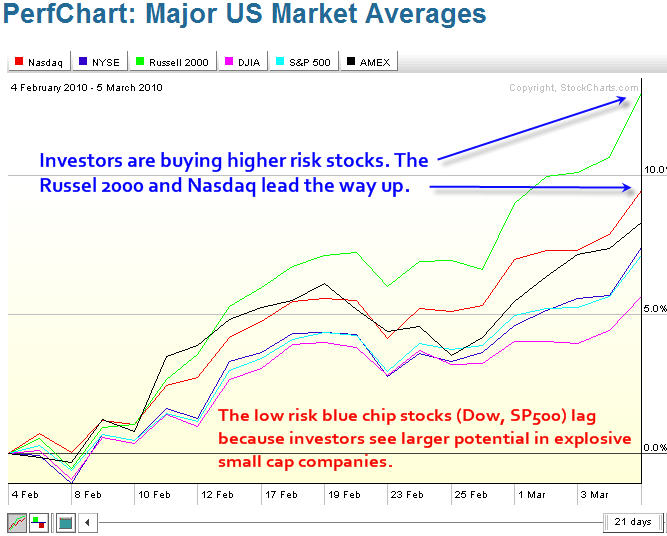
Stock Market Indexes – 21 Trading Days
Here is a simple chart showing the past 21 trading sessions. It compares the Nasdaq, NYSE, Russell 2000, Dow Jones, SP500, and Amex indexes.

As you can see the Russell 2000 (small cap stocks) and Nasdaq (tech stocks) have been on fire the past couple weeks while the solid large cap stocks lag.

.
Are The Small Caps Stocks Telling Us Something?
Its means investors and traders are confident enough to buy higher risk companies. This is good for the overall market because small cap stocks tend to lead the market in both up and down trends. What has me concerned is the low volume rally, which I don’t like.

One thing to note is that small cap stocks tend to do well during times when the US Dollar is rising. This is because they are not multinational dealing with currency exchange. So this small cap stock rally has me wondering if the US Dollar is about to continue its up trend or if investors really are comfortable with buying riskier stocks?

.
.

GLD Gold ETF – Daily Chart
Gold gained some ground last week but the majority of the money seemed to flow into small cap stocks. But take a look at this bullish chart.

This is a text book bull flag pattern complete with and ABC retrace, trend line break, and reversal candle off of a support zone. I am bullish on gold long term but think we could see prices rise a couple percent from here but will trend sideways/down for the next 2-3 weeks to digest the recent move up.

.
.

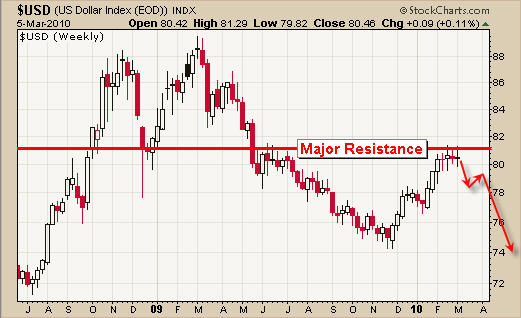
US Dollar Index – Weekly Chart
I have posted this chart several times in the past few months with 83 being a key resistance level. The dollar’s recent price action is very bullish and it is flagging just under this key resistance level. I feel the price is heading lower from here but only time will tell. A breakout to the upside will put a lot of pressure stocks and precious metals.

.
.

Weekend Trading Conclusion:
Last weeks strong rally into the close will most likely carry over into Monday and possibly Tuesday. The reason being is simply because retail traders and investors (John Doe’s) get excited when they see higher prices, thus it attracts more money into the market.

In short, I feel the market is overbought. All indexes are trading at resistance other than the Russell 2K index, and volume is below average. I am going to wait and see how things unfold this week before thinking about getting committed to any more long positions. If anything I will be looking to short the market using the intraday charts for a quick trade. Again low volume rallies that are overbought tend to snap back very quick on an intraday time frame providing a 1-4 hour trade.

Get My Free Weekly Trading Reports:

Chris Vermeulen
www.TheTechnicalTraders.com

Commodities have and continue to be a fantastic trading vehicle for those who can stomach volatility. After last year’s market crash most commodities pulled back to normal if not lower than normal trading ranges. This allowed us to enter the market at 10+ year lows for natural gas.

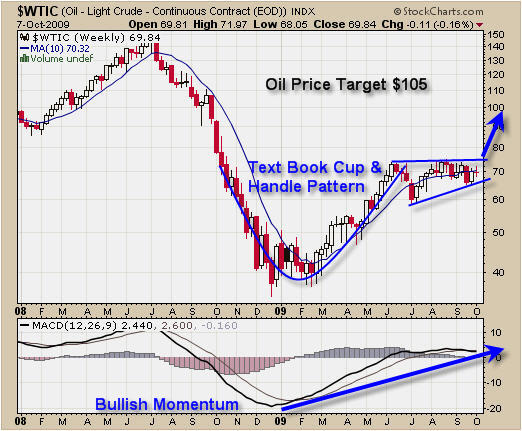
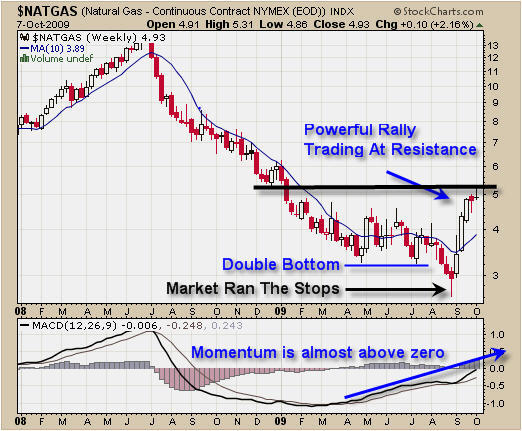
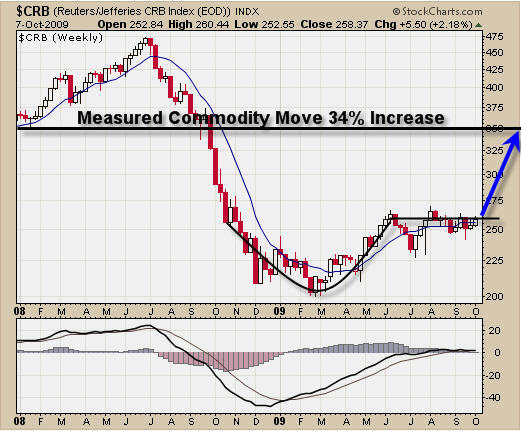
If we look at the weekly chart for gold, silver, oil, natural gas and the CRB commodity index we can see that commodities in general look ready to skyrocket higher approximately 34% on average in the next 4-12 months.

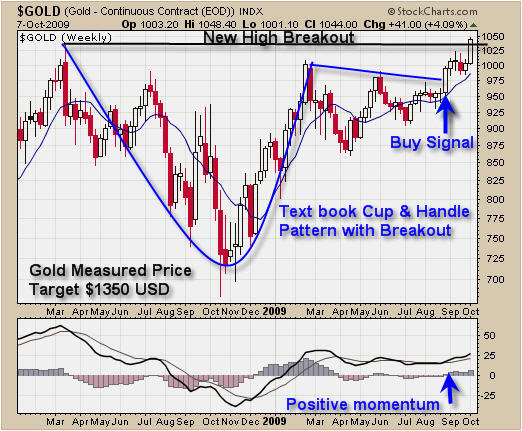
Take a looks at this chart of gold. While this chart shows the basic technical analysis of the price of gold you can see the completion of the Cup & Handle pattern which is VERY BULLISH. Also you can see gold broke to a new high. While I don’t like to trade new highs it’s hard not to want to buy into this breakout. Most traders should be long gold already, but if you are not, you have a couple of options. Buy into this breakout with a tight stop or wait for a pullback and buy on a test of the breakout. Personally I am waiting for a pullback (test of breakout) before I add more to my position.

Trade Spot Gold

Trade Spot Gold

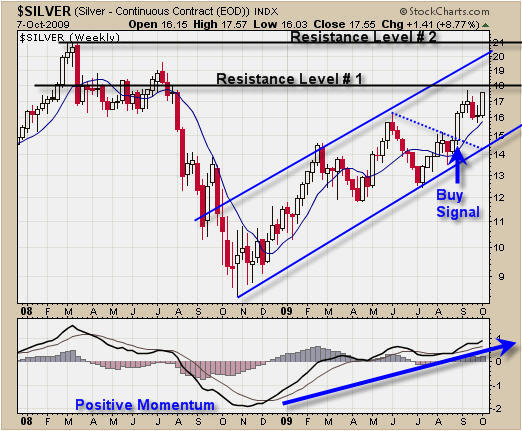
Silver has been strong but has not held up its value as well as its big sister (gold). As you can see silver must break through two more major resistance levels before making a new multi year high. Overall silver still looks strong and I will be waiting for a low risk setup for us to add more to our positions.

Trade Spot Silver

Trade Spot Silver

Crude Oil looks like a perfect Cup & Handle pattern and I am now looking for a low risk entry point which should form before we get a breakout it to the up side. I can see oil quickly moving to the $100 per barrel level once we get a breakout.

Trade Crude Oil

Trade Crude Oil

Natural Gas had a perfect shakeout in August and many aggressive traders who follow these reports followed my lead and bought natural gas around $2.90 (10 year lows). This was the move I wrote about for nearly 3 months as we waited for it to unfold. Down side risk was around 15% so it was not my signature low risk setup but this rally has been exciting. Currently natural gas is trading at resistance and taking some money off the table is a great play here. You will never go broke taking profits.

Trade Natural Gas

Trade Natural Gas

The CRB Index looks very similar to crude oil. Overall commodities look to be in the final stages of basing (bottoming) and from simple technical analysis the next more could be around 30-34%.

CRB Index

CRB Index

Commodity Trading Conclusion:
Overall commodities look like a great buy. We are seeing precious metals moving up strongly and gold making a new high which is very exciting as our golden rock stock plays push higher and our commodity ETF play continue higher as well.

Energy is a mixed bag. Oil looks bullish and ready for a nice rally, while natural gas looks a little top heavy as it trades just under resistance.

We continue to stay in the market and are waiting for another round of low risk setups which could happen in the next few days if we get favorable price action. Remember to move your stops up to lock in gains. There is nothing worse than giving back a large portion of your profits when you don’t need to.

If you would like to receive my free weekly trading reports please fill out this form:


First Name:
Email:


Chris Vermeulen