There have been some major trend changes recently and it looks as though more investments are about to follow. The real question though is… Are You Ready To Take Advantage Of It?
It has been an exciting ride to say the least with the equities and metals bull market and the plummeting dollar. But it looks as though their time is up, or at least for a few weeks. Traders and investors will slowly pull money off the table to lock in gains or cut losses and re-evaluate the overall market condition before stepping back up to the plate and taking another swing.
Below are a few charts showing some possible money making trade ideas in the weeks ahead.
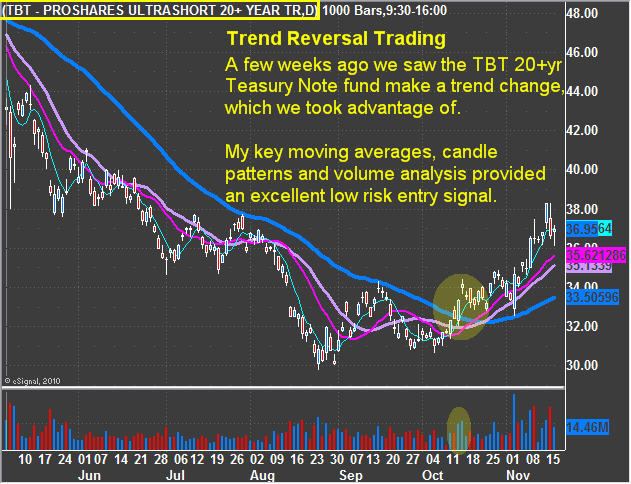
TBT 20+ Treasury Note Inverse Fund
This fund moves inverse to the price of the 20yr T.N’s also known as bonds. Looking at the chart you can see the recent reversal which took place. We had a great entry point shortly after this reversal took place using my low risk setup strategy.
Falling bond prices are considered to have a negative impact on equities because it implies that interest rates may start rising which means more investors will pull money out of stocks and put that money into a safe interest earning investment. You will typically see bonds change direction before equities. That being said the chart below is an inverse fund, so when this bond fund goes up, it means actually indicates bond yields are falling. I will admit these inverse funds really throw my brain for a loop at time… I prefer the good old days, buying long and selling short… so simple and clean…
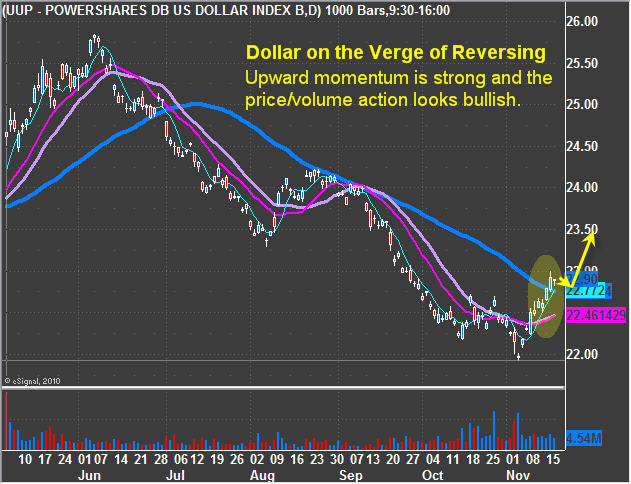
UUP – US Dollar Index Fund
This fund moves with the dollar and allows equities traders to take advantage of currency trading. This chart below shows a possible trend reversal for the dollar. If the dollar continues to rally then it’s also a good sign that interest rates could be rising in the near future and it also means more downward pressure on equities.
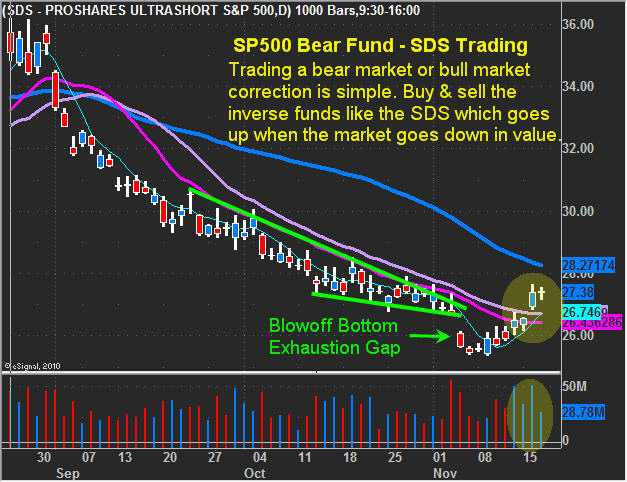
SDS – Inverse SP500 Index Fund
These bear funds make it possible for traders and investors to profit from a falling market using a regular buy and sell strategy. They can also be traded in retirement accounts making them a golden investment for those willing to play a falling market.
This chart moves the same as the SP500 index only flipped. As the SP500 falls this fund rallies.
The trading strategy we just used to play the recent rally is the same strategy we will use during a bear market, but instead of trading the SPY, we are trading this fund.
It is important to note that while bull market rallies tend to drag out; bear markets typically have faster movements. Fear is much more powerful than greed which is why the stock market drops quicker than it goes up.
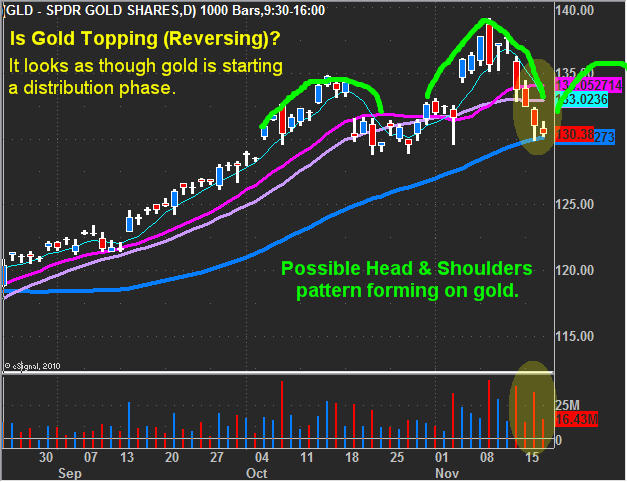
GLD – Gold Exchange Traded Fund
Gold also looks to be topping and could actually be starting to form a Head & Shoulders reversal pattern.
Mid-Week Trend Trading Conclusion:
In short, understanding inter-market analysis is crucial for traders/investors to know. Not understanding how they affect one other can be very costly in the long run. Remember that volatility and volume rise together at the end of a trend. You can view the recent volatility index (VIX) to see its price action also. Volatility changes also make for great low risk options trades if options are your thing. Focus on trading with the trend, bounces in a down trend are typically muted or trade sideways making is very difficult to make money buying in a falling stock market.
Get My Daily Pre-Market Trading Analysis Videos, Intraday Updates & Trade Alerts Here: www.GoldAndOilGuy.com
Chris Vermeulen


