Posts

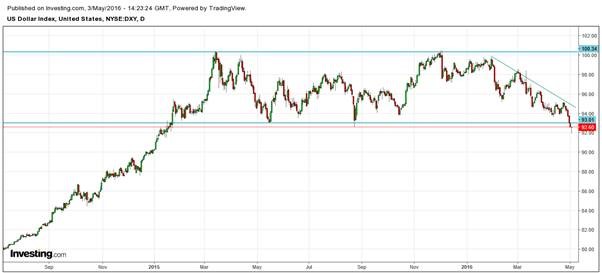
Traders who follow the price of gold and silver, should keep an eye out on the U.S. dollar index. The dollar has been within a trading range for more than a year. During December of 2015, the dollar rose to test the highs at 100, however, since February of 2016, the dollar has been in a downtrend, as shown in the chart below.

The FED has reduced the expectations of a rate hike in 2016 from one full percentage point, in the beginning of the year, to a half percent and perhaps to none at all. However, my expectation is that the FED may have to start rolling back this increase before the end of 2016.

The bullishness in the dollar was sparked by expectations of a change in the monetary policy of the FED. Market participants believed that the Zero Interest Rate Policy, NIRP, would end and that the rates were on an upward trajectory.  However, world economic conditions have deteriorated since the beginning of 2016 and the ECB and BOJ both responded with Negative Interest Rates, NIRP and more QE. Consequently, the FED was forced to delay their rate hikes.

Last week’s shot term breakdown of the dollar, below the critical support of 93, was a bearish sign which can bring the dollar further down to the 86 levels. But the dollar posted a solid rally by the end of the week to regain that critical support level for the time being.

price of gold dollars

Although gold is a commodity, it is used as a hedge against ‘uncertainties’ and ‘crisis points’ which gives it a different edge. Gold, also behaves differently because of its’ usage as money, as ‘a store of value’, for many centuries for both individuals and countries.

Due to the ‘meaningless’ monetary policies of the various global Central Banks, gold will follow its’ unique behaviour. I have explained this earlier and my models have been very timely in forecasting the turning points.

Gold will have a one-way move higher with many corrective phases on its’ impulsive new uptrend, therefore, I always keep my subscribers immediately informed so as they know when to make the next profitable trades of both gold and silver. The next trade I feel is just around the corner.

Follow My ETF Trading Alerts and Analysis: www.TheGoldAndOilGuy.com

Chris Vermeulen


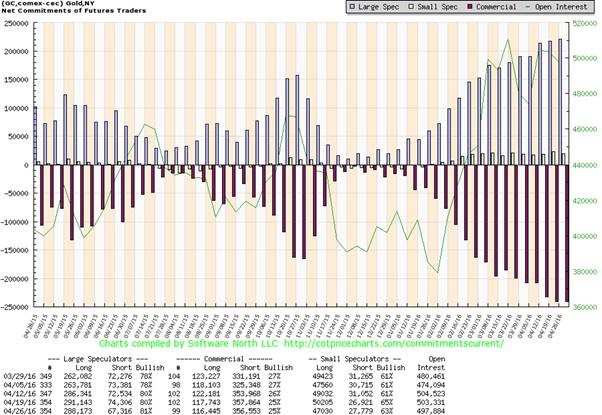
Price of Gold: The activities of the ‘commercial traders’ in the COT data is closely watched by the market participants, as they are believed to be the smartest of the lot.  They take deliveries on their bets, unlike the speculators, who have no interest in taking a delivery.

If you have followed the ‘commercial traders’, without paying attention to my proprietary predictive trend and cycle analysis for the price of gold and silver, you would be sitting on large losses, due to their ‘short positions’ which mean they expect price to move lower.

The ‘commercial traders’ ‘short positions’ are currently at record levels which are more than twice of that as compared to last years’ readings. Since the beginning of the second half of February of 2016, the ‘commercials’ have been increasing their short positions during the time that gold was closer to $1220/oz.

Price Of Gold
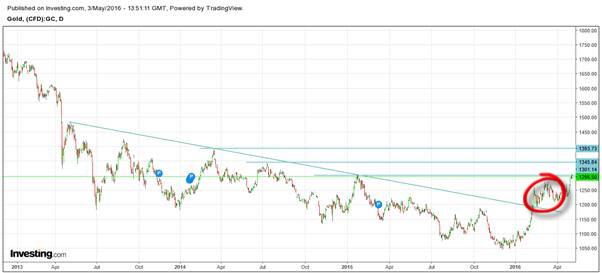
Daily Price of Gold Chart and Analysis:

However, if you have followed my recommendation, you would have maintained that once the price of gold crossed the $1190/oz. levels, it was destined to go higher.

However, the head and shoulder formation which developed after gold broke above the $1190 resistance trend line I did feel it would correct for a few weeks.

Instead, the price of gold did not correct, rather it consolidated with this what looked to be a head and shoulders pattern then broke out to the upside and rallied. Once a bearish pattern fails, it becomes very bullish which is what has happened in this case. I was quick to alert my subscribers to buy as soon as the pattern was broken and turned bullish.

However, the current price of gold at $1300/ oz. could offer some resistance, but the resolution of the trend in due time is going to be very strong. The pattern target of the current move is $1350/oz.

priceofgold

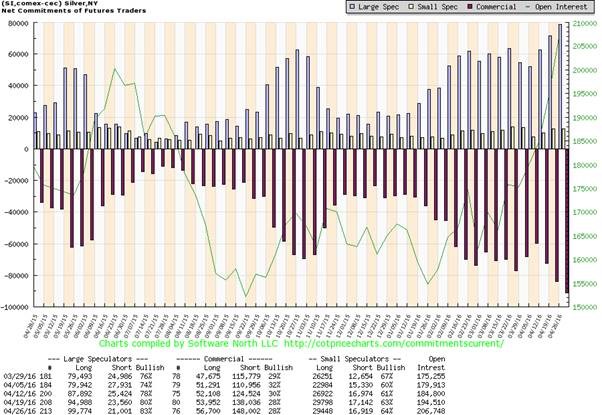
What about the ‘poor man’s gold’, Silver? 

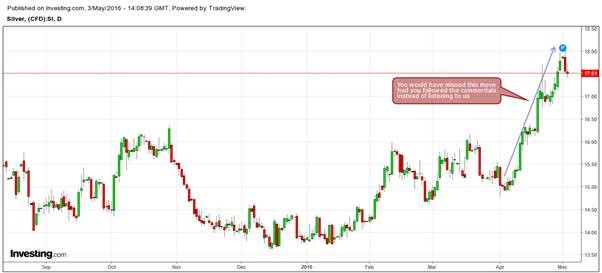
The chart indicates that in the last three weeks of April of 2016, the ‘commercial traders’ have added to their short positions continuously, however, they have been proven wrong once again with the breakout in silver returning 20% during the month of April of 2016.

Price Of Silver


Although we take note of the ‘commercial positions’, I strongly believe in my analytic models which have provided excellent returns, over many years.

Once above the $16/oz. levels, I have had no doubt that silver was ready for a sharp run-up. Therefore, I will be advising my private subscribers as to when to purchase silver, against the bias of the ‘commercial traders’ and I am confident that my subscribers will reap a windfall when the time is right.

 priceofsilver

Conclusion – Current Investment Strategy of the Mega-Rich


Do you really want to follow the ‘smart money’? Then follow the billionaires and the big banks as I have been doing.  Ray Dalio, the founder of Bridgewater Associates, manages the largest hedge fund, in the world. His fund manages over $160 billion in assets.  Today, his fund is bullish on gold.  He recently stated “if you don’t own gold there is no sensible reason other than you don’t know history or you don’t know the economics of it”.

Stanley Druckenmiller has been purchasing a large long-term position in gold.  He made an average of 30% of an annual return in his fund since 1986. So, what is he buying now?

He has an $880 million position in gold, right now. Do you think you should now be following the ‘really smart money’, today?

Follow the ‘smart money’! Gold is for the long-term investor, well looking forward 3-5 years at least.

Get My Daily Live Price of Gold Market Analysis, Forecast & Trade Alerts: www.TheGoldAndOilGuy.com

Chris Vermeulen
Recently business and financial guru Mark Cuban wrote an article about why this tech bubble is going to be worse than the tech bubble of 2000. This made me take another look at the long term charts again, but instead of looking up the NASDAQ or the tech sector I decided to check out gold mining stocks, gold price and the Dollar index.

From looking at the price action among the precious metals sector and the dollar it looks and feels like these markets are very close to repeating what happened in the year 2000.

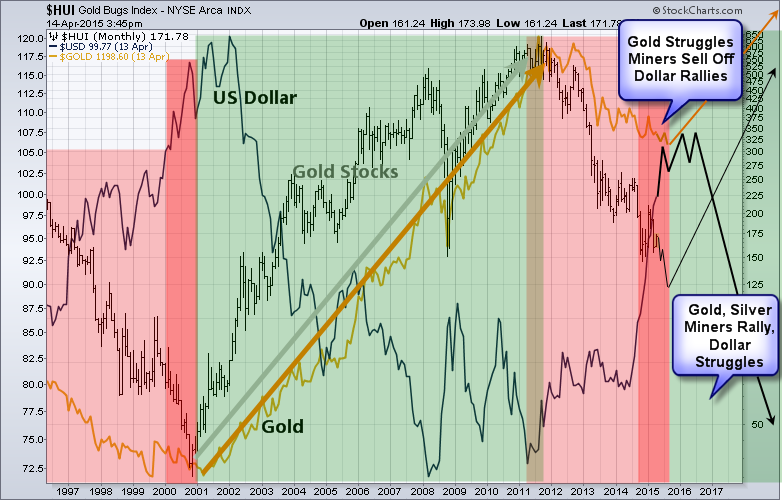
The chart below is a monthly chart looking all the way back to 1996. I have color coded areas of the chart that represent weak and strong times for the price of gold.

Gold Price

Gold Price

Key Points:

  1. The US Dollar is trading roughly at the same level and trending higher as it was in 2000.
  2. Rising dollar is neutral/negative on commodity prices and resource stocks like gold miners.
  3. Gold price struggled as the dollar rose in value.
  4. Gold stocks fell sharply during the last year of their bear market.
  5. Gold stocks bottomed before physical gold by several months.

 HOW YOU CAN PROFIT FROM GOLD PRICE THIS YEAR – BOOK/GUIDE

Concluding Thoughts on Dollar, Miners & Gold Price:

In short, I feel most of the downside damage has already been done to the price of gold. Gold stocks on the other hand could still get roughed up for a few more months before finding a bottom.

Money is likely to continue rolling into the dollar as a safe haven and this will keep gold and silver prices relatively flat. But once the dollar starts to show signs of increased volatility (top) similar to 2000 – 2001 money will find its way into other currencies and precious metals as the new trade and safe haven.

Get My Trades In Real-Time: www.TheGoldAndOilGuy.com

Chris Vermeulen