Posts

The term Stock market predictions is a very controversial topic and does seem to give off a negative/non-credible overtone to most traders, investors and the general public. We all know you cannot predict the market with 100% certainty, but knowing that you can still predict the market more times than not if done correctly. Keep in mind that the term “market prediction” is also known as a market forecast or technical analysis outlook and is nothing more than a estimated guess of where the price for a specific investment is likely to move in the coming minutes, hours, days, weeks and even months.

Getting back on topic, this report clearly shows how the US dollar plays a dominant role in the price of other investments. Understanding how to read the Dollar Index will make you a better trader all around when trading stocks, ETF’s, options or futures.

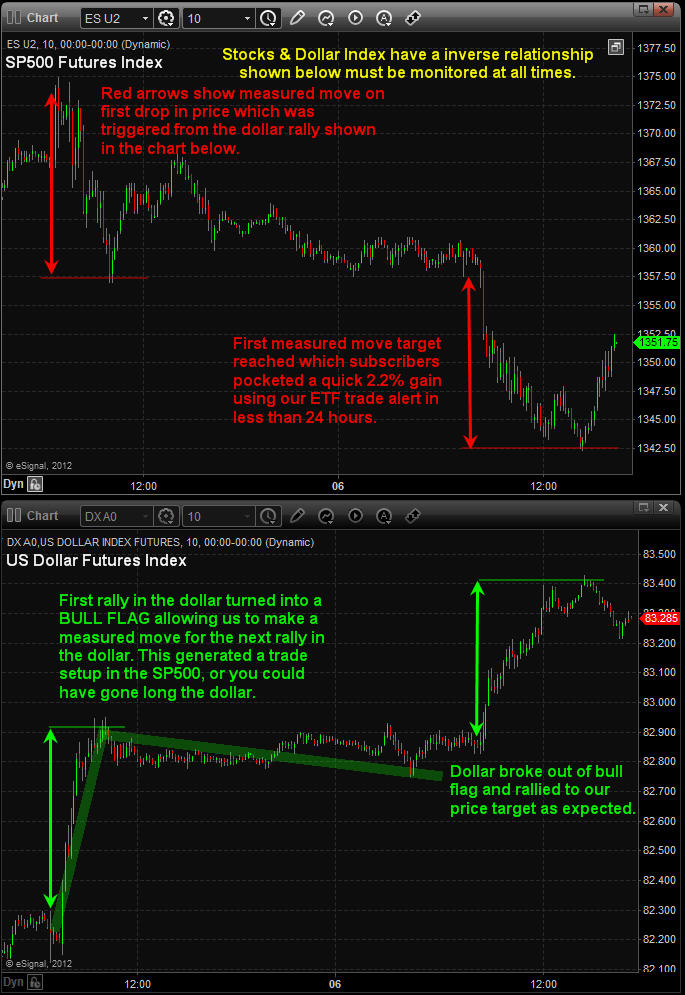
SP500 Stock Market predictions – 10 Minute Chart:
These charts clearly show the inverse relationship between the stock market and the dollar index. Knowing how to read charts (candle sticks, chart patterns, volume etc…) is not enough to give you a winning edge. You must also understand inter-market analysis as all markets are linked together in some way and the dollar plays a major role in where stock prices will move next. Review the charts and comments below on how I came up with my stock market prediction and trade idea.

Most Accurate Stock Market Predictions

Most Accurate Stock Market Predictions


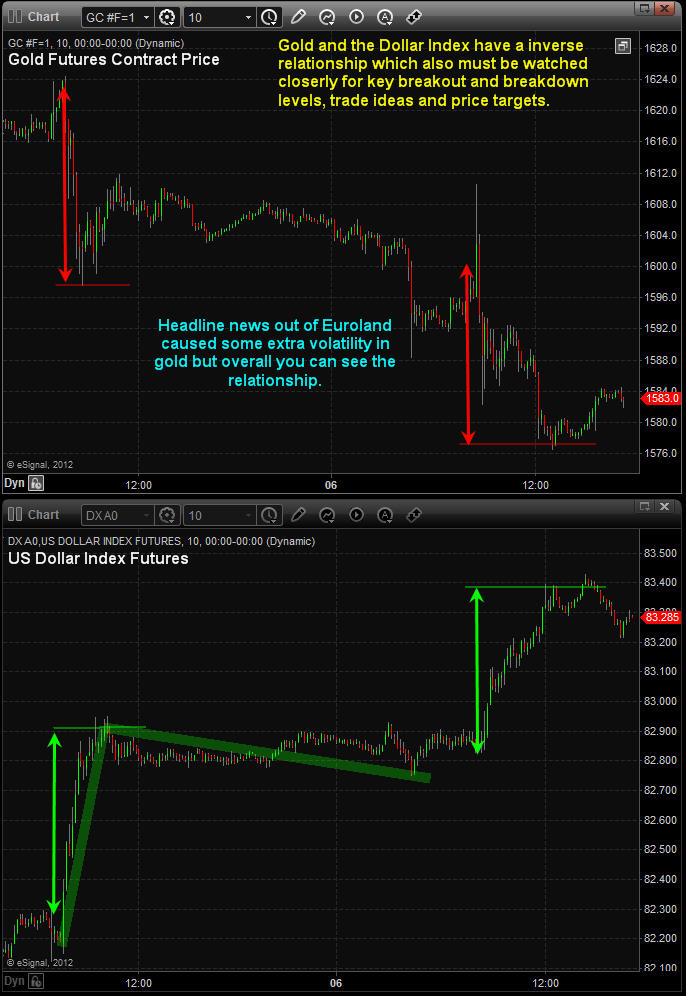
Gold Market Prediction – 10 Minute Charts
Gold is another investment which is directly affected by the price of the dollar. Review charts for more details.


Gold Market Forecast Procetions

Gold Market Forecast Procetions


Long Term Stock Market Forecast:
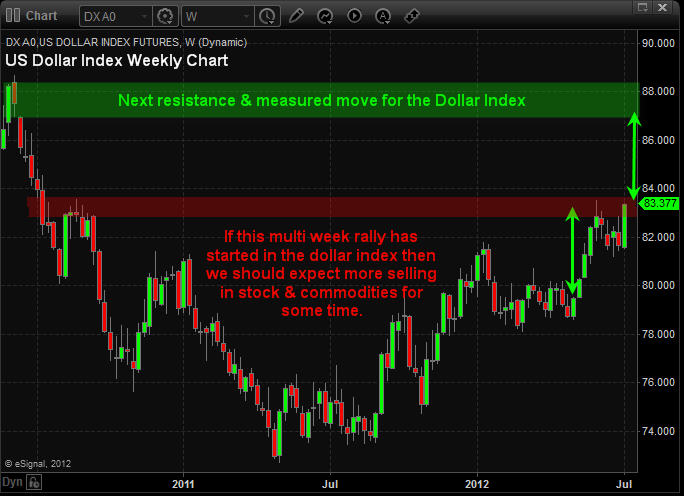
The weekly dollar chart is VERY IMPORTANT to watch as a short term trader and long term investor because trend changes in the dollar means you open positions will also likely change direction.

So, if we apply technical analysis to the dollar chart as seen below. You will notice we are able to create a market forecast and predict roughly where price is likely to move and how long it should take to get there. If the dollar can break above the red resistance level then we can expect a rally for 4 – 8 weeks and a price target around the 87-88 level.

If this is the case then stocks and commodities would likely do the inverse price action and move lower, sharply lower…

Dollar Long Term Market Forecast

Dollar Long Term Market Forecast


Stock Market Predictions & Gold Market Forecast Conclusion:

In short, the next weekly candle stick on the dollar chart could be a game changer for those who are long the overall stock market.

I will admit that the current market conditions are not easy to trade because of all the headline news rolling out of Europe each week along with economic data. And I feel as though we have been tip toeing through a mine field for the past 12+ months waiting for extremely negative news are extremely positive news to trigging a wave of buying or selling that will make our jaw drop, but it has yet to happen. Remember always use stops and don’t get over committed in a headline driven market.

If you would like to receive my free weekly analysis like this, be sure to opt-in to my list: www.GoldAndOilGuy.com

Chris Vermeulen

It was a crazy session as the stock market slid over 2% on heavy volume. This type of price action means fear has taken control of masses and they are unloading (selling their stocks) in anticipation of much lower prices.
Trading off extreme levels of fear can be very rewarding if done right. That’s because fear is the most powerful reaction we as humans have and it’s somewhat predictable. Fear can make people do crazy and or stupid things and it’s these extreme reaction which investors do in the market that lead to great trading opportunities. Buying into fear and selling into greed is what I focus on.

Gold and Silver Showing Greed and Fear
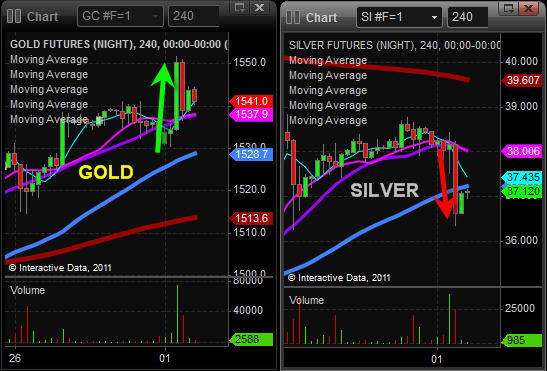
For example, if we take a look at the 4 hour chart of gold and silver you will see how investments which have a large amount of speculation like Silver move the opposite to what other related investments like gold are doing.

The first chart which is gold, shows how today’s fear had investors moving into this shiny safe haven. Silver on the other hand has been the investment of choice for every Tom, Dick and Harry trying to play the popular headline investment. So on a day like today when prices start to slide in the stock market these speculative holders of silver get scared and dump (sell) their position in stocks and silver. The problem with silver is that the market is still small and its does not take many people hitting the sell button to send it 5% lower which is what took place today. This is one sign which is telling me traders are getting scared of a market selloff.

Evidence #2 Showing Signs Of Fear
These data points below clearly show sellers were in control today. I like to look at the NYSE because it holds all the big brand name stocks which the masses like to buy when they feel lucky. So when I see this many traders selling and so few buying I know the masses are dumping shares and going to a cash.

The NASDAQ had 10 shares being sold to every one share being bought which is half the fear level of what the NYSE and that makes good sense. The NASDAQ has many smaller companies which the masses just don’t know about or own so there was not as much selling taking place on that exchange. So brand name stocks getting dumped all at once is another sign of extreme fear hitting the market.

Evidence #3 Showing Signs Of Fear
This chart below provides the momentum of the market. I think of it as the rubber band effect. If the market selling momentum is strong enough then it pulls this indicator down to a level which it cannot go much further before it gives way and moves back a neutral or positive extreme level. This little hidden gem of an indicator can help time entry and exit points with ease once you understand it. Currently its telling us that a pause or bounce is likely to happen tomorrow.

Evidence #4 Showing Signs of Fear and an Oversold Market Condition
Take a look at the 10 minute SPY (SP500) chart below. Simple visual analysis shows that today’s strong selling which has brought the market down into a support zone should provide a pause or a bounce very soon. The question is how big will the bounce or rally be?

Given all the confirming is looking ready for a bounce and I feel we could be nearing not a bounce but an intermediate bottom and higher prices going forward. But if we break strongly below this support level then all bets are off and much lower prices should occur.

Mid-Week Trading Conclusion:
In short, today’s sharp move lower has put the market in a short term oversold condition. Meaning, a bounce is very likely to take place within the next 1-3 sessions. With the masses selling all their positions in stocks and commodities it generally takes 1-3 days after a day like this for the selling pressure to dissipate and for value buyers to step back into the market providing support.

I think both stocks and commodities will strengthen in the next few days and we will see if the market can get some traction and start a new rally. But until everyone has sold out of the market giving their shares to the big money (smart money) at a sharp discount I feel we have a rough road ahead.

Get these trading reports free each week here: http://www.thegoldandoilguy.com/trade-money-emotions.php

Chris Vermeulen

We have seen some exciting moves in the market and with the market sentiment so bullish it should make for a sharp selloff in the coming weeks. Meaning everyone is overly bullish and owns a lot of stocks and commodities; therefore the market should top and leave them holding the bag while the smart money runs for the door. The market will not bottom until all of these individuals holding the bag finally cannot take the pain of losing any more money and once we see them panic and sell them all at once only then will we be looking to go long again.

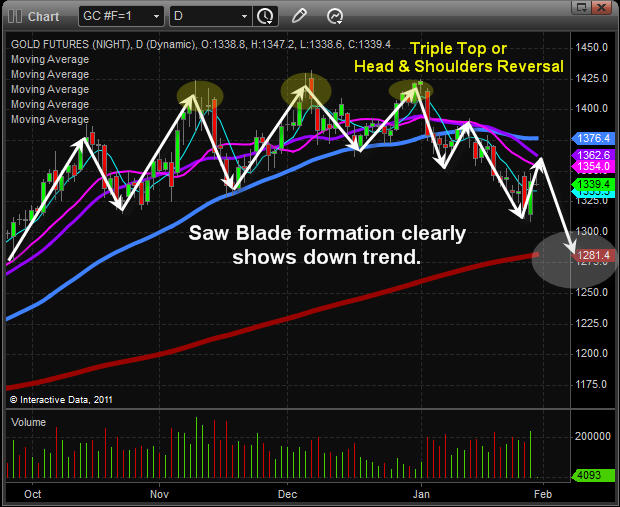
The past couple weeks I have been bombarded with emails asking if gold and silver have bottomed and if they should be buying more on these pullbacks. Those of you reading my work for the past few months know that my analysis clearly has shown how both gold and silver have been topping out. There have been strong distribution selling and price patterns on the charts are also clearly signaling a top was near.

A couple weeks ago I posted an important report covering gold, silver and the US Dollar and where the next big moves will be. Well it’s time for another update on Gold, Silver and the Dollar as they have come a long way from my last report.

Take a quick 15 second look at Part One charts: http://www.thegoldandoilguy.com/articles/precious-metals-and-the-dollar%E2%80%99s-next-big-move/

Ok let’s move on to today’s charts…

Silver Daily Chart
Silver has formed a very nice looking top and it is now trading under its key moving averages. It is also currently testing a key resistance level after Friday’s bounce on the back of fears in Egypt. Unless something happens internationally I figure silver sill continue its trend down.

Gold Daily Chart
Gold futures are doing the same as its little sister (silver). I feel the general public is still very bullish on metals and before we see higher prices (new highs) the market will have to shake the majority out of their positions first. At this time gold looks like it should test the $1285 level. Depending on how long it takes to get there and the price action it forms in the following days that outlook could change but expect sellers to step in at the $1350-1355 area.

US Dollar 2 Hour Chart
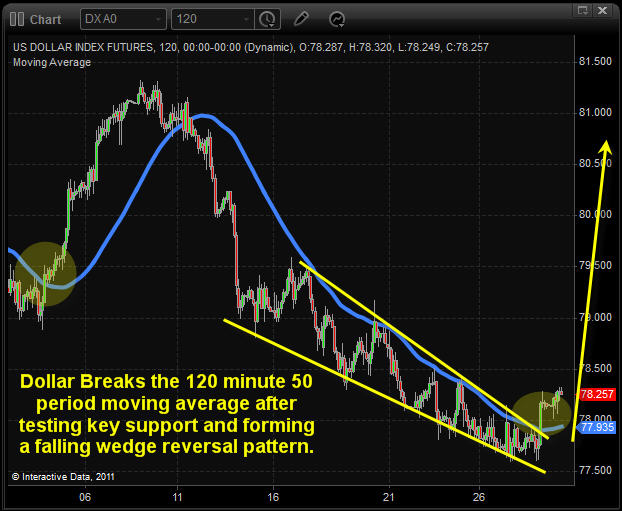
The dollar has been grinding lower the past two weeks forming a falling wedge reversal pattern. It’s also important to note that on the daily chart the dollar tested a key support level last week. This should be an interesting week for the dollar and the rest of the market simple simply because when the dollar makes sharp movements it pushes the price of stocks and commodities around in a big way.

I am looking for a multi week rally in the dollar possibly longer but with small pauses or corrections along the way.

Pre-Week Metals and Dollar Trend Analysis:
In short, I feel gold and silver are nearing a short term resistance level and will find selling pressure in the coming days only to continue on their journey down for a few weeks. The dollar on the other hand broke out of its falling wedge on Friday and could have a strong rally for 2-3 days. I feel most traders and investors have been shorting the dollar for two weeks straight, so once they realize it’s going higher there will be a ton of short covering and the dollar should rip higher.

This shift in the Dollar from down to up has a direct effect on the SP500 and subscribers of my newsletter are going to take full advantage of these next big moves in the market.

If you would like to get my daily trading analysis and trade exactly what I am trading please join my newsletter here: http://www.thegoldandoilguy.com/free-preview.php
Chris Vermeulen