Posts

Two of our favorite charts for following the US markets are suggesting the markets are range bound headed into the end of 2019.  The news may continue to push the price higher as the overall bias has continued to be to the upside.  Yet, our Fibonacci predictive modeling system is suggesting the current price trend has begun a “scouting party” type of move which may end in a moderate price correction fairly quickly.

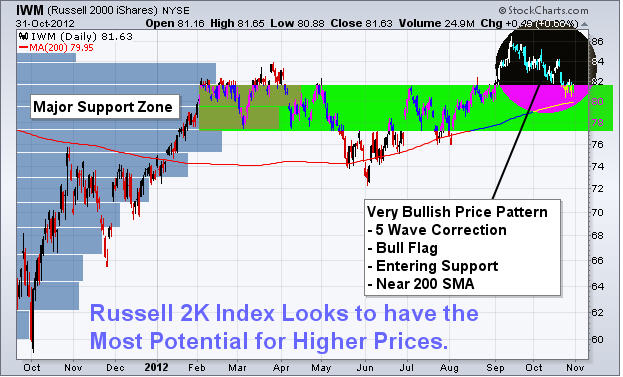
IWM RUSSELL 2K STOCK INDEX CHART

Our Adaptive Fibonacci price modeling system is capable of learning from past price activity and attempts to present key price data and trigger levels that are important for future trending.  The GREEN and RED horizontal lines on the right edge of this chart shows where the TRIGGER LEVELS are for the Fibonacci system.  The bullish trigger level (GREEN) is 2.5% above the current price levels.  The bearish trigger level (RED) is nearly 16% below the current price level.  This suggests that price would have to target either of these levels to establish a new price trend, or continue rotating within these levels to setup new minor peaks and valleys in the price – thus creating revised TRIGGER LEVELS. Get my updates by joining my free trend signals email list.

What we find interesting is the current “scouting party” type of rally that is taking place on the right edge of this chart.  This upside price move is above historical resistance (the CYAN LINE) and appears to be an attempt to test the support levels above the $160.50 level.

If the price is successful in establishing support above this level, a new bullish trend may begin.  If not, the price will rotate lower and potentially begin a new bearish price trend.  Remember, the downside Bearish Trigger level is 16% below the current price – so that the downside move could be quite dramatic.

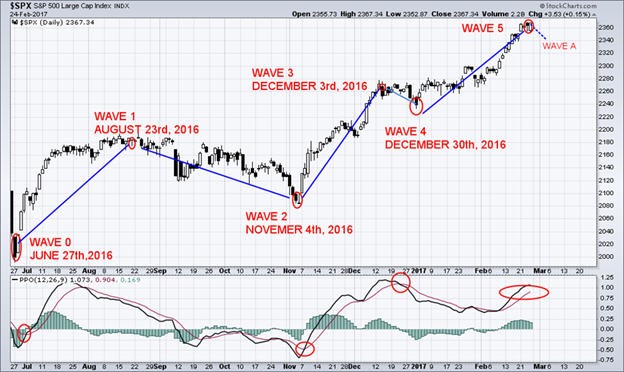
TRANSPORTATION INDEX WEEKLY CHART

This TRAN Weekly chart highlights a similar range-bound price setup where the bullish and bearish Fibonacci TRIGGER LEVELS are well above/below the current price.  The upside Bullish Trigger Level is 4.15% above the current TRAN price level – thus price would have to rally at least 4.5% higher to qualify as a breach of this Bullish Trigger Level and qualify as a potential new bullish trend.  The Bearish Trigger Level is near 18.4% below the current price level – thus the price would have to fall 18.5% from current levels to breach this Bearish Trigger Level and to qualify as a new Bearish Trend.

Where does this leave us headed into the end of 2019?  Our researchers believe the Santa Rally that most traders expect maybe more like a lump of coal in 2019.  We don’t expect any big breakout rally to happen over the next 35+ days and we don’t expect a massive 40% price correction either.  Our Fibonacci price modeling system is suggesting that any rotation within this 20% price range would be considered “absolutely normal” given the ranges that have been set up over the past 2+ years.

Last week we share these charts on the VIX that paint a clear picture of what is likely to unfold in the next week. This current week is one of the strongest months of the year so

Therefore, the downside price move of 6 to 12% would be completely normal.  And the upside move of 2~3% from current levels would be completely normal.  Any price rotation within the GREEN/RED Fibonacci triggers levels would be considered “normal price rotation” given the established price ranges, peaks and valleys.

We’ve been saying for months, 2019 and 2020 are certainly going to be interesting years for traders.  We believe any price rotation or breakout could lead to a wide range of price rotation that may shock skilled technical traders.  At this point, a 22%+ “normal” price range has setup in the markets.  Prices could rotate within this range and “not really go anywhere” in technical terms.

I want to wish everyone a Happy Thanksgiving and if you find this type of analysis interesting be sure to visit my website and sign up to get both my swing trade and investing ETF trade signals at 41% discount, plus a free bar of silver or gold with my Black Friday Offer Today! Visit: www.TheTechnicalTraders.com

Chris Vermeulen
Technical Traders Ltd.

Our researchers have identified a very rare type of price pattern that is typically associated with explosive trend changes and trends.  We call this type of pattern a “Sandwich” pattern because of how price reacts within a range.  The IWM, Russell 2000 ETF, is illustrating a nearly perfect example of this pattern right now.

Daily IWM chart (Russell 2000 Small Cap Index)

This close up view of the Daily IWM chart highlights the Sandwich pattern over the most recent 5 trading days and how price enters this volatile period, rotates around within a range, then settles near the upper or lower end of the range before a price breakout occurs.  Notice the earlier Sandwich pattern setup and how price settled near the bottom of the range before a downside price leg pushed the price much lower. It is our belief that the IWM could be setting up for a significant reversal or breakout based on this Sandwich pattern os be ready for an extended move.

Longer-term View of the Daily IWM chart

Here is a longer-term Daily IWM chart that highlights previous Sandwich patterns for you to review. We go into more detail and a very interesting setup in the IWM and transportation index that took place in 2008, same set up we see now. See charts and report here.
One thing to understand about the Sandwich pattern is that it is an early warning sign that price has reached an inflection point and will likely attempt to break out or reverse down from the ranges set up within the Sandwich pattern. Also, you can see from the examples, above, that these patterns can take many bars to form and are sometimes somewhat convoluted in structure.  The most recent Sandwich pattern is unique because it is very defined over the past 5+ days.  We believe an upside price pop to the upside could turn into a “washout high” price setup. Compare this price activity to the SPY chart and you’ll see that the IWM, Small Caps, are operating as a leading price indicator for the potential breakout/breakdown move that may happen in the immediate future.  We see similar types of price rotation, but nothing as clear as we see on the IWM chart.
The fed news is shaking things up and our analysis stats this month could be the market top. We expect Aug 19th-ish… but this month is the window we feel it may happen. Stay tuned to our research – this is going to be fun to trade.

WARNING SIGNS ABOUT GOLD, SILVER, MINERS, AND S&P 500

In early June I posted a detailed video explaining in showing the bottoming formation and gold and where to spot the breakout level, I also talked about crude oil reaching it upside target after a double bottom, and I called short term top in the SP 500 index. This was one of my premarket videos for members it gives you a good taste of what you can expect each and every morning before the Opening Bell. Watch Video Here. I then posted a detailed report talking about where the next bull and bear markets are and how to identify them. This report focused mainly on the SP 500 index and the gold miners index. My charts compared the 2008 market top and bear market along with the 2019 market prices today. See Comparison Charts Here. On June 26th I posted that silver was likely to pause for a week or two before it took another run up on June 26. This played out perfectly as well and silver is now head up to our first key price target of $17. See Silver Price Cycle and Analysis. More recently on July 16th, I warned that the next financial crisis (bear market) was scary close, possibly just a couple weeks away. The charts I posted will make you really start to worry. See Scary Bear Market Setup Charts.

CONCLUDING THOUGHTS:

In short, you should be starting to get a feel of where each commodity and asset class is headed for the next 8+ months. The next step is knowing when and what to buy and sell as these turning points take place, and this is the hard part. If you want someone to guide you through the next 12-24 months complete with detailed market analysis and trade alerts (entry, targets and exit price levels) join my ETF Trading Newsletter. Be prepared for these incredible price swings before they happen and learn how you can identify and trade these fantastic trading opportunities in 2019, 2020, and beyond with our  Wealth Building & Global Financial Reset Newsletter.  You won’t want to miss this big move, folks.  As you can see from our research, everything has been setting up for this move for many months. Join me with a 1 or 2-year subscription to lock in the lowest rate possible and ride my coattails as I navigate these financial market and build wealth while others lose nearly everything they own during the next financial crisis. As a technical analysis and trader since 1997, I have been through a few bull/bear market cycles. I believe I have a good pulse on the market and timing key turning points for both short-term swing trading and long-term investment capital. The opportunities starting to present themselves will be life-changing if handled properly.

FREE GOLD OR SILVER WITH MEMBERSHIP!

Kill two birds with one stone and subscribe for two years to get your FREE PRECIOUS METAL and get enough trades to profit through the next metals bull market and financial crisis! Chris Vermeulen – www.TheTechnicalTraders.com

Elliott’s theory is based on the Dow theory in that stock prices move in waves. Because of the “fractal” nature of markets, I have broken them down so that you can trade a daily complete wave count. Fractals are mathematical structures, which on an ever-smaller scale infinitely repeat themselves. Elliott discovered stock-trading patterns were structured in the same way.

This week will be very interesting in the markets. You need to understand what the markets are telling you. The markets are at anextreme”. I trade the most profitable waves, which are impulsive waves 1,3 and 5. It takes time to develop these great trades, but it is worth the wait as you observe the profits rolling in. Do not get caught up on the wrong side of the trade. Timing the waves correctly is a critical factor for creating these profitable 1trades.

The Corrective Waves are not as easy to identify as the Impulse Waves because the Corrective Waves have more variations as compared to the Impulse Waves. Corrective Waves of any trading pattern are broadly termed as the “ABC Corrections”. Corrective Waves are always the three wave patterns that unfold in the direction opposite of the larger trend.

“ABC Corrections” is the broad name given to the Corrective Waves. The corrective patterns formed by the Corrective Waves are against the direction of the trend. Wave 1 is corrected by the Wave 2 and Wave 3 is corrected by the Wave 4. After wave 5, the wave pattern finishes and the entire move which will be corrected. This correction will occur a multiple wave move. ABC” numbered waves are also the Corrective Waves.

Based on research that I have just completed, when the January and February months are both bullish, the equity markets moved much higher for the rest of the year! (http://www.marketwatch.com/story/still-room-for-stock-bulls-to-run-as-historic-breakouts-take-shape-analysts-say-2017-02-23/email).

The SPY Fund Flow represents the weekly flows in and out. This is a ‘Contrary Indicator’. When it becomes extremely pessimistic, I then look for a reversal to the upside. When fund flows are very high, I become concerned about a correction as expectations may have become too optimistic.

2

The total put/call ratio is the volume of puts divided by the volume of calls traded on individual equities on the Chicago Board Options Exchange, on any given day.  Generally speaking, heavy volume in put contracts shows large-scale fear by options traders, while heavy call volume is usually a reflection of increased investor optimism in regards to rising prices.  When there is heavy put buying and low call buying, the put/call ratio will be high. When an extreme is reached, this becomes a bullish contrarian indicator and we should expect higher market prices ahead of us. When option traders are optimistic and there is low put volume in relation to call volume, then the put/call ratio will be low and we may be nearing a market high.  The interpretation of this indicator is the same as the equity put/call ratio itself – high readings show fear and are generally bullish for the market. Low readings, show excessive optimism as the market typically declines after they are seen.

3

The GLD Fund Flow Weekly Indicator represents the daily flows into and out of GLD: (http://www.wikinvest.com/wikinvest/api.php?action=viewNews&aid=8343471&page=Stock%3ASPDR_Gold_Trust_%28GLD%29&comments=0&format=html).

Contrary Indicators are measuring the fund flows. When it becomes extremely pessimistic, then I begin to look for a possible reversal to the upside. When fund flows are very high, then I become concerned about a correction as expectations have become too optimistic. Why gold is great again: (https://www.forbes.com/sites/ralphbenko/2017/02/25/president-trump-replace-the-dollar-with-gold-as-the-global-currency-to-make-america-great-again/#23cdf01f4d54)

4

5


The Commitment of Traders (COT) Indicator gives you the overall picture of what is happening behind the scenes. It tells you who is buying and who is selling!  This information is an important key for your trading success!

The commercial traders are considered the “Smart Money”. The chart below displays, as of February 21st, 2017, that the commercial traders have taken new long positions.  This matches up perfectly with my long-term Elliot Wave forecast of 2550, in the SPX.


Red Bars: The Commercial Traders
(i.e.: Farmers, Hedgers, Producers, and Factories)

Blue Bars: The Large Speculators
(i.e.: Banks and Large Financial Money Managers)

Green Bars: The Small Speculators
(i.e.: You and me)

Yellow Line: The overall open interest in the market.

6

7

The next setup for going long on Natural Gas.

8

The U.S. dollar: Waiting for trend confirmation.

9

10

Learn how to build wealth during 2017!

Every week, there are new actionable trade ideas. Avoid what I refer to as “Herd Mentality” which will put you on the losing side of the trades more often than not.

Our most recent trade was UGAZ:( http://etfdb.com/etf/UGAZ/) on February 21st, 2017. We sold half of this position to lock in a quick 10+% profit in two days. Previous trades generated a 112% profit within 25 days (NUGT), and 7.7% profit (ERX) within 24 hours.


Stock Market bulls will continue their historic breakouts!

The Trump Administration’s promises of tax cuts and regulatory easing is the catalyst for the markets’ recent strong advance. Mr. David Dodd’s timeless classic saying: “The market in the short term is a voting machine, but in the long run it is a weighing machine”. This is the second most bullish market, after an election, since President Kennedy took office.

The Research Investment Committee commented “Monetary, fiscal and regulatory policies could be key drivers in 2017, but the timing of those actions could cause volatility”.  New regulatory action will favor many stocks in the financial and energy sectors. Repatriation will occur under President Trump’s new corporate tax plans. The U.S. currently operates under a tax system in which the domestic earnings of U.S. corporations are taxed at the federal U.S. corporate rate (35%) and any overseas earnings that are repatriated are taxed at this rate less a credit for foreign taxes paid on those same earnings. Foreign earnings have been parked offshore, allowing corporations to avoid the taxes associated with bringing them back to the U.S. These U.S. Companies would be granted an eight-year period to pay their tax liability. President Trump’s plan calls for a one -time deemed repatriation of overseas corporate profits at a 10% tax rate.


Conclusion:

In short, the US stock market is back in full blown bull market with truck reenergizing things. While I feel a short-term correction is due any day, it is just that, a short-term pullback followed by higher prices into June/July.

Tuned For More Analysis and Trades at: www.ActiveTradingPartners.com

Chris Vermeulen


Previously, I authored a “Part 1” of this article regarding my analysis of the VIX cycles.  I sincerely hope my readers enjoyed the analysis and I hope it opened up a few questions regarding the potential moves in the US and global markets.  Today, we will delve deeper into the concept of the VIX cycle patterns that I’ve identified and use common technical analysis concepts to attempt to identify price target levels as well as support and resistance that may become important in the immediate future.


For those of you that missed “VIX Cycles set to explode in March/April 2017 – Part 1”, please click on this link to review my earlier analysis.  When you are ready, the rest of this article continues my analysis.


As we had been discussing in “Part 1”, my hypothesis that a 5 month VIX cycle pattern exists and has been driving market volatility since 2015 appears to be substantiated by historical chart evidence.  The other interesting facet of this 5 month pattern is that it appears to be quickening in relation to recent activity.  I stated earlier that I believe this pattern to be a 18~22 week cycle event, but more recent VIX chart activity shows the current range may be more like 16~20 weeks.  My understanding of cycles and patterns is that within extreme, potentially violently, volatile periods, price cycles may become more frequent and velocity may become more volatile.  An example of this can be found in my long-term US major market cycle analysis below.


This image maps a major market cycle rotation process that has been in place for over 60 years.  This image starts in the late 1970s and maps TOP and BOTTOM cycling events and well as potential early and late stage cycle ranges.  When the GREEN and YELLOW levels, near the top, move above the 80% range, this starts the “Topping cycle event”.  When both of these levels fall below the 80% range, this ends the “Topping cycle event”.  The opposite is true for the BLUE and RED levels.  When both of them fall below the 20% level, this starts a “Bottoming cycle event”.  When they both leave the 20% level, this ends the “Bottoming cycle event”.  Actual price tops and bottoms can, and often do, occur within these event ranges.


US Cycle Chart

TopBottom2

Price and event cycles have been in place for centuries and correlate with other traditional forms of technical analysis easily.  For example, Elliot Wave, Fibonacci, Price Channeling and Price Patterns all relate to cycles very well.  Within this article, I’m using Price Patterns as well as Fibonacci to attempt to project and identify key target, support and resistance levels based on my understanding of the proposed VIX cycles.


Recent price expansion from the lows at $868.47, January 2016, prompted a rally to $1194.60, on April 25, 2016.  This range, $326.13, represents an expansion cycle and a Fibonacci range that we can use to determine Fibonacci cycle frequency – which may help us determine future price objectives.  After this peak, price dropped 25% of this range (a common Fibonacci level that is correlated to a real Fib value of 0.272) equaling $81.53.  Because of this narrow retracement, we should expect a potential future price move equaling 1.272%, 1.618% or 1.768% of the existing range.  XOI rallied to $1259.56 on December 12, 2016 – equating the expected 1.272% price expansion we projected and setting up for a 0.768% total range retracement.


Let’s take a look at one example – OIL (XOI)

XOI_Weekly


Last week followers, subscribers and I got long 3x long energy fund – ERX.

call


In 24 hours we locked in a 7.7% partial profit, and are now sitting with 10+% gain on the balance. This special setup I call the Momentum Reversal Method (MRM) continues to be in play and we could experience another 20-35% gain from here.


What does all this technical stuff mean? After this bounce we should expect XOI to fall back to near $976.00 before attempting any further price moves.  All of this type of Fibonacci work is conducted by understanding how Fibonacci price relationships correlate to time/price/cycle frequency functions.  Many of the best analysts of the past had detailed understandings of how these correlations work and how price would react based on larger and longer term time/price/cycle events.


Stay Tuned For Gold & Silver Forecast Next – Part 3

And Join My Newsletter for Real-Time Trade Alerts!

www.ActiveTradingPartners.com

My recent analysis of the markets has shown what I believe to be an explosion in market volatility set to starting happening between February 21, 2017 and March 30, 2017.  The historical VIX cycles have been running about 18~22 week intervals for expansion and extreme volatility levels.  The period August 2015 to January 2016 represented roughly 5 months.  The period between January 2016 to June 2016 represented roughly 5 months.  The period between June 2016 to Early November 2016 represented roughly 5 months (just a little short of 5 months in reality).


The period between November 2016 to the next volatility expansion phase, if this cycle continues, should be March/April 2107 at a target date range.

2017-calendar-1468440983V9p

How will this relate to the US major markets?  I currently believe the recent “melt-up” will stay in place until we have some catalyst that will change the direction of the markets.  In other words, the path of least resistance in the US major markets is upward right now – at least till something changes that direction/sentiment. The VIX cycles may be related to some catalyst event or external foreign market event that could change the major market directions – nut only time will tell.


VIX_Weekly


Currently, on the below DIA chart, I can state that my estimates for upside resistance is 210~212 based on historical price action.  The reason I believe these levels will become upside target objectives is based on my understanding of price rotation, expansion and contraction as well as Fibonacci ratios.  The actual number that I believe will be resistance is 211.63 and I believe this level will be reached in March 2017 or early April 2017.


DIA_Weekly


Once this critical resistance level is reached in the DIA, then all bets are off in terms of the price retracement/rotation that may occur.  Given historical price rotation as examples, I would estimate that the DIA could retrace a minimum of 6~8% ($13 to $17).  A moderate price rotation would equate to a move of 10%~13.5% ($21 to $28).  Beyond these expected levels of support, all bets are off in terms of downside potential.  The closest major downside support levels are $178.25, $170.30 and $154.35 – these levels represent a greater than 15% total price retracement and would put us dangerously close to “Bear Market Territory”.


Of course, if the VIX cycles persist as I suspect, a massive increase in volatility will drive other markets into further trending or price rotation as well.  The tech heavy NASDAQ (QQQ) has been mirroring the DIA and my projected top level is 128.15.  Currently, the QQQ is at $126.54 – only $1.65 (or 1.33%) away from my expected peak level.  After these peaks have been reached, I expect the major market to take pause and attempt to resume trending as we move closer to the volatility cycle period I suspect is driving the VIX (March/April 2017).  It is because of this that I’m issuing this warning to my members to be cautious of extended risk or exposed positions as we near the end of February 2017.  I believe the old term, “Beware the ides of March”, may be a harsh reality this year.


QQQ_Weekly


As I continue my extended analysis of the US major markets and commodity markets in relation to these VIX cycles, I will post “Part 2” of this article within a day or so.  I wanted to get this out to all my members and associates so they were brought aware of the fact that the markets are beginning a phase of volatility expansion that should not end till near April 1st, 2017.


In short, what does all this mean? Well, it means now is not the time to be adding new long equity position for long-term growth. Going forward, its going to be all about active trading and focusing on my Momentum Reversal Method (MRM) and trading just the hot stocks and sectors for quick oversized gains.


On Feb 8th, myself and subscribers closed out our NUGT trade for a 112% profit that we entered December 16th.

atp-nugt


This week we got long ERX at $33, and sold half the position 24 hours later for another quick 7.7% profit and there is still a lot of room for bigger gains there.

erxprofit

So, if you are looking for a simple and highly accurate pulse on the market along with timely swing trades I urge you to join my newsletter at www.ActiveTradingPartners.com – STAY TUNED FOR PART II…


Chris Vermeulen

When the SPX breaks out above its’ current resistance level, it will be the next leg up in this bull market. We are currently in a consolidation period. The SPX seems to be resting for now!  The “Bollinger Bands Squeeze” is now taking hold and will result in a powerful move in either direction once broken.  I do have a new BULLISH trigger for members to enter into during this amazing “melt up” that will only be shared with my ‘elite members’.   I can assure you that you will want to be invested in this next BULLISH leg of the SPX!


The Next Move UP!

j201

j202


‘Bollinger Bands’ are one of my most preferred tools of technical indicators:

The “Squeeze”,(http://www.investopedia.com/articles/technical/04/030304.asp?lgl=bt1tn-baseline-below-textnote)  occurs during low levels of volatility as the ‘Bollinger Bands’ narrow. These periods of low volatility are followed by periods of high volatility. Therefore, a volatility contraction of the bands can foreshadow a significant advance or decline.  This is one of my best kept secrets of technical analysis, until now!

j203


Financial markets are now awaiting what the new Trump Administration has in store. These markets do not like “uncertainty”. So far, President-elect Trump has announced a direction of deregulation and lowering the tax bracket for corporations and repatriation of all corporate money (http://www.investopedia.com/terms/r/repatriation.asp) that is held overseas in foreign bank accounts.

The ‘ISI Research Study’ revealed that the “U.S. S&P 500 companies now have $1.9 trillion parked outside the country”.  Most likely, said funds will be applied so as to continue the stock buyback program thereby pushing the SPX to new levels that are ridiculously overpriced. Hot money ‘continues to be supporting the rise in equity markets. I share some of these hot money sectors and stock on my StockCharts.com public list!


Trump’s Victory Speech on November 9th, 2016:

“We are going to fix our inner cities and rebuild our highways, bridges, tunnels, airports, schools, hospitals. We’re going to rebuild our infrastructure, which will become, by the way, second to none. And we will put millions of our people to work as we rebuild it. We will also finally take care of our great veterans”.


Chart of the SPX “melt-up’:

j204

Are there too many happy investors?

The U.S. stock markets have been on a run since the U.S. Presidential election last November 9th, 2016.

U.S. stocks continue to see signs of “optimistic extremes”. The risk of buying on emotional decisions is still currently high.

There is no interest in shorting. The number of shares sold short, in hopes of buying them back at a lower price, has collapsed. The SPY fund (https://us.spdrs.com/en/product/fund.seam?ticker=SPY), short interest is the lowest since the summer of 2007.  Individual stocks are also showing a lack of short sales which, in turn, removes a pool of potential buying interest. A “de-trended” version of the short interest ratio has dropped to a level that has led to negative returns for stocks which will happen, but likely not for many month yet. The market is likely to grinding higher before a big correction takes place.

A new high presented itself on a day that the jobs report missed expectations. On January 6th, 2017, the jobs report came in less than what economists’ expectations were.  However, the SPX powered to a new high of 2276.06.  This may seem like good news, but during prior times that this occurred, stocks usually pulled back over the following weeks.

Stocks have drifted higher even after optimism reached an extreme. ‘Dumb Money Confidence’ exceeded 80% but the SPX has added on more gains without any kind of pullback. This type of buying pressure, after an extreme optimism sentiment, has previously occurred only a handful of times. It has usually led to losses as the late buyers became “exhausted”.


Investor confidence is so High they see no need to hedge their positions:

The Equity Hedging Index has declined to its’ lowest level in nearly two years, showing a lack of interest in the various ways that investors use to protect themselves from possible market declines.

j205

This chart is a contrary indicator. The higher the Equity Hedging Index, the more likely it is that stocks will rally going forward.  The lower the Equity Hedging Index, the less likely that stocks will rally.


                                                                                                              Conclusion:

Hopefully, Trump’s business experience will translate well into his new position. It is certainly my hope that he is as successful as possible. Even during the campaign Trump spoke about how stocks were in a giant ‘bubble’.  This euphoria that we have felt, since his election victory, has made that ‘bubble’ even larger. Throughout U.S. history, every ‘giant financial bubble’ has always ended very badly, and this time around will not be an exception. Trump may get the blame for it when it bursts, but the truth is that the conditions for the coming crisis have been building for a very, very long time.

I expect the stock market to stall out mid way this year in June/July at which point things could turn south. If you want to follow me live at StockTwits.com

Join my free trading newsletter at www.TheGoldAndOilGuy.com

Chris Vermeulen

The Commercial Hedgers are considered the smart money. The Speculators are considered the dumb money.

The rise in yields corresponds with the decline in Treasury prices.  A bounce is ahead of us in 2017.

Commercial traders have built up their most bullish position since February of 2013.

Commercial traders are now long 50% more long than they are short. This is the most bullish COT Ratio reading since July of 2011.

The speculative side of this trade have built up their most concentrated short position since February of 2013 and their largest net short position since March of 2012. The speculators are usually wrong. They set their recent COT Ratio high two weeks before the market topped out. The concentration of their short position should give pause to new short sellers.

The technical picture suggests a bounce is due.


BOND RISK LEVELS

Latest Value(s):

  • Last Reading: 2.0 December 27th, 2016

Extreme Values:

  • Excessive Optimism: 8.0
  • Excessive Pessimism: 2.0

bb1


BOND OPTIX WEEKLY

Latest Value(s):

  • Last Reading: 33.0 December 23rd,, 2016

Extreme Values:

  • Excessive Optimism: 70.0
  • Excessive Pessimism: 40.0

bb2


The Treasury prices are oversold on the March 30-year Treasury Bond futures.

The evidence is displayed with the buyers of US Treasury Bonds. I side with the commercial traders. The dramatic imbalance in positions between the commercial and speculative traders suggests a bounce higher is imminent.

bb3


My Elliot Wave Of Bonds – TLT:

Elliott Wave 2 Theory

Elliott Wave (2) is the first correction against the new trend

Elliott Wave (2) corrects wave (1), but can never extend beyond the starting point of wave one. Typically, the news is still bad. As prices retest the prior low, bearish sentiment quickly builds, and “the crowd” haughtily reminds all that the bear market is still deeply ensconced. Still, some positive signs appear for those who are looking: volume should be lower during wave two

Elliott Wave 3 Theory

Elliott Wave (3) is usually the strongest and longest wave

Elliott Wave (3) is usually the largest and most powerful wave in a trend. The news is now positive and fundamental analysts start to raise earnings estimates. Prices rise quickly, corrections are short-lived and shallow. Anyone looking to “get in on a pullback” will likely miss the boat. Trading the Wave (3) is usually the most profitable.  This will be a muti-year rally!

bb4


In Conclusion:

The new year of 2017 will not be a good one for global economies.  There will be a big slowdown throughout the global economies. The equity markets, as well, will be extremely negative in 2017.  The next yearly closing should be at a low level. The low of 2016,1800 in SPX, may be breached. The analysis is trying to say yes!  Be prepared to exit your long stock positions at the midpoint of 2017 and enter “safe havens”. See my gold forecast – Click Here

Bonds should start to rise and hold up through 2017. But will only rally in a big way once there is a major global event/crisis or the later stages of a bear market in US equities. Either way, likely not going to happen till late 2017 or beyond.

Get my swing trades and long-term asset positions at www.TheGoldAndOilGuy.com

Chris Vermeulen

AAPL shares have been in free fall mode all October spooking investors with a $120 drop from the all-time high in September. As well all know, though it’s hard to follow without a proven trading strategy to keep us focused but the key is that you must buy when others are selling and then sell when everyone is buying.

Apple shares really have helped in holding the overall stock market up in the past but recently it has been a big drag on the broad market. Taking a look at the chart below you can see my analysis and thoughts of this giant.

The red horizontal line shows the key level where high volume traded in the past. For the market to reset (flush out investors/traders) it must shake as many longs out before it can start rising again. By the price breaking below that level which also happens to be a Century Number $600, most of the stops were placed down around this level. The volume spike of 40,000,000 shares clearly shows it triggered stops once that $600 level was broken. We want stops run because it give more power to the next rally/bounce.

AAPL Shares Bottoming


NASDAQ Index:

The NASDAQ has formed a similar chart pattern and is heavily weighted with AAPL shares. Trading NQ futures, QQQ, QLD or the XLK exchange traded fund as a much more affordable way to play a bounce/rally in the coming weeks.

NDX - QQQ Shares Bottoming


Russell 2000 Index:

I really like the Russell 2000 index because small cap stocks can rally hard and fast outperforming the large caps like AAPL, SP500, NASDAQ and DOW. This index is looking ripe for a bounce in the coming days which could trigger the next major rally to new highs. You can plan this index through TF futures contract, IWM, TNA, UWM exchange traded funds.

IWM - TNA Funds Bottoming


Trading Conclusion:

While this setup looks very promising because the election is almost over and the Santa Clause rally is just around the corner. Know that some of the biggest drops in the market happens during times when the market is running the stops. It is a natural tendency to take big positions which things look great, but that is not how you do it… Take calculated position sizes knowing indexes could fall another 2-3% before putting in a real washout bottom.

Get My Trade Alerts at: www.TheGoldAndOilGuy.com

Chris Vermeulen