Posts

I am not one to discuss fundamentals or macro views, but this situation in Europe is beginning to morph into a media frenzy. Price action in the marketplace is changing rapidly in short periods of time based on the latest press releases coming from the Eurozone summit.

I cannot help but comment on the seemingly arbitrary actions coming from this high profile meeting. Nothing has happened that market participants were not already privy too. The European Union is going to strengthen their EFSF fund by levering it up roughly 4 : 1. I have yet to hear how exactly they plan on doing this, but this action was no surprise to anyone that has read an article about the sovereign debt crisis in the past month.

There was also discussion about backstopping European banks’ capital position. Since European banks are holding billions (Euros) of risky sovereign debt instruments, it would make sense that their capitalization is a primary concern of Eurozone leaders based on current fiscal conditions. I would argue that the banks should be well capitalized regardless of economic or fiscal conditions in order for a nation to have a strong, vibrant economy that has the potential to grow organically.

The final piece of this week’s political nonsense involves write-downs on Greek debt in the neighborhood of 50% – 60% in order to stabilize Greece’s debt to GDP ratio. Apparently Eurozone leaders want to structure the write down so as to avoid payouts by credit default swaps which act as insurance against default. How does a bond take a 50% – 60% valuation mark down without a creating an event that would trigger the payout of CDS swaps?

If a write down of that magnitude does not trigger the CDS swaps, then I would argue they are useless as a tool to hedge against the default risk carried by sovereign debt instruments. If the CDS swaps do not payout as projected by European politicians, the risk assumed by those purchasing government debt obligations around the world would be altered immediately.

The impact this might have on the future pricing of risk for government debt instruments could be extremely detrimental to their ability to raise funds in the private market. Additionally, the write downs would hurt European banks’ capital positions immediately. If the CDS swaps were to pay out, bank capital ratios would suffer as those who took on counter party risk would be forced to cover their obligations thereby straining capital positions even further potentially.

Price action today suggested that the equity markets approved of the package that European leaders were working on. However, the biggest push higher came when news was released that China was interested in purchasing high quality debt instruments as a means to help prop up poorly capitalized banks and sovereign nations in the Eurozone through an IMF facility.

The market did an immediate about-face which saw the Dollar selloff while the S&P 500 rallied higher into the close reversing a great deal of Tuesday’s losses. Inquiring minds wish to know where we go from here? I would be lying if I said I knew for sure which direction Mr. Market favored, however that did not stop me from looking for possible clues.

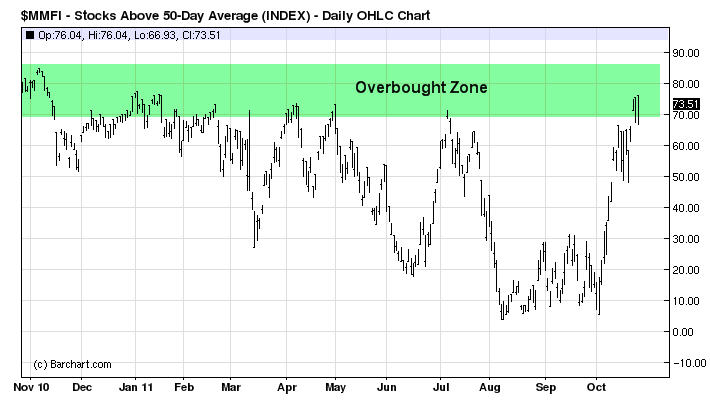
It has been a while since I checked out the short-term momentum charts that are focused on the number of stocks in U.S. domestic equity markets that are trading above their 20 & 50 period moving averages. The charts below illustrate the current market momentum:

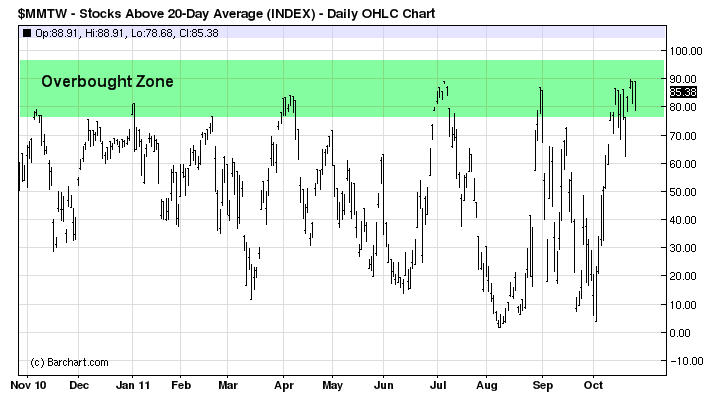
Equities Trading Above the 20 Period Moving Average

Stock Above the 20 Day Average

It is rather obvious that when we look at the number of stocks trading above their 20 period moving average that momentum is running quite high presently. This chart would indicate that in the short-term time frames equities are currently overbought.

Equities Trading Above the 50 Period Moving Average

Stock Above the 50 Day Average

A similar conclusion can be drawn when we look at the number of stocks trading above their 50 period moving averages. It is rather obvious at this point in time that in the short to intermediate term time frames, stocks are currently at overbought levels. This is not to say that stocks will not continue to work higher, but a pullback is becoming more and more likely.

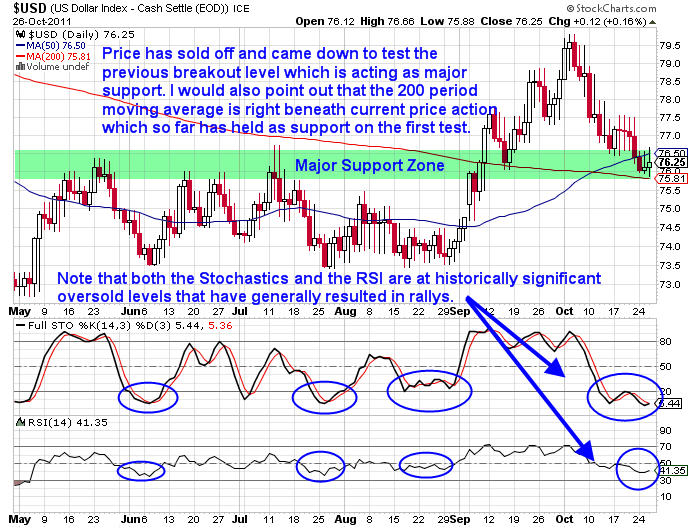
Additional evidence that would support the possibility that a pullback is likely would be the  recent bottom being carved out in the price action of the U.S. Dollar Index. The U.S. Dollar has been under selling pressure since the beginning of October, but has recently started to show signs that it could be stabilizing and setting up to rally higher.

The daily chart of the U.S. Dollar Index is shown below:

US Dollar Chart

The U.S. Dollar Index is sitting right at major support and is oversold based on historical price action. If the Dollar begins to push higher in coming days and weeks it is going to push equity prices considerably lower. Other risk assets such as gold, silver, and oil would also be negatively impacted by higher Dollar prices.

Members of my service know that I focus on several sectors to help give me a better idea about the broader equity markets. I regularly look at the financial sector (XLF), the Dow Jones Transportation Index (IYT), emerging markets (EEM), and the Russell 2000 Index (IWM) for clues about future price action in the S&P 500.

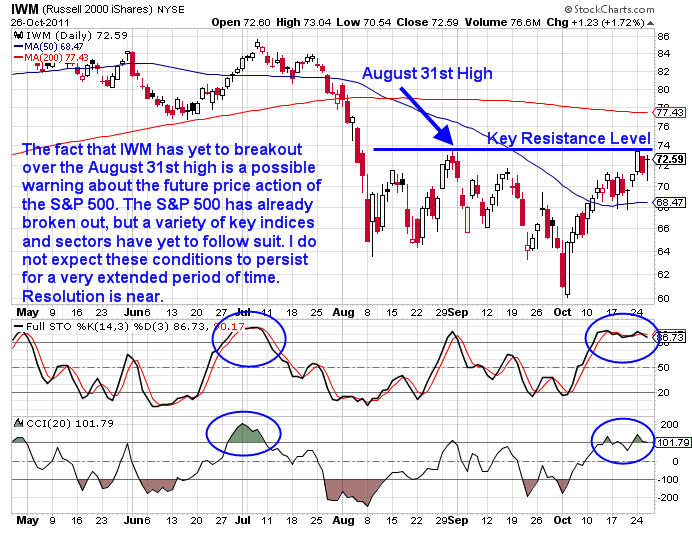
During my regular evening scan I noticed that all 4 sector/index ETF’s are trading at or near major overhead resistance. With the exception of the Dow Jones Transportation Index (IYT), the other 3 underlying assets have yet to breakout over their August 31st highs. The significance of August 31st is that is the date when the S&P 500 Index put in a major reversal right at the 1,230 price level before turning lower. It took nearly two months to regain the 1,230 level and its significance continues to hold sway.

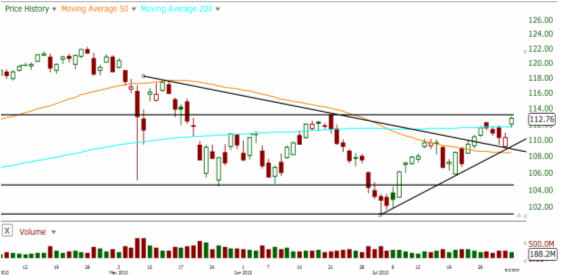
The daily chart of IWM is shown below illustrating its failure to breakout over the August 31st highs:

IWM Russell 2000 ETF

The chart above illustrates clearly that IWM has failed to breakout above the August 31st highs. I am going to be watching IWM, XLF, & EEM closely in coming days to see if they are able to breakout similarly to the S&P 500. If they start to rollover, it will not be long before the S&P 500 likely follows suit.

Currently the underlying signals are arguing for lower prices in the short to intermediate term. While it is entirely possible that the S&P 500 rallies higher from here, it is without question that current market conditions are overbought in the short to intermediate terms.

Key sectors and indices are not showing follow through to the upside to help solidify the S&P 500’s recent break above the key 1,230 price level. Additionally, the U.S. Dollar Index is currently trading right at key support in addition to being oversold. At this time I am not playing the S&P 500 in either direction, but I will be watching the underlying price action in the U.S. Dollar Index closely. I will be watching for additional clues in the days ahead.

Market and headline risk is high presently.

Subscribers of OTS have pocketed more than 150% return in the past two months. If you’d like to stay ahead of the market using My Low Risk Option Strategies and Trades check out OTS at http://www.optionstradingsignals.com/specials/index.php and take advantage of our free occasional trade ideas or a 66% coupon to sign up for daily market analysis, videos and Option Trades each week.

By: Chris Vermeulen & JW Jones

This material should not be considered investment advice. J.W. Jones is not a registered investment advisor. Under no circumstances should any content from this article or the OptionsTradingSignals.com website be used or interpreted as a recommendation to buy or sell any type of security or commodity contract. This material is not a solicitation for a trading approach to financial markets. Any investment decisions must in all cases be made by the reader or by his or her registered investment advisor. This information is for educational purposes only.

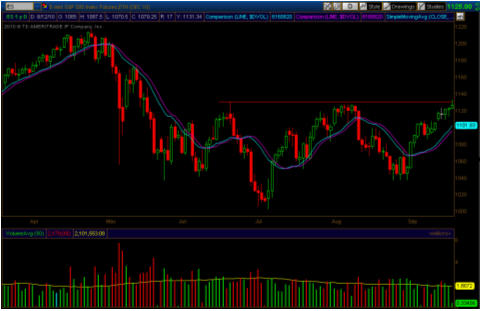
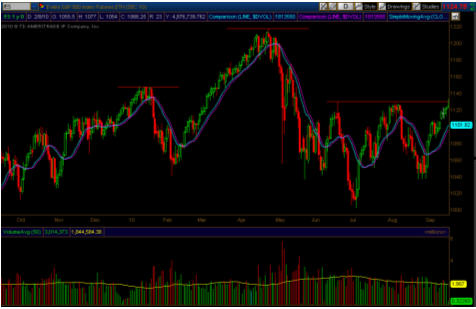
This recent rally has many market pundits believing the market will continue higher, fueled by slightly improved economic data points. The bulls realize that the all important S&P 1130 level is not that far overhead; if they can push the SPX through that level with strong volume, a rally could play out. The charts below are using the S&P E-Mini contract for analysis purposes.

In contrast, the bears look at the S&P noting the ever present head and shoulders pattern as well as the potential triple top formation should the S&P 1130 resistance level hold. While the S&P 1130 level is critical for the bulls, the bears view it as the final stand. The bears realize that if they cannot hold the 1130 level, their party will end and the bulls will happily rub it in their face.

So what is a trader to do? The first advice worth offering is to utilize patience. Let others do battle and wait for the market to confirm a specific direction. Professional traders always have a plan before they enter a trade and they consistently utilize stops to define their risk. The very best of traders do not allow their opinions or the opinions of others to cloud their judgment; professional traders will abruptly change their trading plans in order to adapt to changing market conditions.

Trading is all about perception and leveraging probability. Regardless of whether a trader utilizes technical analysis, fundamental analysis, or the newspaper-dart method the very best traders realize that consistently taking money out of the market is more about managing emotions and probability than anything else.

The market always leaves clues behind, but if a trader is too biased in one direction or the other he/she becomes blind to clues that do not fit his/her directional bias. The current state of affairs in the S&P 500 offers another quality setup, regardless of which bias a trader has. With option expiration looming, a new option cycle presents itself with expiration at the end of September (Quarterly’s). My most recent missive focused on option butterflies, however the situation we have currently on the S&P calls for a wider trading range. We now find ourselves in condor season.

Condors and iron condors have similar setups, but they have slightly different constructions. Theta (time decay) is the primary profit engine just like traditional butterflies; the only difference is that condors and iron condors offer potentially wider profit zones than a traditional butterfly. Similar to butterflies, condors are susceptible to volatility shocks, expanding implied volatility on the underlying, and gamma risk can also present itself and negatively impact a trade’s overall performance.

The most important thing to remember about option trading is that as one progresses in his/her overall option knowledge, options allow a trader to modify their position to reduce risk and allow positions to become profitable.

While both types of condors are susceptible to the same risks, their primary functional difference is based around their construction. Both condors and iron condors have 4 separate and specific legs. A traditional condor utilizes 4 option contracts of the same type; 4 calls or 4 puts. Iron condors utilize a mixture of calls and puts; 2 calls and 2 puts. Another primary difference is that condors are a debit trade, while iron condors are a credit trade.

In this week’s example we will use an iron condor strategy to set up a trade. The trade will not have a directional bias, instead we will simply use the passage of time as our profit engine. We will use the S&P 1130 level as our midpoint, and build the wings of the iron condor equidistant from that level. Trading the cash settled SPX index options or trading options on the S&P 500 futures requires more capital and the acceptance of greater risk.

A trader with less capital could utilize the SPY in the same manner, with less capital at risk and tighter bid/ask spreads. For accounts exposed to the ravages of the tax system, it is important to remember there is preferential tax treatment of the cash settled index options and futures options that are not present in the SPY.

The iron condor is set up using 4 separate option contracts – 2 calls and 2 puts. The iron condor has the following construction ratio: Long 1 Put/Short 1 put/Short 1 Call/Long 1 Call. Each of these two vertical spreads is constructed as a credit spread. In our case, we are going to use the following strike prices for our example. Keep in mind, a trader willing to take more risk could use strikes which are closer for the potential of higher returns (more risk). On the other hand, those who are more risk averse could move the short strikes further apart for a lower return (less risk).

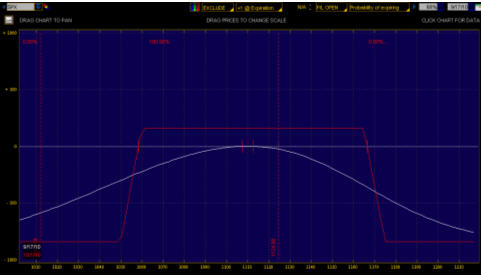
The chart below represents the profitability of an SPX iron condor using the following trade construction: Long 1 Sept (Quarterly) SPX 1050 Put/Short 1 Sept. (Quarterly) 1060 Put/Short 1 Sept. (Quarterly)1165 Call/Long 1 Sept. (Quarterly) 1170 Call. For further detailed information, prices used to produce this iron condor were based on the Thursday close and the midpoints of the bid/ask spread on all contracts. The profitability reflected below is based on a 1/1/1/1 setup. Obviously if a trader decided to add more contracts the max profit and loss would increase. Keep in mind, this example is for educational purposes only and is not reflective of intraday market prices.

The red line represents profit/loss at expiration. The white line represents profit today. As you can tell, the potential profit for today is essentially zero unless a substantial deterioration of implied volatility was to occur. The key to this entire trade is the passage of time. If the SPX stays within SPX 1060 and SPX 1165 price at expiration on September 30th the trade will realize the maximum of profit of $160. The total risk taken by this trade would be $840.

The beauty as always with options is that risk is crisply defined. The absolute most you could lose on this trade regardless of what happens is $840 per side. As a side note, the probability of SPX’s price remaining between the 1060-1165 price range over the next two weeks is around 70% based on a log normal (Gaussian) distribution of prices.

Additionally, iron condors can be manipulated throughout their lifespan to defend profits. The ability to make slight changes to the construction by purchasing slightly out of the money puts/calls can also help protect profits if price gets near the edge of the profitability window. A myriad of strategies exist once this trade is placed to adapt to ever changing market conditions.

As an example, let us assume that price goes higher to around SPX 1150 in one week. At that price point, we could close the put portion of the condor for the maximum gain and then restructure our condor to protect the call side with a slightly out of the money call purchase and/or another put credit spread at a higher strike point taking in more premium and further reducing our risk.

After a trader becomes proficient with the various option trading strategies, he/she can constantly adapt positions to prevent further losses. After all, options were designed primarily as a means to hedge equity positions and reduce risk.

In closing, the iron condor strategy can be profitable regardless of which direction an underlying’s price goes. There is no guesswork or fake outs, as long as the inevitable passage of time continues and price stays within the contracts that were sold to open the position, a near 19% return is possible based on capital at risk.

Get More Free Reports and Trade Ideas Here for Free: FREE SIGN-UP

J.W. Jones
Market technicians believe they operate in a world that few people truly understand. It is as if they believe they are working in some sort of secretive financial construct that only a few lucky souls away from Wall Street can access. The truth is that technical analysis should only be used as one metric to help a trader navigate financial markets.

There are a variety of research methodologies which all shed light and offer clues where the market may be heading. Market internals, the volatility index, Fed speak, and even fundamental analysis can be helpful to traders. It would not make sense to ignore market information that provides greater insight and additional clues that can help give a trader an edge. After all, the edge is what all traders seek. The sweet spot in trading is having a trading system that gives you an edge and offers a variety of way to quantify, mitigate, and define risk.

The same traders that only look to use purely technical analysis in their trading also fail to recognize other investment vehicles which might offer advantageous returns. The best kept secrets are always kept in the open, right beneath the public’s proverbial nose. People will travel the world in search of secrets or to prove theories, but in many cases the Holy Grail is lying right beneath their noses.

The greatest secret financial markets offer are the unbelievable potential returns that options can offer. Options offer a variety of ways to profit in a multitude of market conditions. Options offer unique profit engines that are not available or even possible when trading stocks or bonds. Most traders overlook options or are simply unwilling to put in the time or effort to learn how to trade them appropriately. In doing so, they are walking away from huge opportunities.

Most novice traders are quick to spurn options as they consistently lose money when trading them. The most common reason novice option traders experience losses is that they do not do their homework beforehand. New option traders fail to recognize the importance of “The Greeks.” Option traders not only have to be cognizant of the volatility index, but they have to be proficient in the dynamic factors that impact option prices such as implied volatility. In the future, my articles will be focused with the intent to educate readers about “The Greeks” in a way that is easy to read and understand.

Traders that utilize a trading system or that look for low risk entries find themselves sitting idle when market conditions are not favorable for their trading system or when prudent entries have not presented themselves. The ability to trade options gives a trader another investment vehicle that can offer potential profits. In most situations, options can offer attractive returns while taking significantly less risk than trading stocks, ETF’s or bonds.

In order to illustrate a situation where options can present a better risk versus reward, we need to look no further than intraday market action in the S&P 500 on August 2nd. The market rallied from the previous close and was bumping up against significant resistance. Traders could have been looking to get long or short based on recent price action. The market had been consolidating, and a significant move was likely coming.

Clearly the market was at a crossroads and a breakout could be right around the corner, or the market could test recent highs only to turn down to retest recent support. Stock traders have to make a decision about direction or sit on the sidelines and let others do the heavy lifting. Option traders could put on positions that have a directional bias, or they could utilize time decay (theta) as a profit engine.

Through the use of spreads such as an iron condor or a butterfly spread, option traders can actually put on a position that has the ability to be profitable regardless of which direction SPY goes. In order for a spread to work, SPY’s price must stay within the confines of the spread which is also determined by the specific option strike prices selected by the option trader. Similar to the mechanism that drives asset pricing, the more risk an option trader takes the greater their return. If a spread is written that is extremely wide and thus less risky, potential returns diminish.

Ultimately, this is a recent example of how options can offer more than just leverage, but a totally different methodology that can produce outsized profits. In the future, we will dissect the various spreads and the profit engines that drive them. However, before we begin detailed discussion of various option strategies, option traders must have a sound understanding of various volatility principles as well as the impact that the Greek’s have in the world of options. In closing, I will leave you with the muse of George Orwell, “To see what is in front of one’s nose requires a constant struggle.”

If you would like to continue learning about the hidden potential options trading can provide please join my FREE Newsletter: www.OptionsTradingSignals.com

J.W. Jones is an independent options trader using multiple forms of analysis to guide his option trading strategies. Jones has an extensive background in portfolio analysis and analytics as well as risk analysis. J.W. strives to reach traders that are missing opportunities trading options and commits to writing content which is not only educational, but entertaining as well. Regular readers will develop the knowledge and skills to trade options competently over time. Jones focuses on writing spreads in situations where risk is clearly defined and high potential returns can be realized.