Posts

Crude oil has been trading ways for the past year between the 2011 high and low. The trading range through 2012 has been contracting with a series of lower highs and higher lows. This pennant formation because it is taking place after an uptrend is a bullish pattern with $110 and possibly even $140+ per barrel in the next 6-18 months.

If you look at the weekly investing chart of crude oil the key support and resistance levels area clearly marked. A breakout of the white pennant will trigger a move to the next support or resistance level. And judging from the positive economic numbers not only form the USA but globally the odds are increased for the $110+ price target to be reached sooner than later.

Crude Oil Price Chart – Weekly Investing

Oil Investing


Crude Oil Price Chart – Daily short term Analysis & Target

If we zoom into the daily chart and analyze price and volume you will notice the $100 per barrel level is potentially only 2-3 days way… But keep in mind whole numbers (decade & Century Numbers) naturally act as support and resistance levels. So when the $100 century price is reached there will be a wave of sellers with fat thumbs who will slam the price back down to the $96 and possibly back down to the $92 level before oil continues higher.

Oil Trading


Utility Stocks – XLU – Weekly Investing Chart

The utility sector has done well and continues to look very bullish for 2013. This high dividend paying sector is liked by many and the price action speaks for its self… Keep in mind you can view my actual watchlist of stock and ETFs I trade in real-time with my analysis free: https://stockcharts.com/public/1992897

XLU Trading


Energy Sector Weekly Investing Chart

Energy stocks which can be followed using the XLE exchange traded fund (ETF) typically leads the price of oil. Looking at energy stocks we can see that they are outperforming the price of crude oil and on the verge of breaking out of a large Cup & Handle pattern. If so then $90 is the next stop but prices may go much higher in the long run.

XLE Energy Stock Trading


Energy Stocks and Crude Oil Conclusion:

In short, crude oil is stuck in a large trading range much like gold and silver which I just wrote about here: http://www.thegoldandoilguy.com/precious-metals-miners-making-waves-and-new-trends/

Once a breakout takes place on either the white or yellow lines on the first crude oil weekly chart we should see oil, energy and utility stocks start making some big moves. Depending on the direction of the breakout (Up or Down) it must be played in that direction to generate substantial profits obviously.

Get my daily analysis, updates and trade alerts here: www.TheGoldAndOilGuy.com

Chris Vermeulen

The last week of the year volume tends to be light due to the fact that big money traders are busy enjoying the holidays and waiting for their yearend bonuses.

I was not planning on doing much this week because of the low volume but after reviewing some charts and risk levels on my top 5 trading vehicles I could not help but share my findings with everyone last Friday.

You can see what I talked about on Friday here: http://www.thegoldandoilguy.com/articles/holiday-short-squeeze-oil-trade-idea/

This Wednesday turned out to be an exciting session with all 5 of my trade ideas moving in our favour right on queue.

Charts of the 5 investments moving in the directions we anticipated …
– Dollar bounced off support

– Stocks are topping and selling off today

– Oil looks to have topped and is selling off

– Gold and Silver are moving lower

– VIX (Volatility Index) just bounced


Many of my readers took full advantage of my recent analysis and trade ideas which is great to hear.  All the different ways individuals used to make money from Friday’s analysis is mind blowing…

The most common trade is the oil one with most traders adding more to Tuesday when the price reached its key resistance level on the chart. Also many traders took partial profits Wednesday locking in 3% or more in two days using the SCO ETF.

It’s amazing how many people like to trade the vix using ETFs. The best trade from followers thus far was an 8% gain in TVIX which was bought 4 days ago anticipating the pop in volatility which I had been talking about last week. Keep in mind ETFs for trading the vix are not very good in general. I stay away from them, but TVIX is the best I found so far.

Currently stocks are oversold falling sharply from the pre-market highs. Meaning stocks have fallen too far too fast and a bounce is likely to take place Thursday.

Also we saw some panic selling hit the market today with 14 sellers to 1 buyer. That level tells me that the market needs some time to recover and build up strength for another selloff later this week or next. We will see this pause unfold when the SP500 drifts higher for a session or two with light buying volume. This will confirm sellers are in control and give us another short setup.

In my Wednesday morning video I explained how/where to set stops when using leveraged ETFs because I know 90% of traders using them do not have a clue as to how to do this and they get shaken out of their trades just before a top or bottom. So if you want to learn more about it watch this morning’s video please: http://www.youtube.com/watch?v=lDagN5Vpvys

I hope this helps you understand things more… Over time you will pickup on a lot of new trading tips, tools and techniques with this free newsletter so just give it time and keep trades small until you are comfortable with my analysis.

ONE TIME OFFER for 2012!
Learn to Trade While Making Money
http://www.thegoldandoilguy.com/specialoffer/2012TradeIdeas.html


How To Trade Gold & Oil – The past couple weeks have been tough for most investors. The recent light volume rallies which have taken place in gold, oil and stocks has been generating mixed signals for technical analysts like myself. In order avoid a large draw down on your trading capital you must focus on the long term intraday charts.

What is a long term intraday chart you ask? It is simply a 4 or 8 hour candlestick or bar chart. For example the charts below in this report are 4 hour charts. So each candlestick represents 4 hours.

Why should you use these long term intraday charts instead of say a daily chart? There are four main reasons for this:

  1. If you used a daily chart then this information would be condensed showing you the daily high, low, open and closing prices. While the 4 hour futures chart shows you large multi intraday chart patterns that most traders would never see…  Patterns not seen by the average investor have a higher probability of working in your favour. Also these patterns are much larger than just normal intraday patterns which you see on the 5, 10, or 60 minute charts. Remember the larger the pattern the more potential profit there will be.
  2. These longer time frames allow us to follow gold, silver, oil and stock indexes around the clock 24/7 using futures contracts. Think about it… regular trading hours from 9:30am – 4pm ET only allows you to see 1/3rd of the price action each day. That means you are only seeing parts of larger patterns while the 24/7 contracts show you ALL Price Action.
  3. The last reason you must use futures charts is for the volume readings. Futures show real volume levels which can be used for trading. So the volume you see on ETFs will not have the proper volume levels for that specific commodity or index. More times than not it almost the opposite…
  4. My last reason for trading long term intraday futures charts is because the price of the underlying commodity or index moves true while the ETFs which try to shadow these commodities generate false breakouts and breakdowns on a regular basis. Watch my video about this here: http://www.thetechnicaltraders.com/ETF-trading-videos/TTTOct19Oil/index.html


Let’s take a look at the charts…

Gold Futures Contract – 240 Minute (4 Hour) Chart

Gold finally broke down from the bearish rising wedge which it had been forming through late September until mid October. I know the majority of traders, investors, and financial newsletters have already positioned themselves either long or short the metal as they anticipate the next major move.

I will agree that a large move either up or down is just around the corner but what sets me apart from others is the fact that I don’t bet my hard earned money when the odds are 50/50. I don’t pick tops or bottoms; rather I wait for a clean break out or low risk entry point. Only then will I take action. Until the blue box on the chart has been broken with some type of retest I will continue to observe and analyze the chart of gold.

How To Trade Gold


Crude Oil Futures Contract – 240 Minute (4 Hour) Chart

The past month crude oil trading has been very profitable for subscribers and me. We shorted crude oil using an inverse etf in September which moved over 20% in our favour within a few trading sessions. And just last week we shorted it again for a 7.5% move in less than 24 hours.

Overall I am still bearish on oil but have moved to cash until I see another high probability setup unfolding. The recent price action in crude oil makes the odds about a 50/50 bet as to which way it will break next. This is why I have moved back to cash and pocketed the quick gain.

How To Trade Oil


SP500 Exchange Traded Fund – 240 Minute (4 Hour) Chart

This chart is not the SP500 futures contract. This is just the SPY ETF but what I wanted to show was how the market was showing mixed signals. The past couple weeks price has been broadening and this can be taken two different ways…

More times than not it is seen as a bearish pattern and price generally falls afterwards. But in rare situations which I think we could be experiencing now this broadening price action can be very bullish, meaning much higher prices ahead. So I continue to observe and prepare for a possible trade setup.

How To Trade Indexes


Weekend Gold, Oil and Stocks Trend Conclusion:

In short, I feel the market is on the verge of a strong move. The problem is that price action, market sentiment and economic news are all giving mixed signals…

The best position right now is in cash and if something unfolds this week to our favour, then we will get involved but I am not going to take a 50/50 guess on what the next move is until the odds are in favour to one side or the other.

August until now (October 24) the SP500 is down -3.7% and Gold is up 1.1%, Silver is down 20% and oil is down -7.2. Subscribers of my newsletter have pocketed over 38.5% in total gains using my simple low risk ETF trading alerts.

Get My FREE Bi-Weekly Trading Reports and Videos by joining my free newsletter here: www.GoldAndOilGuy.com

Chris Vermeulen

If you have a website and would like these reports and videos displayed instantly on your financial website use my Best Free Financial RSS Feeds.

Commodities have and continue to be a fantastic trading vehicle for those who can stomach volatility. After last year’s market crash most commodities pulled back to normal if not lower than normal trading ranges. This allowed us to enter the market at 10+ year lows for natural gas.

If we look at the weekly chart for gold, silver, oil, natural gas and the CRB commodity index we can see that commodities in general look ready to skyrocket higher approximately 34% on average in the next 4-12 months.

Take a looks at this chart of gold. While this chart shows the basic technical analysis of the price of gold you can see the completion of the Cup & Handle pattern which is VERY BULLISH. Also you can see gold broke to a new high. While I don’t like to trade new highs it’s hard not to want to buy into this breakout. Most traders should be long gold already, but if you are not, you have a couple of options. Buy into this breakout with a tight stop or wait for a pullback and buy on a test of the breakout. Personally I am waiting for a pullback (test of breakout) before I add more to my position.

Trade Spot Gold

Trade Spot Gold

Silver has been strong but has not held up its value as well as its big sister (gold). As you can see silver must break through two more major resistance levels before making a new multi year high. Overall silver still looks strong and I will be waiting for a low risk setup for us to add more to our positions.

Trade Spot Silver

Trade Spot Silver

Crude Oil looks like a perfect Cup & Handle pattern and I am now looking for a low risk entry point which should form before we get a breakout it to the up side. I can see oil quickly moving to the $100 per barrel level once we get a breakout.

Trade Crude Oil

Trade Crude Oil

Natural Gas had a perfect shakeout in August and many aggressive traders who follow these reports followed my lead and bought natural gas around $2.90 (10 year lows). This was the move I wrote about for nearly 3 months as we waited for it to unfold. Down side risk was around 15% so it was not my signature low risk setup but this rally has been exciting. Currently natural gas is trading at resistance and taking some money off the table is a great play here. You will never go broke taking profits.

Trade Natural Gas

Trade Natural Gas

The CRB Index looks very similar to crude oil. Overall commodities look to be in the final stages of basing (bottoming) and from simple technical analysis the next more could be around 30-34%.

CRB Index

CRB Index

Commodity Trading Conclusion:
Overall commodities look like a great buy. We are seeing precious metals moving up strongly and gold making a new high which is very exciting as our golden rock stock plays push higher and our commodity ETF play continue higher as well.

Energy is a mixed bag. Oil looks bullish and ready for a nice rally, while natural gas looks a little top heavy as it trades just under resistance.

We continue to stay in the market and are waiting for another round of low risk setups which could happen in the next few days if we get favorable price action. Remember to move your stops up to lock in gains. There is nothing worse than giving back a large portion of your profits when you don’t need to.

If you would like to receive my free weekly trading reports please fill out this form:


First Name:
Email:


Chris Vermeulen

How did it get here, and where is it going?

By Marin Katusa, Senior Editor, Casey Energy Opportunities

What a difference a year makes.

While March lions and April showers were at work in 2008, so were these factors in the U.S. and global economies:

 The Dow Jones Industrial Average remained steady above 12,000.

 The leading indicator of existing home sales was down over 21% from the previous year, and the official unemployment rate was just beginning its upward creep by crossing the 5% mark.

 The first official admissions of the “R” word. In early April 2008, the International Monetary Fund (IMF) declared a 25% chance of a global recession, and Federal Reserve Chairman Ben Bernanke told Congress that gross domestic product “could even contract slightly.”

 The novelty of bailouts began. Bernanke also assured Congress that the Fed’s emergency authorization of a loan against $29 billion of Bear Stearns assets wasn’t putting taxpayer money at risk: “I feel reasonably confident that we’ll be able to recover all the principal and indeed some interest, and there is some chance of even upside beyond that.”

 The dollar’s six-year slide against the euro, hitting its lowest ever at $1.60 in late April. It also fell below the 7-yuan mark in China for the first time.

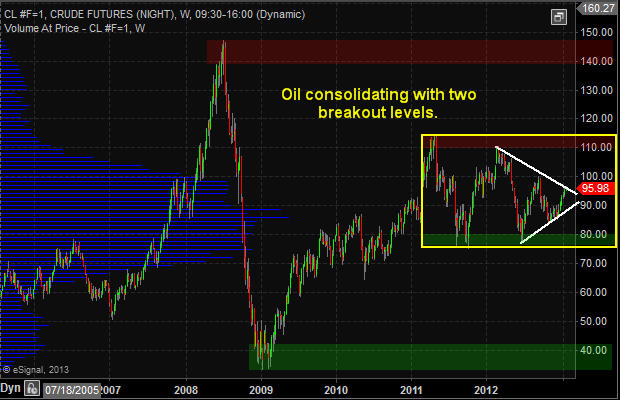
 And oil, comfortably above $100/barrel, was heading for its summer crest of $147.

A scant 12 months later, the Dow is trying to stagger back from a plunge to 6,500. Home sales are hinting a possible turnaround, unemployment (even the official, conservative figures) is expected to reach double digits before long, “recession” and “bailout” are household words (often accompanied by four-letter ones), the dollar is recovering… and a barrel of oil is worth half that hundred dollars. Hardly worth pulling out of the ground.

What happened? And even more important for us as investors, what’s going to happen?

The Casey Energy Opportunities team pulled together the pieces of the oil sector picture that other sources tend to scatter or ignore. We’ll give you a broader understanding of the drivers within the oil industry, the markets in which they operate, and how you can use that knowledge to push your profits upward.

The Oil Industry Now: A Rock, a Hard Place, and a Supply Glut That Isn’t

Everyone who drives a car or heats a home with petroleum has welcomed the fall in oil prices from their high in the summer of 2008.

While it’s hard to argue that filling your tank at $2 per gallon is a lot easier on the wallet than $4 or $5 per gallon, the broader economic effects of such low oil prices are troubling.

Leading the concerns is the drop in oil exploration and drilling that accompany a drop in price. Below the $50/barrel mark – and for many companies the bar is closer to $65 even for conventional fields – oil producers typically spend more money getting oil out of the ground than they can recoup by selling it. At the same time, turbulent financial markets have tightened credit. These two factors have pressured producers to allocate exploration budgets away from drilling projects and toward meeting debt obligations and day-to-day operating costs instead.

The plunge in prices has consumed the cash buffers of even the major oil companies. ConocoPhillips, for example, announced in January that along with eliminating 1,300 jobs and writing down $34 billion in assets, it was also planning to cut its 2009 investment budget by 18%. Exploration projects are part of both writedowns and spending cuts. The results of curtailed exploration are two-fold. First, some oil companies will be simply unable to survive the economic crisis. Second, supply in the longer term is being sacrificed to stay afloat now.

Storage facilities are bulging. The chart below shows the contents of the Cushing, OK, storage facility — where NYMEX deliveries take place — have recently doubled from their average 2008 volume. Along with a host of other facilities around the world, it got this way because of an unusually dramatic contango at the beginning of 2009. (A contango is a kind of market inversion, when the current [spot] price dips lower than the future price.)

In January, the spot price of oil plummeted as low as $37/barrel, while futures for July delivery were trading for $52. That meant if an oil company could buy and store product for seven months, it could lay out $37/barrel and be guaranteed a profit of $15 – or 40%, minus costs – in July. And indeed the buying frenzy took off, reinforcing the decision to turn off the drills.

So for the moment, we are artificially flush with oil, and demand has dropped as the global economy will likely shrink for the first time since World War II. It’s no surprise that oil prices have been staying down.

Many analysts say we won’t feel the effects of declining exploration for a few years. But the numbers are emerging already. According to the U.S. Energy Information Administration (EIA), non-OPEC countries demonstrated an average annual growth in supply of 570,000 barrels/day from 2000 through 2007. In contrast, they recorded a drop last year of some 300,000 barrels/day.

At the same time, OPEC appears to be conforming to its production cuts of 4.2 million barrels/day, begun in September 2008. The oil cartel is known to announce cuts that its members don’t actually follow; it’s in their economic best interest, if only in the short term, to sell all they can. But this time, oil has plunged far below levels to sustain their economies. Even Saudi Arabia expects to run a budget deficit this year.

OPEC, which produces about 40% of the world’s oil, would like to see prices around $75/barrel, at least. But the fragile global economy would have a difficult time absorbing such a price at the moment, and the cartel decided against further production cuts when it met in March. In fact, some three weeks later, Saudi Arabia actually announced a price cut on all its grades of crude to European, North American, and Mediterranean markets – a dramatic attempt to spur demand amidst high inventories.

So, entwined as it is with the economy, the oil industry is currently in a conundrum. The fix it requires – higher prices for its product – will choke the framework in which it operates.

At the same time, we’ve got supply problems ahead.

How Did We Get Here Anyway?

Like many aspects of the markets, movements in price are driven partly by real factors and partly by perception. Rags-to-riches-to-rags-to-riches Texas oilwoman Sue Sanders summed it up when she noted wryly in her 1940 autobiography that “nothing succeeds like reports of success.”

Last year’s run-up of oil was no exception: part real, part report. Some of the real factors:

 The weak U.S. dollar. The United States is not the only country that buys oil in U.S. dollars. The price per barrel is pegged to it, in fact. When the dollar is weak, the cost of U.S. exports drops; and indeed by December 2008, the U.S. trade deficit had fallen to its lowest in nearly six years ($39.9 billion, according to U.S. Commerce Department data). However, a weak dollar means it takes more dollars to buy a barrel of oil. Global concerns over the strength of the U.S. economy, including America’s ever-rising level of debt, had undermined the dollar to the point that OPEC members began to murmur about dumping it for the euro or a basket of currencies.

 Geopolitical turbulence in oil-producing countries. The Iraq war, oil-related militancy in Nigeria, and Iran-Israel-U.S. posturing over nuclear issues were hotspots in the first half of 2008. The average nightly news covered casualties in Iraq, but industry watchers tracked attacks on pipelines and oil facilities. Likewise, in Nigeria, sabotage and oil worker kidnappings by militant groups such as the Movement for the Emancipation of the Niger Delta (MEND) regularly shut down facilities to repair, negotiate, or improve security. And as spring warmed up, so did the war of words between Iran and Israel. By early July, Iran had gone so far to indicate it would move against shipping in the Persian Gulf if attacked. The United States would have moved next, of course… thus driving up the price of oil in the jittery oil markets, which depend on Persian Gulf shipping lanes.

 Unusually low crude and gasoline supplies entering the 2008 summer driving season. In early April, the EIA reported significant drops in supply – gasoline declined by 4.53 million barrels and crude oil by 3.2 million barrels, a one-two blow that surprised and worried industry watchers. Behind the gasoline slump were lower refinery margins, called crack spreads. In mid-March, when refineries would normally be coming off their maintenance schedules to churn out gasoline for summer driving, the margin for turning a barrel of crude into gasoline was negative for the first time in three years. Refineries sought profits in other oil products, and the markets responded to the expected imbalance in supply and demand.

 High demand. China is a stand-out here, and for more than its usual energy appetite. China has a penchant for aiming to break records – from its goals in five-year plans and building projects to its haul of Olympic medals – and in the first half of 2008, it was visited by some dramatic examples: a great earthquake and major snowstorms, events that disrupted the country’s energy industry. Combine that with the fact that China was also preparing for the Beijing Olympics in August, and it’s easy to understand why it was buying oil very heavily until mid-summer.

On the perception side of price drivers, it’s hard to overlook the fact that the market push stayed strong in the face of increasingly gloomy economic data. Casey Research was earlier than most in predicting the economic crash (we published reports such as “The Coming Currency Crisis” in June 2006), but by spring 2008, even officialdom was dancing around the word recession.

Normally, news of burgeoning foreclosures, plummeting home sales, spiking personal and business bankruptcies, rising unemployment, and other economic indicators would tend to exert a bearish influence. After all, consumers generate 70% of U.S. economic activity, and if they stop or cut back on driving to work or the shopping mall, telephone relatives or business partners instead of flying out to see them, reduce purchases of items containing plastics, turn down the thermostat, and other weather-the-storm measures, oil consumption should decline.

It took months for all these drivers to realign – but as we all know, they did, and then some. The chicken-and-egg debate, whether oil’s sky shot triggered or portended the economic debacle in the closing months of 2008, will require more distance and data to resolve. But it’s true that the dollar had started its comeback by mid-summer, supply had caught up, geopolitics had settled a bit, China backed off on its buying, no major hurricanes hit – but economic realities did.

Meanwhile, Congress jumped up and down and cried “Speculators!” “OPEC!” “Oil producers!” in tidy sound bites.

The Next Big Plays: Where You Need to Be

Oil companies are influenced by the range of market drivers and economic conditions according to size. The junior oil producers, those with market capitalizations of $250 million or less, have the small-business advantage of flexibility when times are good. These times aren’t good, of course, and even well-managed juniors with good projects are in trouble. Their vulnerability is in the credit market. You’ve likely heard of credit lines being revoked and refinancings denied to people with impeccable credit. Now imagine pitching a drill project without a wallet full of assets ready to lay on the table.

Mid-tier producers, with market caps between $250 million to $2 billion, will look to mergers and acquisitions to survive. The majors ($2-20 billion market cap) and Big Oil (over $20 billion) will also be shopping. With low oil prices shutting down exploration, development, and even production, these companies will be looking to replace their reserves instead by purchasing smaller, solid companies with proven production. It’s simply cheaper.

We see two ways to profit from this trend.

First, we buy shares in undervalued, producing companies that are profitable even below $40/barrel, are best of peer, and own large reserves. These are the companies that Big Oil will be looking to acquire. One such company, an oil sands producer, is currently a part of the Casey Energy Opportunities portfolio.

Second, we believe that owning a potential consolidator is the best position. As debt load and low commodity prices overtake them, junior producers will be forced to consolidate their projects. We currently own one such candidate, and are scouting for others with such muscle. Consolidators will be purchasing projects from the bank at 25 to 30 cents on the dollar.

Our tactics have already paid off handsomely in the last six months: all our recent recommendations have been on fire. A few tripled their value, and one generated a return of 540%.

As we’ve seen, supply problems are looming, no matter what timetable of Peak Oil you may believe in. With increased demand inevitably come higher prices. Our approach at Casey Energy Opportunities positions us to take advantage of the trend in both the short and longer term. And we guide our subscribers not only when to buy or sell, but also when to take profits and a “Casey Free Ride” to eliminate risk.

We’d like to offer you the opportunity to kick the tires of Casey Energy Opportunities RISK-FREE for 90 days, with 100% money-back guarantee. Click here to give it a try.

Rising Commodities, Falling Stocks & Risk Reward Ratio

Trading Risk/Reward

The past few months have been absolutely crazy in the financial markets. Financial advisors and banks are taking a beating from both the market condition and clients as individuals around the world are losing 30+ of their investments. We have seen oil prices drop over $110 per barrel from the high (73% decline), and the US dollar tumbled down to 71 and rebounded to 88 (23% gain) all in the mater of months.

Risk Management is what is needed if we want to stay in the game over the long term. Follow strict risk/reward rules is a must so that we don’t not get caught chasing stocks and funds only to have them turn around on us a few days later.

Focusing on keeping risk low for potential trades is crucial for turning a profit over the long run. In short I look for a basket of indicators including candle patterns and volume to be in favor when buying or selling a stock or fund. When a fund generates a buy signal I wait for a low risk entry point near my support or resistance level depending if I am looking to go long or short. I need to see a perfect setup so that the odds are favoring my side. Only then will I take a stab at the market. The biggest issue with this is that I do miss a lot of good trades, but the key here is that most of my trades are profitable and that is what makes it so powerful. I would rather make 20 trades a year, than 150 trades and make the same profits.

This Weeks Analysis on Gold

Gold continued its push higher last week getting a lot of investors and traders all excited. The daily chart does look strong and it is currently on a buy signal. But buying at this level is much too high of a risk.  The price of gold is trading at the top of its 4 month trading range which previously led to a 20% selloff in bullion. Our support trend line is 10% away from the price of gold making it out of reach still. I trade reversals when risk is only 3% from my stop/support price.

Daily Gold GLD Chart


Gold Stocks

Gold stocks have been struggling to move higher and last Friday gold made a nice move higher while gold stocks sold down. My last article talked about how trading gold (GLD) may be a better investment then gold stocks right now simply because of the bearish broad market. The broad market looks like it’s about to make another leg lower and when the broad market sells off, it pulls all stocks with it. The daily chart of the HUI Gold Bugs Index shows precious metal stocks moving sideways while gold pushed higher. When gold stocks start to underperform the price of gold I tighten my stops and mentally prepare myself for gold to pull back. The smart money always seems to move in and out of stocks faster than the commodity which is a topic I mentioned in a previous report as well.

Gold Bugs Index Daily Chart


Crude Oil Analysis

Crude Oil has been under continuous selling pressure for the past 7 months and this is the first buy signal I have had for it since it topped back in July 2008. The weekly chart is very close to a buy signal. If you look at the weekly chart of USO crude oil fund you will see that volume has shot through the roof which generally indicates a turning point. Also the MACD indicator is about to cross which will put this fund on a buy signal if things go well all of next week. The support trend line is trending up slightly and the down trend line is holding the price inside a small triangle. If the price breaks out and all my indicators are putting the odds in favor of a long trade, then we will be looking for a buy point on the weekly chart in the next few weeks. The weekly trading signals are good for intermediate and long term traders.  

Crude Oil (USO) Weekly Trading Chart

Conclusion:

The broad markets continued to move lower last week as it remains in a long term bear market. For those looking to take advantage of gold, silver and oil movements I recommend sticking with the commodity funds as they can increase in value while the broad market is selling off. The daily chart of the hui gold bugs index shows this clearly as gold stocks in general are underperforming the price of gold right now. There is an opportunity for oil to make a move higher if things come together in the next couple of weeks but until then we will be patient and let the trade come to us.

If you have any questions please feel free to send me an email. My passion is to help others and for us all to make money together with little down side risk.

I look forward to hearing from you soon!

Chris Vermeulen

The Gold and Oil Guy

Chris Vermeulen

Gold prices shot up on Friday as investor’s move their money into a safer investment as the broad market continued it crash the day before breaking the October bottom. Once the price of gold climbed over the $760 mark which was a short term resistance level the price shot higher as new buyers jumped in and short covering took place pushing gold to climb $57 in one day which you can see in the chart below.

Spot Gold Prices – 3 Day Intraday Chart
Spot Gold Price

Now, looking at the daily chart of gold below, it appears that it has put in a double bottom with a nice rally higher. Also confirming this move may not be over yet is the MACD cross over and the strength of gold. Its best to waiting for a low risk setup before any money should be put to work. We are getting close to possible buy signals if things continue to hold up over the next week or so. Gold will find resistance between $800 – $825 and could take a breather for a few days which could provide a great setup if we are lucky.

Daily GLD Gold Price Chart

Gold stocks shine as they rally big on Friday out performing the price of gold and possibly putting in a higher low for the HUI which could be the start of an upward trend. Keeping a close eye on the performance of gold stocks will help confirm a low risk setup for trading gold (GLD, DGP, and Spot Gold). If gold stocks are performing well during a gold buy signal I generally put more money to work on that trade as opposed to gold stocks underperforming the price of gold.

Daily Gold Bugs Chart (Gold Stocks)

A longer term look at gold stocks performance which is shown in the chart below is the fact that they are bouncing off long term support which has been tested 5 times. This is very bullish for gold and gold stocks as well.

Monthly Gold Stock Chart

Slippery Oil Prices

Oil Traders cannot believe the slide in oil since June this year. Last Thursday oil closed below $50 which is a long ways of its $150 high not to long ago. A couple interesting things show up on my oil chart which I thought are worth pointing out. Obviously the price of oil is severely oversold and due for a dead cat bounce if not a “V” shaped bottom. But although prices continue to slide the momentum is starting to shift to the up side. The MACD is trying to move higher which is a good thing and also the fact that oil is at the bottom of it channel. Also energy stocks are out performing the price of oil like crazy!!! This is extremely bullish and a bounce in oil will send energy stock soaring. I will note that a lot of energy stocks pay a dividend and with their share prices being pushed down to these extreme levels, investors are starting to buy because the dividend rate is so high and most of these companies make solid earning year after year so at these prices the shares look attractive to many.

Oil Trading Chart (USO)

Conclusion:
I don’t try to predict market direction because it’s a fools game, I do think we have some exciting times just around the corner if the market does find support in the next week or so. I have been in cash since August waiting for a setup but volatility is ridiculously high and I don’t put my money to work if I’m risking more than 3% on a trade. Gold Stocks are starting to have money flow back into them and oil is starting to look like its downward move is almost exhausted. I continue waiting for a proper setup with low risk as I believe in taking the safe middle section of trends and not trying to pick tops or bottoms.
I am a full time daytrader and swing trader specializing in trading GLD, GDX, XGD.TO, SLV and USO. I provide my trading charts, market insight and trading signals to members of my newsletter service.

If you have any questions feel free to send me an email.
Email: Chris@TheGoldAndOilGuy.com