Posts

How To Trade Gold & Oil – The past couple weeks have been tough for most investors. The recent light volume rallies which have taken place in gold, oil and stocks has been generating mixed signals for technical analysts like myself. In order avoid a large draw down on your trading capital you must focus on the long term intraday charts.

What is a long term intraday chart you ask? It is simply a 4 or 8 hour candlestick or bar chart. For example the charts below in this report are 4 hour charts. So each candlestick represents 4 hours.

Why should you use these long term intraday charts instead of say a daily chart? There are four main reasons for this:

  1. If you used a daily chart then this information would be condensed showing you the daily high, low, open and closing prices. While the 4 hour futures chart shows you large multi intraday chart patterns that most traders would never see…  Patterns not seen by the average investor have a higher probability of working in your favour. Also these patterns are much larger than just normal intraday patterns which you see on the 5, 10, or 60 minute charts. Remember the larger the pattern the more potential profit there will be.
  2. These longer time frames allow us to follow gold, silver, oil and stock indexes around the clock 24/7 using futures contracts. Think about it… regular trading hours from 9:30am – 4pm ET only allows you to see 1/3rd of the price action each day. That means you are only seeing parts of larger patterns while the 24/7 contracts show you ALL Price Action.
  3. The last reason you must use futures charts is for the volume readings. Futures show real volume levels which can be used for trading. So the volume you see on ETFs will not have the proper volume levels for that specific commodity or index. More times than not it almost the opposite…
  4. My last reason for trading long term intraday futures charts is because the price of the underlying commodity or index moves true while the ETFs which try to shadow these commodities generate false breakouts and breakdowns on a regular basis. Watch my video about this here: http://www.thetechnicaltraders.com/ETF-trading-videos/TTTOct19Oil/index.html


Let’s take a look at the charts…

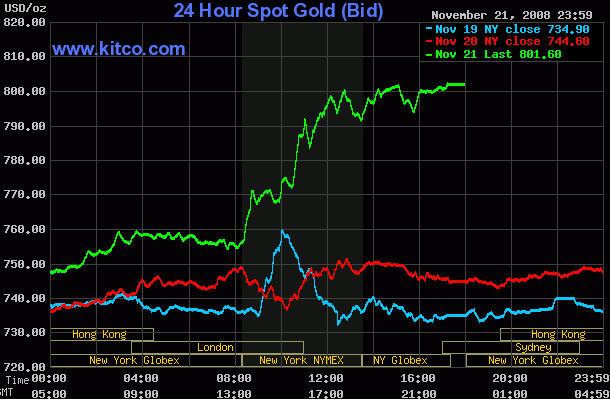
Gold Futures Contract – 240 Minute (4 Hour) Chart

Gold finally broke down from the bearish rising wedge which it had been forming through late September until mid October. I know the majority of traders, investors, and financial newsletters have already positioned themselves either long or short the metal as they anticipate the next major move.

I will agree that a large move either up or down is just around the corner but what sets me apart from others is the fact that I don’t bet my hard earned money when the odds are 50/50. I don’t pick tops or bottoms; rather I wait for a clean break out or low risk entry point. Only then will I take action. Until the blue box on the chart has been broken with some type of retest I will continue to observe and analyze the chart of gold.

How To Trade Gold


Crude Oil Futures Contract – 240 Minute (4 Hour) Chart

The past month crude oil trading has been very profitable for subscribers and me. We shorted crude oil using an inverse etf in September which moved over 20% in our favour within a few trading sessions. And just last week we shorted it again for a 7.5% move in less than 24 hours.

Overall I am still bearish on oil but have moved to cash until I see another high probability setup unfolding. The recent price action in crude oil makes the odds about a 50/50 bet as to which way it will break next. This is why I have moved back to cash and pocketed the quick gain.

How To Trade Oil


SP500 Exchange Traded Fund – 240 Minute (4 Hour) Chart

This chart is not the SP500 futures contract. This is just the SPY ETF but what I wanted to show was how the market was showing mixed signals. The past couple weeks price has been broadening and this can be taken two different ways…

More times than not it is seen as a bearish pattern and price generally falls afterwards. But in rare situations which I think we could be experiencing now this broadening price action can be very bullish, meaning much higher prices ahead. So I continue to observe and prepare for a possible trade setup.

How To Trade Indexes


Weekend Gold, Oil and Stocks Trend Conclusion:

In short, I feel the market is on the verge of a strong move. The problem is that price action, market sentiment and economic news are all giving mixed signals…

The best position right now is in cash and if something unfolds this week to our favour, then we will get involved but I am not going to take a 50/50 guess on what the next move is until the odds are in favour to one side or the other.

August until now (October 24) the SP500 is down -3.7% and Gold is up 1.1%, Silver is down 20% and oil is down -7.2. Subscribers of my newsletter have pocketed over 38.5% in total gains using my simple low risk ETF trading alerts.

Get My FREE Bi-Weekly Trading Reports and Videos by joining my free newsletter here: www.GoldAndOilGuy.com

Chris Vermeulen

If you have a website and would like these reports and videos displayed instantly on your financial website use my Best Free Financial RSS Feeds.

As we all know there is an unlimited amount of ways to trade the financial markets. Each person sees the market in a different way, has different skill sets, trading experience and risk tolerance levels. While some individuals create and use complete systems to make money there are some very basic trading strategies which still work well and require nothing more than basic charting, patients and a little money management.

Let me explain:

SPY – SP500 Index Trading Fund

You can clearly see the longer term trend which is down (blue trendine). But from simply drawing a couple trendlines and looking at the MACD (momentum) indicator you can see there is a possible trend reversal taking place. So far the SPY has broken out of its down trendline with a 4 day pop, and it’s now pulled back down to test support. A close below the trend line or the 50MA would be the exit points if the market did start to go south.

The SP500 is still stuck under major resistance, its 200 day moving average. But is trading above key support levels (20MA, 50MA and Trendline). I can feel the tension in the market between traders and we are about to see a big move once a breakout to the upside or down side is established. At this time its best to be in cash or have a small position with a protective stop in place. Once a trend starts there should be some low risk entry points along the way. If we see a strong reversal to the upside On Monday or Tuesday I would expect big buyers would step in to catch this new trend up.

GLD – Gold ETF Trading Fund

Looking at the price of gold we can see the trend is still down along with the momentum. A breakout would be the first step towards a possible entry point but I prefer to wait for a pullback after the breakout has taken place. Once we get a test of support I look to enter a position once there is a strong reversal candle to the upside. From there I draw a new support trend line from the previous low and connect it to the new pivot low (bottom of reversal candle). That becomes my new protective stop.

Gold still has some work to do before I would even be interested in taking a long position for a swing trade. But on a short term time frame (intraday charts) gold looks to be forming a low risk setup which I hope unfolds for my subscribers this week.

USO – Crude Oil Trading Fund

Oil has been trading in a large bearish pennant for the past 2 months and it is nearing the apex of this pattern. The longer term picture of oil is bearish but the most recent dotted trend line and the 20/50MA crossover is signaling some strength. Also the momentum for oil is positive and that helps support the price also. Again if this was to breakout to the upside I would wait for a low volume pullback to test the breakout level, then enter on a reversal back up.

Oil is one of the more challenging commodities to trade because it is affected by the US Dollar, Political Events, and Weather. In short, even if you had the analysis and timing correct there are other factors which move the price of oil on a regular basis that could quickly turn the trade against you. That being said, keep trades small when trading oil.

How to Trade Trend Line Breakouts Low Risk Trading Setups:
In short, trading can be complex, simple or somewhere in between. You can spend 14 hours or 20 minutes a day analyzing it depending on what investments you trade, whether you’re trading full time or just checking up on longer term investments.

This analysis and basic strategy shown above can be profitable if followed correctly and works for stocks, commodities and indexes. It’s just to show how simple one can swing trade the market using very basic analysis. Personally I use a much more complex strategy incorporating 15+ other data points which allows for precise entry and exit points.

If you would like to get my Low Risk Trading Newsletter visit my services at:
www.TheGoldAndOilGuy.com – ETF Trading – Index, Sectors & Commodities
www.FuturesTradingSignals.com – Futures & ETF Trading – Index & Commodities

Chris Vermeulen

.

GET MY FREE WEEKLY TRADING REPORTS DELIVERED IN YOUR INBOX

I hope everyone had a great weekend and Easter Holiday!

This is quick update as its Easter Sunday and it’s a time to relax with the family 🙂

Below are two charts and my thoughts on what I am looking for in the coming days and weeks.

Gold Exchange Traded Fund – Daily Chart
As you can see the price action of gold has been trading within a few patterns the past couple months. First we saw a nice ABC Retrace correction and now it looks like a possible reverse Head & Shoulders or Wedge pattern is forming.

All three of these patterns are bullish but resistance must be overcome before I will start putting my money to work.

NYSE & NASDAQ Indexes – Daily Charts
We saw the broad market trade sideways for the majority of the week. As usual we had a pre-holiday pop in prices with the week closing slightly positive for stocks. These gains are generally given back the following week as volume picks back up.

The one thing that has me scratching my head is that the major indexes like SP500, Dow, NASDAQ and Russell 2000, all stayed below their previous weeks high. But the NYSE as shown below as the top chart clearly broke out to a new high.

I look at the NYSE as leading indicator and this makes me think we could see stocks grind higher right into earning season. All we can do at this point is wait for more data points on the chart and continue analyzing the market one day at a time.

Weekend Trading Conclusion:
As I mentioned last week, the market is over extended as we enter earning season. The market is in the same situation as we saw going into the January earning season.

I do not think we will have a huge pullback but I think a 3-5% correction is likely in the coming days or week. Once we get a pullback we should see support around the 30 or 50 day moving averages and then see the market head toward new highs once again.

The precious metals sector is getting a lot of attention because of the whistle blower on JP Morgan stating that metals are seriously manipulated with a huge amount of short positions still in place. I think this could be helping this sector and I hope we get a low risk setup in the coming week or two.

If you would like to Receive My ETF Trading Signals please visit my website at http://www.thegoldandoilguy.com/specialoffer/signup.html

Chris Vermeulen

Understanding market psychology is crucial for a trader’s success. But so many people get caught up in the daily market volatility, media coverage and “noise” of the trading environment, it’s almost impossible to not think and trade in agreement with the majority of traders.

However, effective technical analysis allows us to use trends, patterns and other indicators to evaluate the market’s current psychological state. Fortunately, this analysis can both enable us to independently forecast whether the market is heading in an upward or downward trend and do so against the grain of the majority.

It takes a disciplined trader to be able to watch and listen to the market doing one thing, filter out the noise, then do the opposite – all in a controlled manor. To this day I still find myself fighting the herd mentality at times and that is when I step away from the computer and regroup.

I have a simple rule that has saved me thousands over the years. I would rather miss a trade and learn what caused me to get confused, then to take a loss.

Rule # 1 – When in Doubt, Stay Out!


There are two types of traders:

1. Herd Mentality Trader – Someone who trades off fear and greed buying near tops and panic selling out at the bottom with the masses.
2. Black Sheep Trader – A trader who stand out from the masses and trades opposite to the “herd” during extreme levels.

Last weeks market action really allowed us to see which way the masses were moving. The extremely high selling volume and sharp price decline notified us that the market was trading off FEAR. And, last Thursday we actually saw PANIC which tells us the balance of the market (retail investors, John Doe’s, The “Herd”) were exiting their positions.

When we see this happen, it’s generally a good time to start scaling into long positions, as most of the down side has already happened.

I have been talking about an ABC retrace pattern for the indexes and gold for some time and last week we got just that. An ABC retrace is when we have 3 waves which are, down, small up, then another leg down.
In short this wave breaks the uptrend of higher highs and lows, as it forms a lower low telling novice traders to sell and go short. This is what causes the high volume and sharp sell offs.

Below are a few charts showing the 2009 July lows and where we are now, February 2010:

SP500 – Daily Trading Chart

Gold – Daily Trading Chart

Silver – Daily Trading Chart

Oil – Daily Trading Chart

Intraday Price Action – If you want to see some exciting intraday trading charts check out the setups last week: http://www.thegoldandoilguy.com/articles/how-to-trade-intraday-gold-and-sp500/

Market Psychology Trading Conclusion:
Most get involved with the stock market because it looks like something they can quickly learn and start making money from home. But it doesn’t take long before they quickly realize there is more to trading than meets the eye.

While trading looks easy from a glance, in actuality I think its one of the toughest jobs out there.

Why? Well, this is what you are up against:
1. You are trying to predict something that is unpredictable
2. You are trading against millions of other highly skilled traders
3. You are trading against automated computers with complex algorithms
4. You are trading with your hard earned money which causes fear and greed
5. You must accept losing trades as that is part of the business
6. You must trade with a proven trading strategy and follow the system
7. You must understand money management and apply it to every trade
8. You must truly love the market cause it will break you down mentally

I don’t want to say you must be a contrarian, but in reality you must do the opposite of the masses during times of extreme price behavior.

These extremes happen on a daily basis when trading intraday charts and every 4-6 weeks when looking at daily charts. The toughest part is to pull the trigger when emotions are flying high in the market and you are looking to do the opposite. It takes several trades before you even start to get comfortable doing this.

I hope this helps shed some light on market psychology.

If you would like to Receive My Gold Trading Newsletter and Analysis please visit my website:

Chris Vermeulen
www.GoldAndOilGuy.com

It’s been a great year as we head into the final few trading sessions. The past several weeks the indexes have not done much of anything which is why we are now in cash.

I feel as though the market is about to change direction abruptly in the coming days or weeks. I feel this way for several reasons:

1. NYSE, Dow Jones, S&P500 are all drifting higher into resistance levels on the 10 day, 60 minute charts. Light volume tends to favor higher price hence the reason for the holiday rally.
2. Broad market momentum waves are topping
3. These same indexes are trading at resistance levels from early 2008
4. Money flow is indicating large institutions have been big sellers over the past 3 weeks.
5. US economy I think is worse than most want to think

So take a look at these 10 day charts which clearly show resistance and support trend lines. Each, if broken will lead to a sharp decline. I used ETF’s as substitutes for the indexes.

Dow Jones – DIA – Top Chart
SPY – S&P500 – Middle Chart
NYSE – Bottom Chart

Stock Market Trend

Stock Market Trend

Stocks have started to decouple for the US dollar in recent days so I am not focusing much on what affect the dollar will have on the above indexes.

That being said, the US dollar (UUP etf fund) is at a pivotal point. It’s either going to bounce off the trend line support level (blue line) and send gold back down to test the previous low, or breakdown through the support trend line. A falling dollar will give gold some power to muscle its way back up to the next short term support level.

Dollar and Gold Trends

Dollar and Gold Trends

Yesterday (Tuesday Dec 22nd) we said gold stocks and silver prices would move higher. I consider gold stocks and silver my leading indicators for the price of gold. Today (Wednesday Dec 23rd) gold stocks and silver shot higher – out performing gold by 7:1 which is very bullish for gold.

Crude oil had a large rally today sending the USO oil fund surging 3.5%, confirming a bounce off our support level 2 weeks ago. It could be warming up for another rally.

Natural gas opened lower but put in a strong session as it trended up all day. This also looks very strong and if prices breakout and follow through next week natural gas could be making a real rally for once.

This is a short trading week with Thursday only a half trading session and Friday being closed for Christmas/Holidays. We will not have any low risk setups this week and because we are sitting in cash, let’s take this time to enjoy our family, friends and pets ?

Get my Trading Charts, Reports and Signals:

Chris Vermeulen
www.TheGoldAndOilGuy.com

Commodities and stocks have been on fire the past two weeks and I think it just may be time for things to take a breather. While I continue to stay long, taking some money off the table to lock in profits is a safe play.

Just from a quick glance at the charts we can tell the odds are pointing to some type of pause or pullback in the coming days. I figure any day now we could see some profit taking.

Gold ETF Trading – GLD

The Gold ETF is one of my favorite trading vehicles. Using simple trend lines and looking at the recent price action you can see that the price of gold is looking ready for a pullback. Buying at this level is chasing and that generally means you buy at the high and panic out at the low.

How to Trade Gold GLD

How to Trade Gold GLD

Silver ETF Trading – SLV

The Silver ETF looks to be in the same boat as gold. I expect to see some sideways price action or a pullback.

How to Trade Silver SLV ETF

How to Trade Silver SLV ETF


Natural Gas ETF Trading – UNG

The Natural Gas ETF sure has given everyone a wild ride in the past 6 months. The bear market is still in place which can be seen on the daily chart. So far this week the price has broken down and trading at the $11 support level. This fund could generate a buy or sell signal with my trading model in the coming days so I am waiting for a clear entry and exit point before jumping on the gas wagon.

How to Trade Natural Gas UNG ETF

How to Trade Natural Gas UNG ETF

Crude Oil ETF Trading – USO

The Crude Oil ETF has broken above its resistance trend line this week but still struggling to move above the August high. Volume is declining while the price rises which is a bearish indicator. USO looks ready for some type of a pullback as it digests this breakout before moving higher.

How to Trade Crude Oil USO ETF

How to Trade Crude Oil USO ETF

Mid-Week GLD, SLV, UNG, USO ETF Trading Report

What does the general public hear and think about the stock market?
From recent emails, local financial news shows, family, friends etc… all I am hearing is how strong the market is. Indexes are making new yearly highs and company earnings are better than expected this quarter. Sounds like all we need to do is buy and life will be great!

Well in my opinion the market is the perfect tool for misguiding and frustrating the general public. All my indicators are telling me we need more of a correction before rallying much higher. The market (smart money) generally anticipates good and bad news several weeks if not a month in advance. So the question is:

Are company earnings already priced into the market?

Is all this positive market coverage getting the general public to buy up here at this possible market top?

The answer is, only time will tell. No one knows for sure what the market is going to do but short term moves can be predicted with relatively high accuracy.

Don’t get me wrong, I am still bullish on the market but with all this good news becoming public information you have to wonder what is next. I am still long the market but trimming my positions to lock in profits and still stay in the game.

If you would like to receive my free weekly trading analysis please visit my trading websites:
www.TheGoldAndOilGuy.com
www.ActiveTradingPartners.com

Chris Vermeulen

Commodities have and continue to be a fantastic trading vehicle for those who can stomach volatility. After last year’s market crash most commodities pulled back to normal if not lower than normal trading ranges. This allowed us to enter the market at 10+ year lows for natural gas.

If we look at the weekly chart for gold, silver, oil, natural gas and the CRB commodity index we can see that commodities in general look ready to skyrocket higher approximately 34% on average in the next 4-12 months.

Take a looks at this chart of gold. While this chart shows the basic technical analysis of the price of gold you can see the completion of the Cup & Handle pattern which is VERY BULLISH. Also you can see gold broke to a new high. While I don’t like to trade new highs it’s hard not to want to buy into this breakout. Most traders should be long gold already, but if you are not, you have a couple of options. Buy into this breakout with a tight stop or wait for a pullback and buy on a test of the breakout. Personally I am waiting for a pullback (test of breakout) before I add more to my position.

Trade Spot Gold

Trade Spot Gold

Silver has been strong but has not held up its value as well as its big sister (gold). As you can see silver must break through two more major resistance levels before making a new multi year high. Overall silver still looks strong and I will be waiting for a low risk setup for us to add more to our positions.

Trade Spot Silver

Trade Spot Silver

Crude Oil looks like a perfect Cup & Handle pattern and I am now looking for a low risk entry point which should form before we get a breakout it to the up side. I can see oil quickly moving to the $100 per barrel level once we get a breakout.

Trade Crude Oil

Trade Crude Oil

Natural Gas had a perfect shakeout in August and many aggressive traders who follow these reports followed my lead and bought natural gas around $2.90 (10 year lows). This was the move I wrote about for nearly 3 months as we waited for it to unfold. Down side risk was around 15% so it was not my signature low risk setup but this rally has been exciting. Currently natural gas is trading at resistance and taking some money off the table is a great play here. You will never go broke taking profits.

Trade Natural Gas

Trade Natural Gas

The CRB Index looks very similar to crude oil. Overall commodities look to be in the final stages of basing (bottoming) and from simple technical analysis the next more could be around 30-34%.

CRB Index

CRB Index

Commodity Trading Conclusion:
Overall commodities look like a great buy. We are seeing precious metals moving up strongly and gold making a new high which is very exciting as our golden rock stock plays push higher and our commodity ETF play continue higher as well.

Energy is a mixed bag. Oil looks bullish and ready for a nice rally, while natural gas looks a little top heavy as it trades just under resistance.

We continue to stay in the market and are waiting for another round of low risk setups which could happen in the next few days if we get favorable price action. Remember to move your stops up to lock in gains. There is nothing worse than giving back a large portion of your profits when you don’t need to.

If you would like to receive my free weekly trading reports please fill out this form:


First Name:
Email:


Chris Vermeulen

Rising Commodities, Falling Stocks & Risk Reward Ratio

Trading Risk/Reward

The past few months have been absolutely crazy in the financial markets. Financial advisors and banks are taking a beating from both the market condition and clients as individuals around the world are losing 30+ of their investments. We have seen oil prices drop over $110 per barrel from the high (73% decline), and the US dollar tumbled down to 71 and rebounded to 88 (23% gain) all in the mater of months.

Risk Management is what is needed if we want to stay in the game over the long term. Follow strict risk/reward rules is a must so that we don’t not get caught chasing stocks and funds only to have them turn around on us a few days later.

Focusing on keeping risk low for potential trades is crucial for turning a profit over the long run. In short I look for a basket of indicators including candle patterns and volume to be in favor when buying or selling a stock or fund. When a fund generates a buy signal I wait for a low risk entry point near my support or resistance level depending if I am looking to go long or short. I need to see a perfect setup so that the odds are favoring my side. Only then will I take a stab at the market. The biggest issue with this is that I do miss a lot of good trades, but the key here is that most of my trades are profitable and that is what makes it so powerful. I would rather make 20 trades a year, than 150 trades and make the same profits.

This Weeks Analysis on Gold

Gold continued its push higher last week getting a lot of investors and traders all excited. The daily chart does look strong and it is currently on a buy signal. But buying at this level is much too high of a risk.  The price of gold is trading at the top of its 4 month trading range which previously led to a 20% selloff in bullion. Our support trend line is 10% away from the price of gold making it out of reach still. I trade reversals when risk is only 3% from my stop/support price.

Daily Gold GLD Chart


Gold Stocks

Gold stocks have been struggling to move higher and last Friday gold made a nice move higher while gold stocks sold down. My last article talked about how trading gold (GLD) may be a better investment then gold stocks right now simply because of the bearish broad market. The broad market looks like it’s about to make another leg lower and when the broad market sells off, it pulls all stocks with it. The daily chart of the HUI Gold Bugs Index shows precious metal stocks moving sideways while gold pushed higher. When gold stocks start to underperform the price of gold I tighten my stops and mentally prepare myself for gold to pull back. The smart money always seems to move in and out of stocks faster than the commodity which is a topic I mentioned in a previous report as well.

Gold Bugs Index Daily Chart


Crude Oil Analysis

Crude Oil has been under continuous selling pressure for the past 7 months and this is the first buy signal I have had for it since it topped back in July 2008. The weekly chart is very close to a buy signal. If you look at the weekly chart of USO crude oil fund you will see that volume has shot through the roof which generally indicates a turning point. Also the MACD indicator is about to cross which will put this fund on a buy signal if things go well all of next week. The support trend line is trending up slightly and the down trend line is holding the price inside a small triangle. If the price breaks out and all my indicators are putting the odds in favor of a long trade, then we will be looking for a buy point on the weekly chart in the next few weeks. The weekly trading signals are good for intermediate and long term traders.  

Crude Oil (USO) Weekly Trading Chart

Conclusion:

The broad markets continued to move lower last week as it remains in a long term bear market. For those looking to take advantage of gold, silver and oil movements I recommend sticking with the commodity funds as they can increase in value while the broad market is selling off. The daily chart of the hui gold bugs index shows this clearly as gold stocks in general are underperforming the price of gold right now. There is an opportunity for oil to make a move higher if things come together in the next couple of weeks but until then we will be patient and let the trade come to us.

If you have any questions please feel free to send me an email. My passion is to help others and for us all to make money together with little down side risk.

I look forward to hearing from you soon!

Chris Vermeulen

The Gold and Oil Guy

Chris Vermeulen

Gold prices shot up on Friday as investor’s move their money into a safer investment as the broad market continued it crash the day before breaking the October bottom. Once the price of gold climbed over the $760 mark which was a short term resistance level the price shot higher as new buyers jumped in and short covering took place pushing gold to climb $57 in one day which you can see in the chart below.

Spot Gold Prices – 3 Day Intraday Chart
Spot Gold Price

Now, looking at the daily chart of gold below, it appears that it has put in a double bottom with a nice rally higher. Also confirming this move may not be over yet is the MACD cross over and the strength of gold. Its best to waiting for a low risk setup before any money should be put to work. We are getting close to possible buy signals if things continue to hold up over the next week or so. Gold will find resistance between $800 – $825 and could take a breather for a few days which could provide a great setup if we are lucky.

Daily GLD Gold Price Chart

Gold stocks shine as they rally big on Friday out performing the price of gold and possibly putting in a higher low for the HUI which could be the start of an upward trend. Keeping a close eye on the performance of gold stocks will help confirm a low risk setup for trading gold (GLD, DGP, and Spot Gold). If gold stocks are performing well during a gold buy signal I generally put more money to work on that trade as opposed to gold stocks underperforming the price of gold.

Daily Gold Bugs Chart (Gold Stocks)

A longer term look at gold stocks performance which is shown in the chart below is the fact that they are bouncing off long term support which has been tested 5 times. This is very bullish for gold and gold stocks as well.

Monthly Gold Stock Chart

Slippery Oil Prices

Oil Traders cannot believe the slide in oil since June this year. Last Thursday oil closed below $50 which is a long ways of its $150 high not to long ago. A couple interesting things show up on my oil chart which I thought are worth pointing out. Obviously the price of oil is severely oversold and due for a dead cat bounce if not a “V” shaped bottom. But although prices continue to slide the momentum is starting to shift to the up side. The MACD is trying to move higher which is a good thing and also the fact that oil is at the bottom of it channel. Also energy stocks are out performing the price of oil like crazy!!! This is extremely bullish and a bounce in oil will send energy stock soaring. I will note that a lot of energy stocks pay a dividend and with their share prices being pushed down to these extreme levels, investors are starting to buy because the dividend rate is so high and most of these companies make solid earning year after year so at these prices the shares look attractive to many.

Oil Trading Chart (USO)

Conclusion:
I don’t try to predict market direction because it’s a fools game, I do think we have some exciting times just around the corner if the market does find support in the next week or so. I have been in cash since August waiting for a setup but volatility is ridiculously high and I don’t put my money to work if I’m risking more than 3% on a trade. Gold Stocks are starting to have money flow back into them and oil is starting to look like its downward move is almost exhausted. I continue waiting for a proper setup with low risk as I believe in taking the safe middle section of trends and not trying to pick tops or bottoms.
I am a full time daytrader and swing trader specializing in trading GLD, GDX, XGD.TO, SLV and USO. I provide my trading charts, market insight and trading signals to members of my newsletter service.

If you have any questions feel free to send me an email.
Email: Chris@TheGoldAndOilGuy.com