Posts

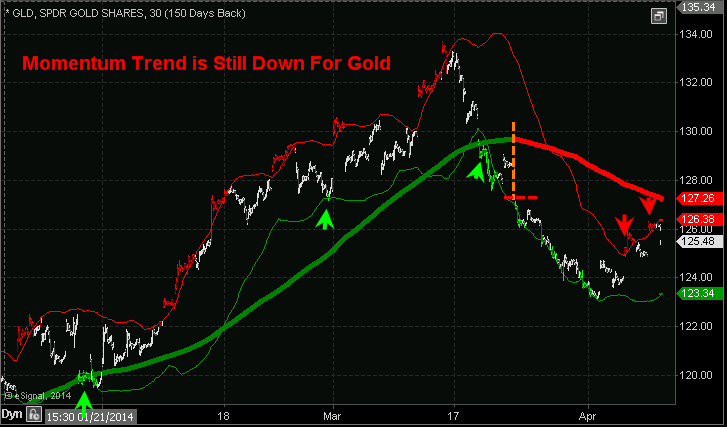
I did a short video a while back on momentum trading gold and wanted to share it and post it in the members area of the website for you to view. It’s short and basic, but useful.

Current snap shot of gold trend…

Gold - ETF Trading Newsletter


Learn More & Trade With My Alerts with my ETF Trading Newsletter

Chris Vermeulen

The precious metal market has been stuck in a strong down trend since 2012. But the recent chart, volume and technical analysis is starting to show some signs that a bottom may have already taken place.

This report focused on the weekly and monthly charts which allow us to see the bigger picture of where the precious metals sector stands in terms of its trend.

Let’s take a look at a few charts below for a quick overview, but if you want more interesting ones visit: https://stockcharts.com/public/1992897

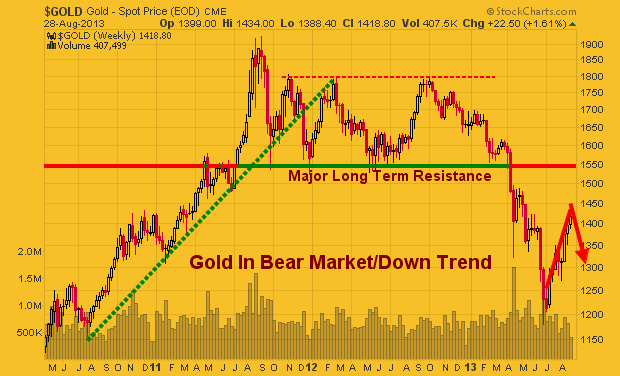
Gold Spot Price – Weekly Chart

This chart clearly shows the trends which gold has gone through in the last three years. With simple technical analysis trend lines, clearly price is nearing a significant apex which will result in a strong breakout in either direction.

Remember, this is the weekly chart, so we could still have another month or three of sideways chatter to work through. But a breakout in either direction will trigger a large move.

goldtrend


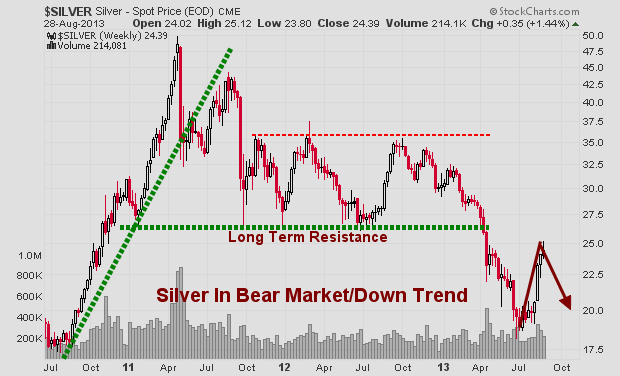
Silver Spot Price – Weekly Chart

Silver is also stuck in a similar pattern.  Currently the odds still favors lower prices and for the upper resistance trend line to reject price and send it lower. But if we keep out eye on the leading indicators like gold miners, we may be able to catch a breakout or traded the rejection of resistance in the next month or so.

silvertrend


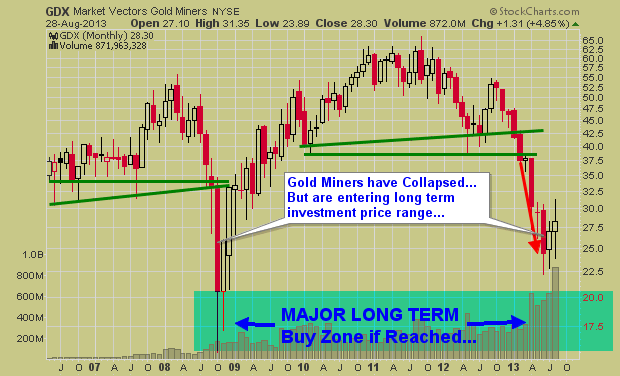
Gold Mining Stock ETF – Monthly Chart

Gold miners have a very sloppy looking chart. Price is extremely volatile and the recent price action in 2013 could go either way VERY quickly. I have a gut feeling GDX in the coming months could have a washout bottom and tag the $20 price level. While I hope I am wrong for many investors sake, if it does happen, it will be a very strong investment level to accumulate a position.

gdxtrend


Precious Metals Bigger Picture Outlook:

In short, I remain neutral – bearish for this sector.  In the next 1-3 months we are likely to see some strong price action which will be great. We need a breakout or bottoming pattern to form before we get involved at this level.

I know everyone is dying to get involved in precious metals again for another huge rally… but sometimes it’s just best to wait for the big picture chart to catch up with your bias before taking a position of size.

Get My Free Weekly Trading Sector Reports
Delivered To Your Inbox: www.GoldAndOilGuy.com

It has been a bumpy ride for precious metal investors over the past couple of years and it unfortunately I do not think its over just yet.

The good news is that the bottom has likely been put in for gold, silver and gold miners BUT the recent rally in these metals and miner looks to be coming to an end. While we could see another pop in price over the next week or so the price, volume and momentum see to be stalling out.

What does this mean? It means we should expect short term weakness and lower prices over the next month or two.

Below are three charts I posted several months ago on my free stockcharts list. These forecast were based off simple technical analysis using cycles, Fibonacci and price patterns. As you can see we are not trading at my key pivot level which I expect selling pressure to start to increase and eventually overpower the buyers sending the prices lower.


Gold Trading Weekly Chart:

Here you can see that gold is technically in a bear market when viewing it on the weekly chart. If you were to pull up a daily chart you would likely notice how the price of gold is trading at a key resistance level on the chart and has reached its full flag measured move.

What does this mean? It means the odds are pointing to lower prices for gold in the next few weeks. Keep in mind though I do feel as though a major bottom has been put in place for the precious metals sector. So buyers are likely to step back in around the $1300 area.

goldoverbought


Silver Trading Weekly Chart:

Silver has a little bit different looking chart but the same analysis applies here as it did in gold.

silveroverbought


Gold Miners Trading Monthly Chart:

Gold miners may have bottomed on this monthly investing timeframe chart but the daily chart which you will see next clearly shows short term weakness has started.

GDXLongtermBottom


Gold Miners Trading Daily Chart:

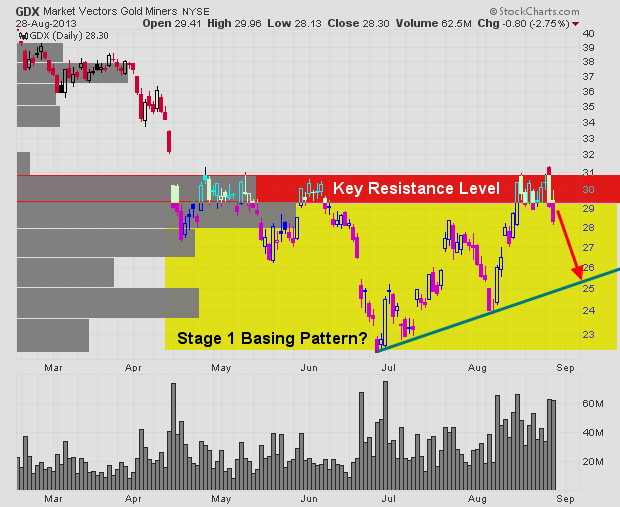
This daily chart really shows my thinking for miners and the overall precious metals sector as a whole. The recent weakness in gold miners to the down side point to distribution of shares. This is very negative for the price of physical gold and silver as gold mining stocks tend to lead physical metals.

The yellow box shows a possible major stage 1 basing pattern forming. If this is the case, then we will have a great opportunity in the coming months when the precious metals down trend completes a reversal and start heading higher.

gdxoverbought


How to Trade Precious Metals & Gold Miners Conclusion:

In short, I think that staying in cash or shorting metals is the play for the next couple weeks. After that anything can happen and until price breaks down or finally completes the basing pattern and confirms a market bottom I would be very cautious trading here.

In the last week members of my trading newsletter took profits on our short SP500 trade and we closed a long trade in natural gas for a quick 6.5% gain. Join our community of traders and have your money on the right side of the market!

Chris Vermeulen
www.GoldAndOilGuy.com


By Futures Portal

Chris Vermeulen www.TheGoldAndOilGuy.com a full time trader shares
his experience of trading futures and ETFs.
——————————————————–

You call yourself the “Gold and Oil Guy”, are the gold and oil sectors are your specialties?

I follow gold and oil closely and give my analysis, thoughts and trades ideas to my followers each morning before the market opens. While I follow them closely the SP500 is my baby and what I prefer to trade. I found that emotions run wild in the stock market and once you understand what state of mind the majority of traders are in, then you are able to accurately track and forecast future moves 1-3 days in advance.

How did you get started trading?

I started years ago in college trading from my laptop. It didn’t take long before I decided this was what I was meant to do for a living. I have never stopped since. I work with several financial websites and professional traders each week and trade each day either managing swing trades or taking a day trades.

What instruments do you trade the most?

Depending on the risk and type of trade (swing, momentum or day trade) I jump between trading ES Mini Futures, 1x ETFs, 2x ETFs and 3X ETFs. I prefer index trading specifically the SP500 as that has been my main focus for day one. It’s better to be really GOOD AT ONE THING than average at a bunch of things. This strategy has many benefits to it including less time searching for trade setups, less stress, lower risk levels etc…

How did you choose the time frames you trade on?

Choosing the time frames to trade took many years of trial and error. But I did eventually find a couple time frames which have proved to be VERY accurate when trading the SP500 specifically. Money flows in and out of the market in waves (cycles) and once I realized these cycles and could identify fear and greed in the market place finding and timing trades was the difference between night and day.
The really exciting thing about the SP500 and its cycles/timeframes is that I can trade full time and have trades almost every other day or site back and wait for the longer term swing trades and enjoy time with my family, friends and exercise. I have built a trading system that automatically breaths with the market using current volatility levels, various cycles, buy/sell volume levels and momentum and it alerts me in pre-market trading each day if I a buy, sell or position adjustment is to be made. The time frames I focus on are the daily, 30 minute, 10 minute and 3 minute.

Do you trade leveraged instruments? Do you trade them differently from non-leveraged investments?

I trade all types of instruments based around the SP500. In short, the more leverage I use the smaller the position I take and the shorter term the trade is.

For example I will trade the ES mini futures for day trades which are always closed out at the end of the day.

Momentum trades which last 1-3 days I will use a 2x or 3x ETF like SSO or SPXU to get more juice from a play but maintain a healthy risk level as overnight trading and price gaps cut both ways.

Swing Trades I take the largest positions in up to 50% of my trading account in a single position using a 1x ETF like the SPY. These trades can last up to 4 months at times.

I do at times make things a little more complicated when trading with a strong trend. Sometimes when I get a swing trade buy signal I will buy a position using the 1x ETF. If in the next 3 days I get lower prices of more than 1% against me while the uptrend remains alive I will add more of a position using a 2x and 3x ETF also. Once the market bounces back a little I close out the leveraged positions to a quick gain and continue to ride the swing trade. I do this same thing in down trends when I am on a hot streak and in the zone with the SP500.

What has been your biggest hurdle becoming a full time trader?

The toughest part of trading for me is keeping laser-beam focus on my strategy as it is mandatory for success. I work with, talk to and read a lot of market opinions of other traders each day and it can cloud my judgment causing me to break my own rules.

In your opinion, what do most traders don’t realize about the “game” of trading?

Most traders/investors do not understand risk/reward for positions. I would say 90% of people I talk with take much too large of positions in investments which carry very high risk. Also they do not use protective stops based of technical analysis/risk tolerances. Those are the two main things, but this list could go on and on… There are a lot of moving parts in the market and each must be closely monitored, managed and understood clearly.

Again, It’s better to be really GOOD AT ONE THING than average at a bunch of things meaning you should be jumping around trading random stocks, sectors, commodities and investment types like options, equities, forex etc… Just learn one, master it and then expand.

Without revealing your proprietary method, could you please tell us what tools you use for trading? Any specific indicators?

I am a technical trader so I focus 100% on Price, Volume and Momentum. News, economic data and rumors mean absolutely nothing to me. The only thing that pays traders is price action so that is what I follow. It’s simple supply and demand. High volume means there is power behind a move and momentum is how fast the price is moving on various time frames.

As long as you trade with the daily trend direction forget about picking market tops or bottoms you instantly have the odds in your favor. Problem is people always want to try and outsmart the market by going against the trend and trying to pick these tops and bottoms.
As for the indicators I use. Again they are simple and based off price, volume and momentum. Each of my indicators has been customized for the SP500 and is unique. I do like stochastics and bollingerbands but they each need to be tuned for the underlying investment to provide a trading edge.

What advice would you give new traders to start on the right foot?

I would tell a new trader to spend a lot of time thinking about what their ideal/dream lifestyle would be like if they could choose. Do you want to be looking at the computer and trading every day? Or do you want to always be in positions and actively managing them on a weekly basis so you can enjoy life little more? Or A mix of both?

Then you need to figure out what you would like to trade. Stocks, Options, ETFs, Futures, or currencies?
Once you know these things then you should spend a lot of time looking for a successful trading doing EXACTLY what you want and do everything in your power and never give up to learn, master and live that lifestyle. Learning to trade is not cheap. You either lose a lot of money or spend a lot of money to fast track things… either way it’s going to cost you thousands of dollars.

Personally I do a hybrid with laser-beam focus. I focus on only one investment (SP500). And I have learned and created my own trading system so I can day trade, momentum trade and swing it. This give me total freedom as I can spend 20 minutes a day looking at the market to manage my swing trade if needed and then walk away. Or can be replying to emails and see a setup unfolding on the intraday chart and take a quick trade and pocket a few hundred bucks on a day trade.

Final question is about drawdowns. How do you handle them in your trading?

Drawdowns are simple really… Depending on the type of investment you are trading the percentage amount will vary. But the same rule should apply. You should have a maximum loss per trade set so that you never blow your account up. Hopefully your protective stop is set way before that level is ever reached but sometimes price moves beyond normal volatility levels.

My general rule is to never lose more than 1% of my account in a trade. So once I spot a setup and then calculate where my stop should be and figure out how much capital to put to work so that if my stop is hit I do not lose more than 1% of my trading account. Because I focus on the SP500 the volatility is low compared to trading individual stocks so moves in price as easy to digest and reduces fear/stress when in a position.

Chris, thank you very much for sharing your experience with us and our readers.
Best of luck on everything.

FuturesPortal.com Editorial

On April 12th I wrote a blog post titled Precious Metals Melt-Down, and How To Manage It. I talked about how gold, silver and gold mining stocks have been flying under the media radar for over a year and that they were not catching the attention of traders, investors and the public anymore. I also said it would take some sharp price action (breakdown or rally) for it to be front and center again on TV, Radio and Newspapers.

But since gold has plummeted 17.5% dropping from $1600 down to $1320 per ounce with silver and gold stocks falling also they are now headline news once again. This move has caused some serious damage to the charts when looking at it from a technical analysis point of view. Below are some basic analysis points that show a new swing trading entry point.

The Technical Traders Chart Analysis:

Broken Support – Once a support level has been broken it becomes resistance. Gold is trading under a major resistance level.

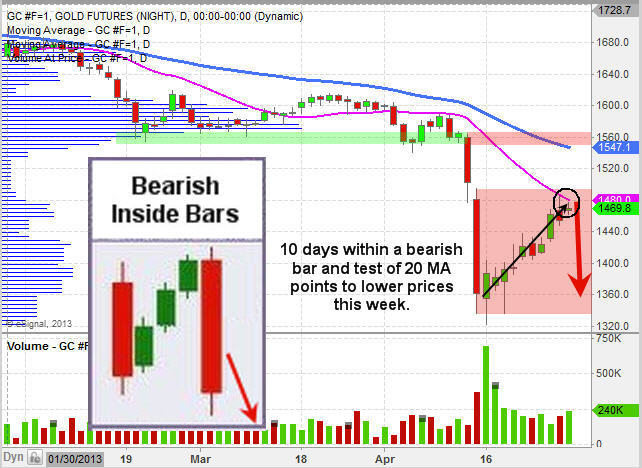
Momentum Bursts – Since the April 15th low, gold has been setting up for another short selling entry point. Remember the market tends to move in bursts of three, seven or ten days then price reverses direction or pauses. It has now been 10 days.

Moving Average Resistance – Gold has worked its way up to the 20 day moving average which can act as resistance.

Bearish Inside Bars – This type of chart pattern points to lower prices. When there is a big down day followed by 3, 7 or 10 up days inside the price action of the down bar we can typically expect another sharp drop which tests the recent lows as shown with the arrow on the chart.

GoldBear


Gold Short Selling Conclusion:

In short, gold is setting up for a low risk entry point that should allow us to profit from lower gold prices. Using an inverse ETF like DZZ or even the gold mining stock inverse ETF DUST could be played. These funds go up in value as the price of gold falls.

While I expect gold to pullback, I do not think it will make another leg lower. Instead, a test of the recent low or pierce of the low by a few bucks then reverse and start building a bullish basing pattern before going higher.

Get My Book Free and Learn How To Manage Your Trades, Money & Emotions: http://www.thegoldandoilguy.com/trade-money-emotions.php

Chris Vermeulen

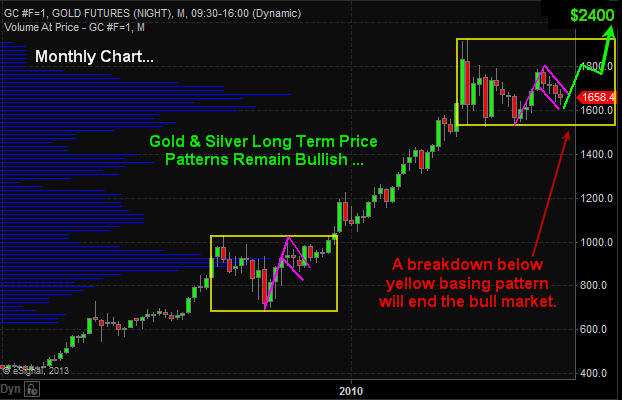
The precious metals sector has been dormant since both gold and silver topped in 2011. But the long term bull market remains intact. As long as we do not have the price of gold close below the lower yellow box on the monthly chart then technical speaking precious metals should continue much higher.

Large consolidation periods (yellow boxes) provide investors with great insight for investments looking forward 6-18 months upon a breakout in either direction (up or down). The issue with investing during these times is the passage of time. One can hold a position for months and sometimes years having their investments fluctuate adding extra stress to their life when they really do not need to.

Once a breakout takes place a powerful rally or decline will start putting an investors’ money to work within days of committing to that particular investment compared to money invested waiting months for the breakout and new capital gains to occur.

Gold Price Chart – Monthly

Gold Monthly Price Chart


Gold Price Chart – Daily

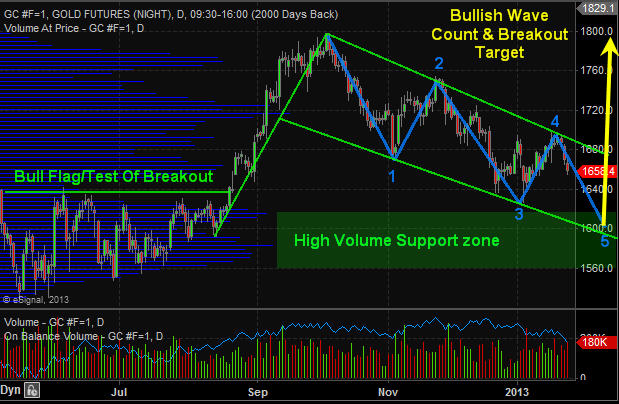
The chart of gold continues to form a large bull flag pattern with a potential 3 or 5 wave correction. If price reverses this week and breaks above the upper resistance trend line then it will be a 3 (ABC) wave correction which is very bullish. But there is potential for a full 5 wave correction which is still bullish, but it just means we have another month or two before metals bottom.

Gold Futures Trading Daily Chart


Gold Miner Stocks – GDX ETF Chart – Daily

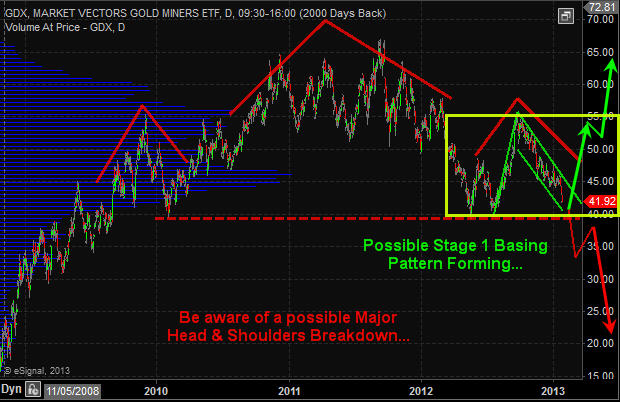
Gold miners do not have the sexiest looking chart. It was formed a strong looking bull flag but has continues to correct and is not nearing a key support level. This level could act as a triple bottom (bullish) or if price breaks below then it would be breaking then neckline of a massive head and shoulders pattern which points to 50% decline. I remain bullish with the longer term gold trend until proven wrong.

GDX - Gold Miner ETF Trading


Silver Price Chart – Daily

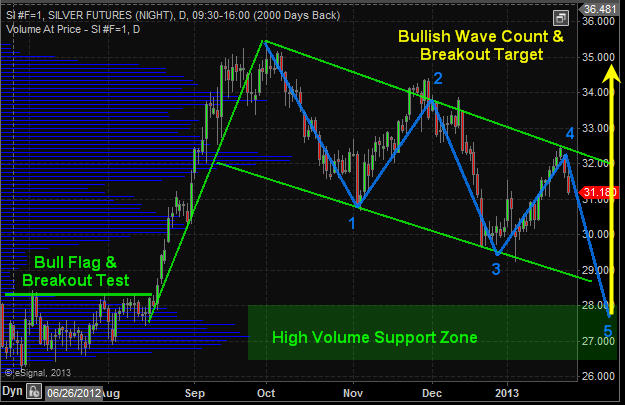
Silver remains in a long term bull market much like the monthly chart of gold shown earlier in this report. Silver continues to work its way through a large bull flag pattern with a positive outlook at this time.

Silver Price Chart Daily


Silver Miner Stocks – SIL ETF – Daily Chart

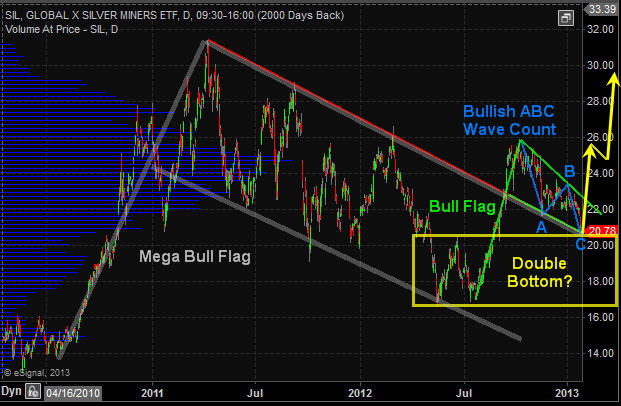
Reviewing the precious metals sector it seems that silver miners have the sexiest looking chart. All price patterns are showing strength and are in proportion to one other. If this chart plays out to what technical analysis is pointing to then we could see the precious metals sector put in a bottom and rally within the next week or two. And if this is the case then silver miner stocks should provide the most opportunity going forward. Keep in mind you can view my actual watchlist of stock and ETFs I trade in real-time with my analysis free: https://stockcharts.com/public/1992897

SIL - Silver Miner ETF Trading


Precious Metals Trading Conclusion:

In short, what you need to focus on is the yellow consolidation box on the monthly gold chart. A breaking in either direction will trigger a massive move that should last 6-18 months. Until then long term investors can simply sit back and watch the sector while they put their money to work in other active sectors.

From a short term traders point of view, that f mine. I am looking for a signs of a bottom on the daily chart to get my money working earlier to play the bounce/rally that takes place and actively managing the position until a breakout occurs. The charts overall are not that clear as to when a breakout will take place. Metals could start to rally next week or in a few months and all we can do is wait for a reversal to the upside before we get active.

Knowing the big picture trends and patterns at play along with major support and resistance levels (breakout levels) is crucial for success and piece of mind.

Get my analysis, daily updates and trade alerts each day at www.TheGoldAndOilGuy.com

Chris Vermeulen

Chris Vermeulen – www.TheGoldAndOilGuy.com

One of the top stories in the financial markets in 2012 has to be the stagnation in the price of gold at around $1600 an ounce, which is down approximately 17% from its peak at $1920.30. Those bullish on the yellow metal have been disappointed in gold’s performance while those bearish on the shiny metal have reveled in its stagnation, saying that gold’s status as a safe haven is over.

What is behind gold’s sluggish performance in 2012? There are several reasons, but one of the key fundamental reasons has been the lack of demand from traditionally the largest buyer of gold on the planet – India (although China will surpass it this year). India bought only 181.3 tons in the second quarter of 2012, a 2-year low, according to the London-based World Gold Council.

There are several factors at play as to why Indian demand for gold has fallen. One reason is the sharp drop in the value of its currency, the rupee, which is down by 25% versus the U.S. dollar this year. This decline has kept gold prices high in relative terms while the actual dollar value of gold was falling. Perhaps even more important has been the ‘war’ declared on gold by its central bank which has blamed all of the country’s economic ills on Indian citizens’ traditional buying of gold. In an attempt to slow down gold and silver imports, the Indian government has imposed new taxes on the purchase of these precious metals.

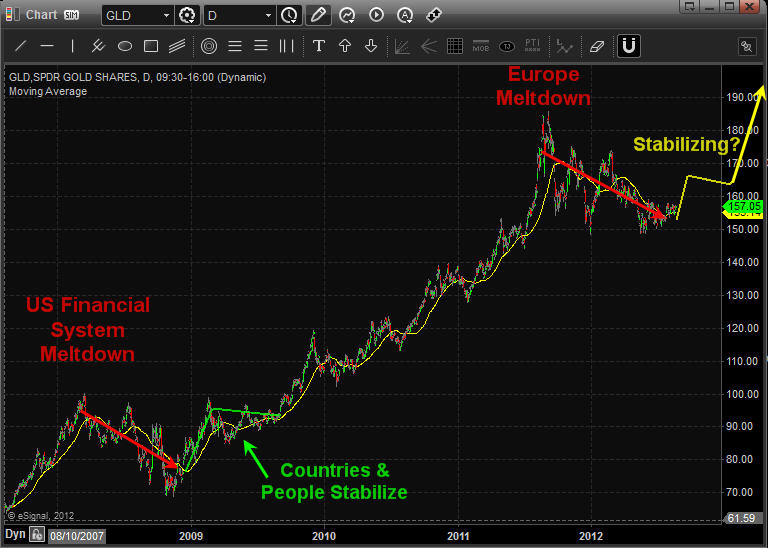
But even though demand for the precious metal is way down in India, the situation still offers hope for gold bulls. Why? Because we’ve been here before – in 2009 to be exact. In early 2009, the Indian economy and rupee tanked. Gold demand almost completely dried up. According to precious metals consultancy GFMS, Indian demand for gold in the first quarter of 2009 collapsed by 77%. For the full year GFMS said Indian consumption dropped by 19%.

Now with the Indian economy slowing to its weakest growth rate in nearly a decade and the rupee falling, we are seeing a replay of 2009. The monsoon season has been poor, hitting farmers – among the biggest buyers of gold – hard. Gold prices have hit a record high in rupee terms, and India is expected to purchase, as forecast by the World Gold Council, only 750 tons of gold, down 25% from 2011 levels. Meanwhile, the WGC forecasts that China will buy 850 tons of gold this year.

Investors should pay heed to the clues that recent history is giving us. The drop in Indian demand is simply a cyclical phenomenon due to the lousy state of the Indian economy. It will recover eventually. And when it does, look out for the fireworks from renewed Indian demand for gold added to the Chinese demand. In 2010, as pent-up demand for gold was unleashed, Indian gold consumption soared 74% to a record high of 1,006 tons according to GFMS.

Gold bulls surely hope we see something similar in 2013 and that is exactly what I talked about last week based around gold miner stocks and also what Dave Banister’s recent gold forecast was about at TheMarketTrendForecast.com sees in 2013.

Gold Chart Showing 2009 Collapse and Outcome and Current Gold Price Analysis:

Gold Forecast - India Gold demand

Gold Forecast - India Gold demand

Gold Trading & Investing Conclusion:

In short, gold and gold stocks have a lot of work to do before they truly breakout into the next major leg higher. I feel we are nearing that point and they may have bottomed already. Starting a small long position to scale in I think is a safe play. But I would only add more once the trend actually turns up and shows strength in terms of price and volume action.

If you would like to get my weekly analysis on precious metals and the board market be sure to join my free newsletter at www.TheGoldAndOilGuy.com

Chris Vermeulen

The last week of the year volume tends to be light due to the fact that big money traders are busy enjoying the holidays and waiting for their yearend bonuses.

I was not planning on doing much this week because of the low volume but after reviewing some charts and risk levels on my top 5 trading vehicles I could not help but share my findings with everyone last Friday.

You can see what I talked about on Friday here: http://www.thegoldandoilguy.com/articles/holiday-short-squeeze-oil-trade-idea/

This Wednesday turned out to be an exciting session with all 5 of my trade ideas moving in our favour right on queue.

Charts of the 5 investments moving in the directions we anticipated …
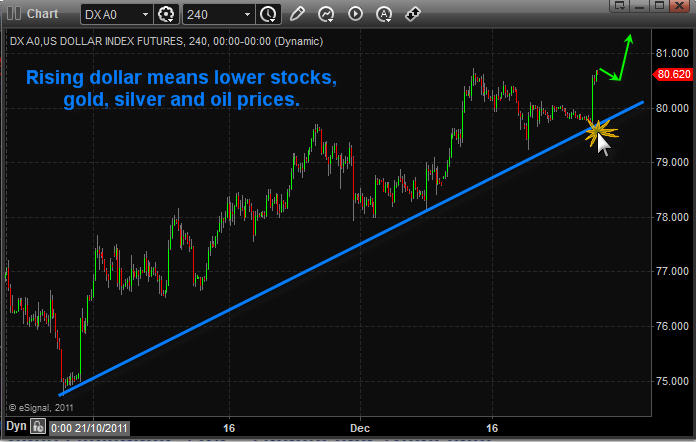
– Dollar bounced off support

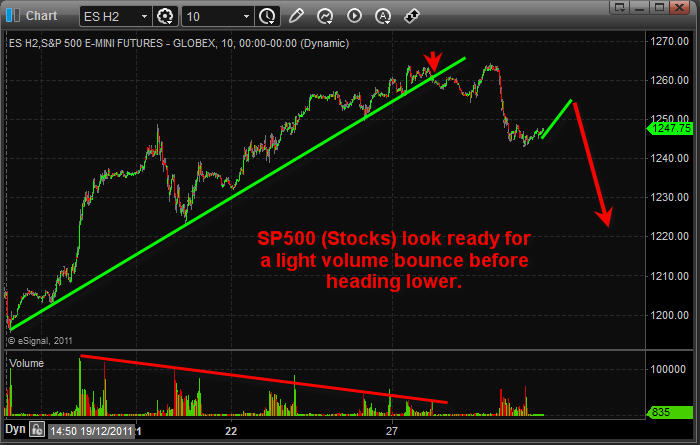
– Stocks are topping and selling off today

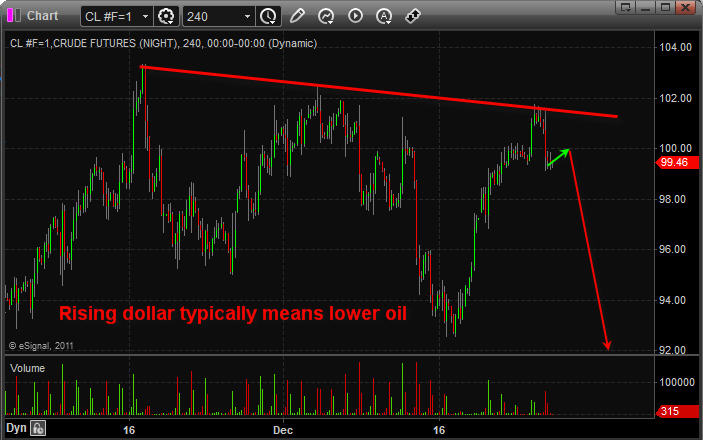
– Oil looks to have topped and is selling off

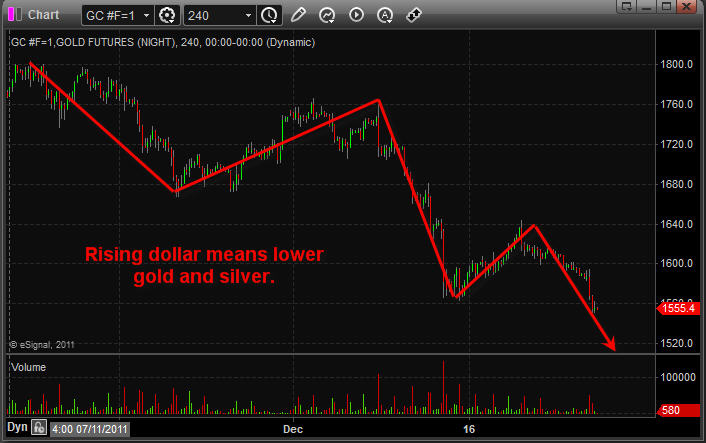
– Gold and Silver are moving lower

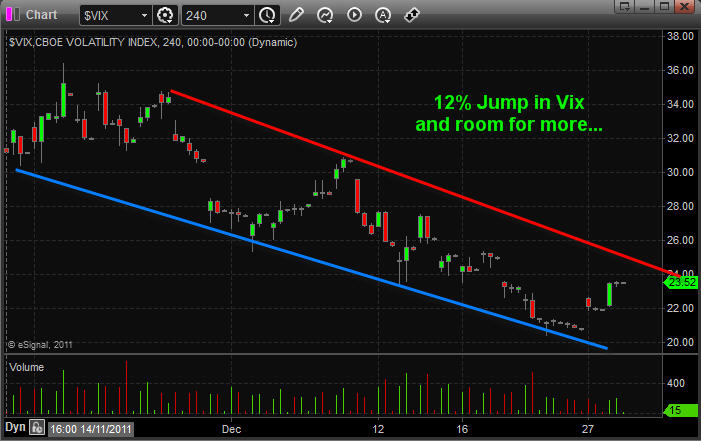
– VIX (Volatility Index) just bounced


Many of my readers took full advantage of my recent analysis and trade ideas which is great to hear.  All the different ways individuals used to make money from Friday’s analysis is mind blowing…

The most common trade is the oil one with most traders adding more to Tuesday when the price reached its key resistance level on the chart. Also many traders took partial profits Wednesday locking in 3% or more in two days using the SCO ETF.

It’s amazing how many people like to trade the vix using ETFs. The best trade from followers thus far was an 8% gain in TVIX which was bought 4 days ago anticipating the pop in volatility which I had been talking about last week. Keep in mind ETFs for trading the vix are not very good in general. I stay away from them, but TVIX is the best I found so far.

Currently stocks are oversold falling sharply from the pre-market highs. Meaning stocks have fallen too far too fast and a bounce is likely to take place Thursday.

Also we saw some panic selling hit the market today with 14 sellers to 1 buyer. That level tells me that the market needs some time to recover and build up strength for another selloff later this week or next. We will see this pause unfold when the SP500 drifts higher for a session or two with light buying volume. This will confirm sellers are in control and give us another short setup.

In my Wednesday morning video I explained how/where to set stops when using leveraged ETFs because I know 90% of traders using them do not have a clue as to how to do this and they get shaken out of their trades just before a top or bottom. So if you want to learn more about it watch this morning’s video please: http://www.youtube.com/watch?v=lDagN5Vpvys

I hope this helps you understand things more… Over time you will pickup on a lot of new trading tips, tools and techniques with this free newsletter so just give it time and keep trades small until you are comfortable with my analysis.

ONE TIME OFFER for 2012!
Learn to Trade While Making Money
http://www.thegoldandoilguy.com/specialoffer/2012TradeIdeas.html


Thus far in 2011 the overall stock market movement has been much different from what we had in 2010. This year we have seen nothing but sideways to lower prices with wild price swings on a day to day basis. There just has not been any really solid trends to take advantage of this year. Instead we had to actively trade the oversold dips and sell into the overbought rallies to just pull money out of the market on a monthly basis. Last year we saw 3 major rallies that lasted several months making it easy for anyone who bought into the trend to make money if managed properly.

Looking forward to 2012 it looks as though we are going to see some major changes unfold globally that will change the way we do things live our lives. Unfortunately its a very negative outlook but I do have hope that something will be done to perserve are somewhat normal lifestyles. I’m not one to talk doom and gloom, there are enough of those guys out there already so lets stick with the charts and focus on what is unfolding now in the present and how to take advantage of it…

The charts below show what I feel is likely to happen going into the new year IF we don’t get any major headline news in Europe that triggers another selloff.

Intermarket Analysis:

There are a lot of different things unfolding within stocks, commodities, currencies and bonds right now. And it is imporatnt to know that investments are inter-connected in some way. For example,  if one investment moves sharply in one direction it will have an effect on other investment classes.

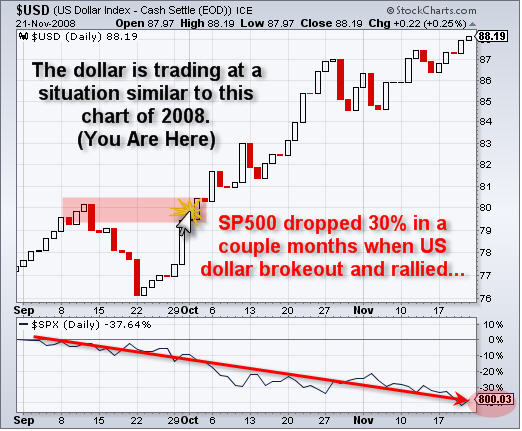
My eye is focused on the US Dollar Index which has recently had a strong run up in price. For the past couple years we have seen stocks fall when the dollar moves up. So with the dollar index now trading at a key resistance level we should see the dollar top out for a few weeks and spark a Christmas rally into year end. After that, all bets are off and we re-analyze…

On the flop side of things, if Europe comes out with major negative headline news we could see the dollar index continue its rally and breakthrough this resistance level. If the dollar moves higher from here we could easily see a multi month run up in the dollar. You do not want to be long stocks if this happens, get short stocks and hold on tight.

Dollar ETF Trading


Gold Daily Chart Analysis:

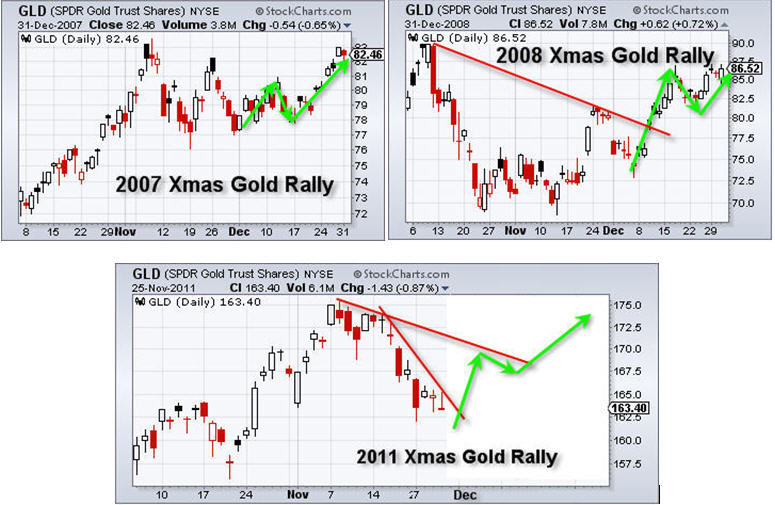
Here is my positive out look for gold and what I feel is likely to unfold near term. But keep in mind what I just said about the US dollar index above. If the dollar continues its rally and breaks out it could actually put some pressure on gold. I know gold is a safe haven so I do expect it to hold up, but a strong dollar will neutralize a lot of the buying in gold in my opinion.

Gold Christmas Rally


SP500 Daily Charts:

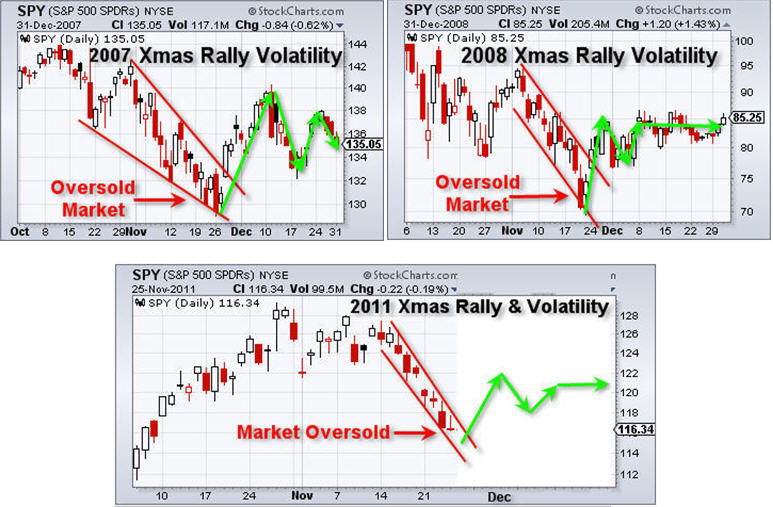
Stocks should have a solid bounce this December if the dollar finds resistance and pulls back in the coming weeks. I am expecting a bounce of 5-10% if all goes as planned.

SP500 Christmas Rally


Christmas Holiday Rally Trading Conclusion:

In short, we are entering a tough time to trade the market. Volatility is low, there are a few holidays and typically we see volume thin out as December unfolds. Light volume generally favors higher prices for stocks and commodities which is one of the reasons we get the holiday lift in prices.

The recent selloff in stocks is looking overdone to the down side and ready to bounce any day. So I am looking for signals to get long the SP500. Overall risk remains very high as sellers are still in control of the market and because we are looking to put on a trade against the intermediate trend which is down.

On Friday morning myself and my followers exited our short position on the SP500 at the open locking in 13.5% profit. We exited the position because the intraday charts are showing signs of a potential bottom and we want to avoid the tear your face off short covering rally that I feel is just around the corner. Now we are waiting for a another low risk setup and will take action to go long or short depending how things unfold in Europe.

I hope this report helped shed some light on the current market condition for you. Remember you can Get my daily pre-market trading videos, intraday updates , and trade alerts with my premium newsletter: www.TheGoldAndOilGuy.com

Chris Vermeulen

Get these Free Weekly Reports EVERY WEEK

Over the recent couple months the precious metals charts have made some sizable moves. Most investors and traders were caught off guard by the sharp avalanche type selloff and lost a lot of hard earned capital in just a few trading sessions. Gold dropped over 20% and silver a whopping 40%.

The crazy thing about all this is that these types of moves in precious metals can be avoided and even taken advantage of in certain situations. There is no reason for anyone to continue holding on to those positions after they pullback 6% of more because of the type of price and volume action both gold and silver had been displaying in the past few sessions.

I warned investors on Aug 31st that precious metals were about to top any day and that protective stops should be tightened or taking profits was also a smart move. It was only 2 trading sessions later that precious metals topped and went into a free fall. You can get my detailed analysis if you read my report Dollar’s On the Verge of a Relief Rally Look Out!”.

A couple weeks later once precious metals has found support and the uneducated investor’s were licking their wounds wondering what the heck just happened to their trading accounts… I put out another report but this time with a bullish outlook. Silver was currently trading at $29.96 and I had a $35-$36 price target over the next two months. Gold was trading down at $1611 and I saw it heading back up to $1750-$1775 area before finding resistance and pulling back. Both these forecasts were reached over the next two months. You can quickly review the report called “Precious Metals Charts Point to higher Prices” for more info.

With all that said, what exactly are the charts saying right now?

Current Precious Metals Charts Summary:

The past 6 weeks we have been watching both gold and silver struggle to hold up but they have managed to grind their way to my price targets. After reaching those targets a couple weeks ago sellers have stepped back into the precious metals market and put pressure these metals.

Last week gold and silver started to pullback in a big way with rising volume. This could just be the start of something much larger which I will cover in just a moment.

The wild card for precious metals and for every stock and commodity for that matter is Europe. Every other day there seems to be headline news moving the market and most of takes place in overnight trading for those of us living in North America. It’s this wild card which is keeping me from getting aggressive in the market right now.

Let’s take a look at the charts…

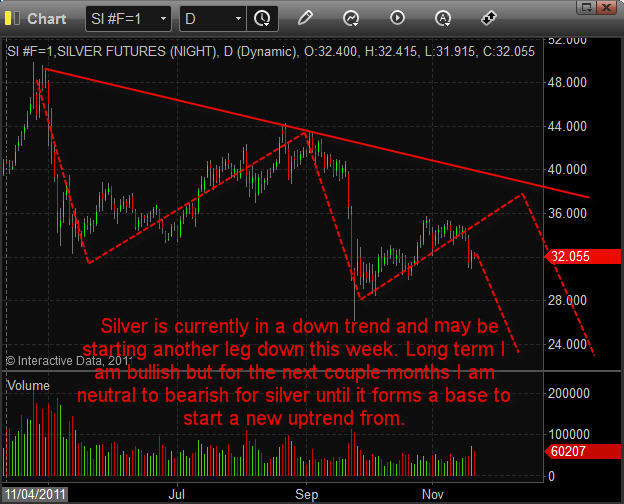
Silver Precious Metals Chart:

Silver is currently in a down trend and may be starting another leg down this week. Long term I am bullish but for the next couple months I am remain neutral to bearish for silver until it forms a base to start a new uptrend from.

Precious Metals Charts

Precious Metals Charts


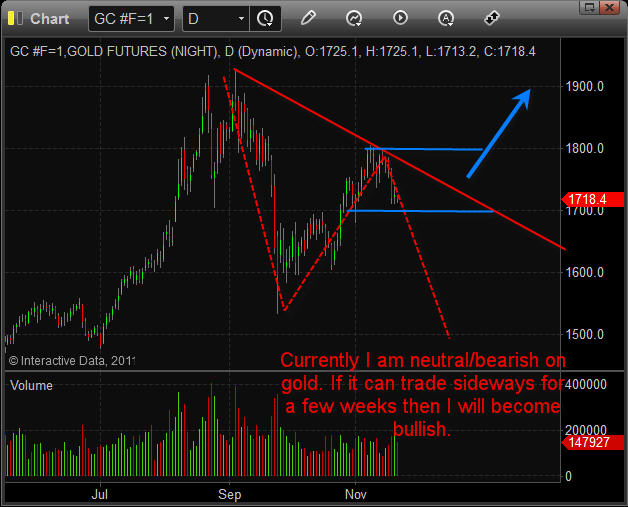
Gold Precious Metals Chart:

Currently I am neutral/bearish on gold. If it can trade sideways for a few weeks then I will become bullish.

Precious-Metals-Charts

Precious-Metals-Charts


Precious Metals Charts Conclusion:

In short, I feel there is a good chance the US dollar will continue higher and if that happens we should see strong selling in North American equities, commodities and likely on the precious metals charts.

Financial markets around the world are at a tipping point meaning something really big is about to take place. The question is which way will investment move. The only thing we can do is trade with the current trends, price patterns and volume.

At this time I still see a higher dollar and that means lower stocks and commodities. This could change at the drop of a hat depending on the news that comes out of Europe so the key to trading right now is to remain cash rich and taking only small positions in the market.

If you would like learn more about etf trading and receive my daily pre-market videos, intraday updates and detailed trade alerts which even the most novice trader can follow then join my FREE trading education newsletter and my premium trading alert service here: http://www.GoldAndOilGuy.com

Chris Vermeulen