Posts

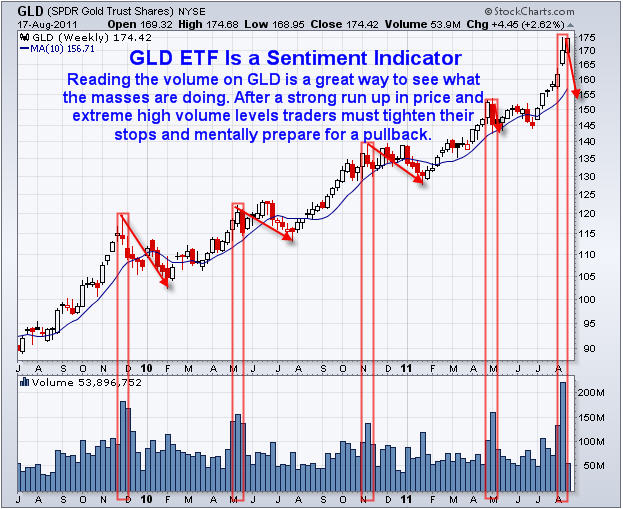
The past few weeks traders and investors have been completely spooked from the surge of negative news and collapsing stock prices. This fear can be seen by looking at the volume on the GLD gold ETF fund. With gold being in the spot light for several years now and the fact that anyone can own gold simply through buying some GLD shares. It only makes sense that reading the volume on this chart gives us a good feel for what the masses are feeling emotionally.

If we step back to trading basics we know that fear is the strongest force in the financial market for moving prices. And that there are a few ways to read fear in the market and the more which line up at the same time means there is a higher probability of trend reversal in the near future.

The first thing I look for is a rising volatility index (VIX). This index rises when investors become fearful of stock prices falling be hedging positions or flat out buying put options to profit from a falling market.

Second, I look for a high selling volume ratio meaning at least 3:1 shares traded are from individuals hitting the sell button in a panic thinking that the market is about to collapse.

And last but not least… I look at the GLD gold etf volume and price action. A surge in GLD volume after a strong move up means everyone is scared and dumping their money into a safe haven.

Let’s take a look at some charts to get a better feel.

GLD Weekly Gold Chart:
As you can see there are sizable price movements which ended with strong volume surges. Those volume surges mean that the majority of investors have reached the same emotional level and bought gold for safety (GLD ETF). Keep in mind that the big money players and market makers can see this taking place and that is when they start selling into that surge of buying volume locking in maximum gains before there are no more buyers left to hold the price up. Tops generally take a few weeks to form so don’t expect a one day collapse.

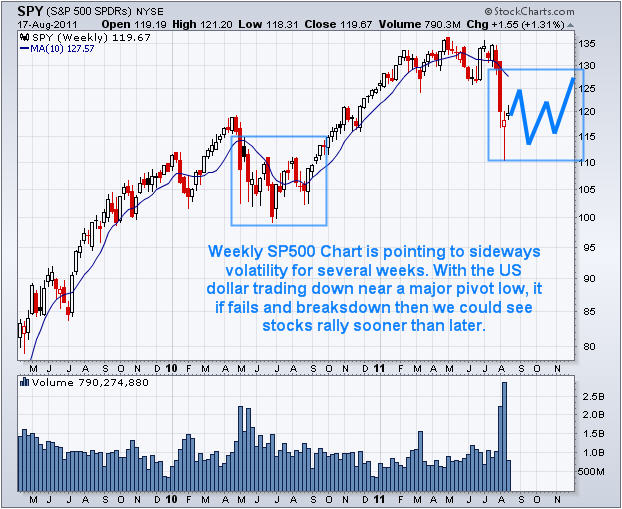
The recent rally in gold has taken place when stocks have fallen sharply. Money has been pulled out of stocks and pushing into gold but I think that is about to change…

SPY Weekly SPX Chart:
The past month has been a blood bath for stocks. But from looking at the charts, volume and the fear in the market I can’t help but think we are going to see higher stock prices as investors see stocks moving higher, they will pull money out of gold and dump it back into stocks and likely high dividend paying stocks…

Mid-Week Trading Conclusion:
In short, everyone piled into gold sending it rocketing higher and I feel it has moved to far – to fast and is ready for a pullback (pause lasting 2-12 weeks). In association with gold’s pullback I feel investors are now realizing they sold their stocks at the bottom of this correction because fear took hold of their investing decisions. Now they are starting to think about getting long stocks but it still may be a bumpy ride for a few weeks yet…

Consider subscribing so that you will be consistently informed, have 24/7 Email access to me with questions, and also get Gold, Silver, SP500 and Oil Trend Analysis on a regular basis. Subscribe now http://www.thegoldandoilguy.com/trade-money-emotions.php

Chris Vermeulen

DZZ Double Gold ETN is a relatively new way to take advantage of gold price action. This gold fund provides double the movement that the GLD ETF or the price of gold does, providing bigger opportunities in the gold sector. I have just recently started to use DZZ ETN for trading and have found it to be very useful, which you will see in the charts below.

A Couple of Benefits of the New DZZ Gold ETNThe fact that it’s a leveraged fund provides more of an opportunity to the small investor, as they can have twice the amount of gold exposure without having to use margin, pay interest, and open a margin account. While trading with leverage is a two sided knife, if done properly, potential higher annual profits can be obtained.

Another reason gold ETN’s are becoming popular is because they allow gold traders and investors to trade both sides of the gold sector within their 401k, IRA and for Canadian their RRSP accounts. Being able to take advantage of the short side during bear market conditions, can double your annual return on investment.

Now let’s look at our current charts and see how this fund can be used.

Gold Bugs Index – Monthly Gold Chart Breakdown

Gold Stocks Index Monthly Breakdown

Gold Stocks Index Monthly Breakdown

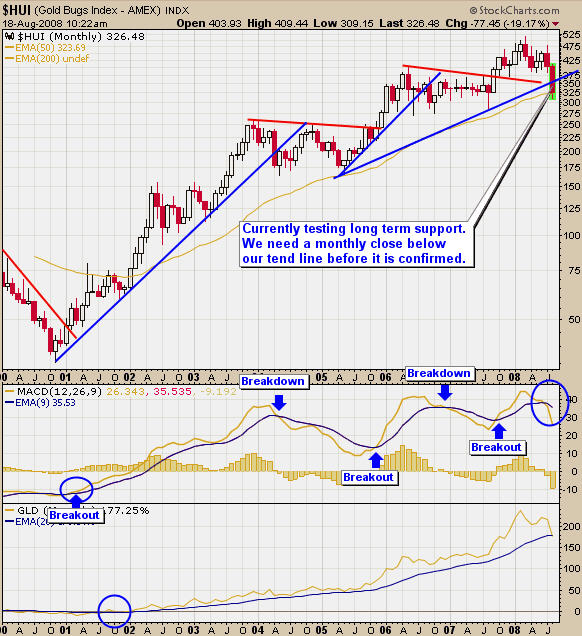
As you can see on the monthly chart, the gold bugs index is breaking down below our support trend line. We could be entering a much larger consolidation phase or maybe even a bear market. It really does not matter, as we can take advantage of both sides of gold (long and short). The short side actually has more potential in my opinion, but most traders prefer to trade the long side as it’s what everyone learns first and feels comfortable with.

Gold Miner Stocks Index – Weekly Chart Breakdown

Gold Mining Stocks Weely Breakdown

Gold Mining Stocks Weely Breakdown

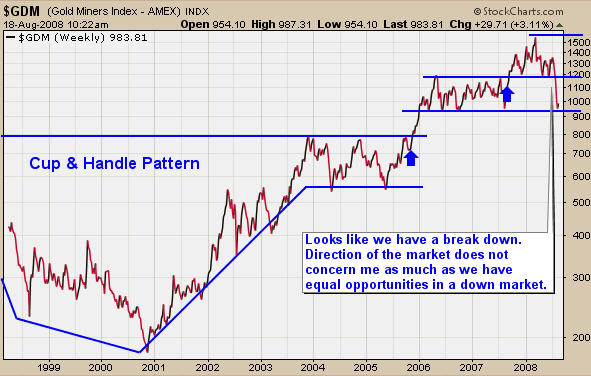
The gold miner stocks index has given us a breakdown, as well as showing that a short play is not fighting the current short term trend of gold. It is now testing support, which means short traders should tighten their stops to lock in more profits when gold decides to bounce.

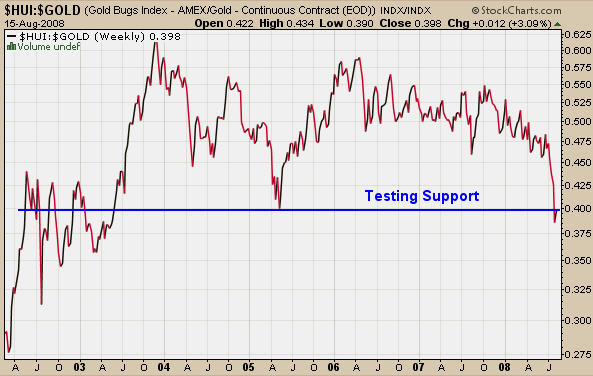
Gold Bugs vs Gold Price – Weekly Gold Chart at Support

Gold Stocks vs Price of Gold Chart

Gold Stocks vs Price of Gold Chart

Gold stocks are testing a support level, as they have declined in value against the price of gold, showing that a large number of investors have been scared out of their positions and thus forcing gold stocks down more than normal.

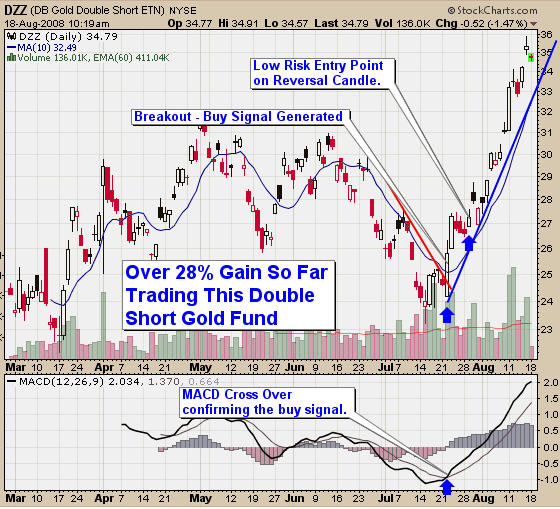
DZZ Gold ETN – How to Short Gold by Going Long

DZZ Gold ETN Short Trading Signal

DZZ Gold ETN Short Trading Signal

Recently we had a buy signal for the DZZ gold ETN, which has provided an excellent low risk setup near the end of July. Currently the trade is up over 28% in just 3 weeks. While we look for the same type of setup for going short, there is one important point to note. When trading GLD or any other stock, index or futures contract to the long side it’s important not to enter a setup with a steep vertical support trend line, as it generally will not continue for any length of time. But trading to the short side like this DZZ trade, the trend lines can be steeper, as prices generally drop much faster, thus pushing our Short Gold ETN fund higher.

This is just one example of how to trade gold to the long and short side, if you would like to learn more please visit my website: www.TheGoldAndOilGuy.com