Posts

Moe and I had a great call today as we both get into some details on the markets. Moe is a 40-year veteran of the markets and we see the markets in a similar way. We talk about how to trade, have a listen and our conversation starts at the 23minute mark if you want to fast track things.

If you want to improve your accuracy and opportunities for success, then we urge you to visit www.TheTechnicalTraders.com to learn how you can enjoy our research and our members-only trading triggers (see the first chart in this article).  If you are managing your retirement account or 401k, then we urge you to visit www.TheTechnicalInvestor.com to learn how to protect your assets and grow your wealth using our proprietary longer-term modeling systems.  Our goal is to help you find and create success – not to confuse you.

In closing, we would like to suggest that the next 5+ years are going to be incredible opportunities for skilled traders.  Remember, we’ve already mapped out price trends 10+ years into the future that we expect based on our advanced predictive modeling tools.  If our analysis is correct, skilled traders will be able to make a small fortune trading these trends and Metals will skyrocket.  The only way you’ll know which trades to take or not is to become a member.

Chris Vermeulen
Chief Market Strategist
Founder of Technical Traders Ltd.

Both Gold and Silver Futures have been struggling to rally above recent high levels since the start of the global stock market collapse related to the COVID-19 virus event.  Yet, the Junior Gold Miners appear to be telling us the Precious Metals market is boiling hot.

Gold, the bell-weather safe-haven asset, initially collapsed when the US stock market started the massive selloff in late February 2020, then recovered to higher price levels near $1785 recently.  Since reaching these levels, Gold has stalled into a sideways price flag near major resistance.

Silver, on the other hand, is trading near $15.60 and has yet to really recover to anywhere near the levels it had achieved in early January 2020 (near $18.60).

Well, GDXJ, the Junior Gold Miners ETF, is suggesting a very strong price rally is taking place that may push both Gold and Silver substantially higher.  Key resistance exists near $46.50.  Once broken we believe a very strong price rally will take place pushing GDXJ price levels to $51 or $52.  After that, a brief downside rotation will potentially retest the $47 to $48 levels before an even bigger upside rally takes place.  What is even more important is that we believe this big breakout move could start as early as next week, May 12th or after.

Before you continue, be sure to opt-in to our free market trend signals
before closing this page, so you don’t miss our next special report & signal!

GDXJ DAILY CHART

This GDXJ Weekly chart highlights the same price pattern and shows why we believe the upside price breakout could be a massive new trend.  The Deep price low setup because of the COVID-19 virus event creates a very big price range for any future price advancements.  That $24 price range, if applied to price levels before the breakdown event near $41, may suggest GDXJ could rally to levels above $65 over the next few weeks or months.

GDXJ WEEKLY CHART

CONCLUDING THOUGHTS:

We believe the upside rally in both Gold and Silver recently is a very good indication that the sideways price channel that has plagued precious metals recently may be ending.  If precious metals prices begin to rally, then GDXJ will break the upper $46.50 resistance level and begin a new upside price rally clearing the resistance setup before the virus event began.

Get ready, this could be a very big move higher for Junior Miners and it could align with our May 8th through May 12th global market inflection point prediction.

If you are using our free public research for your own trading decision-making and/or using it as an opportunity to find and execute successful trades, please remember you are the one ultimately making the decisions to trade based on our interpretation and free research posts.  We, as technical traders, will continue to post new research articles and content that we believe is relevant to the current market setups.

If you want to improve your accuracy and opportunities for success, then we urge you to visit www.TheTechnicalTraders.com to learn how you can enjoy our research and our members-only trading triggers (see the first chart in this article).  If you are managing your retirement account or 401k, then we urge you to visit www.TheTechnicalInvestor.com to learn how to protect your assets and grow your wealth using our proprietary longer-term modeling systems.  Our goal is to help you find and create success – not to confuse you.

Our researchers will generate free research on just about any topic that interests them.  As technical traders, we follow price, predict future price moves, tops, bottoms, and trends, and attempt to highlight incredible setups that exist on the charts.  What you do with it is up to you.  Visit www.TheTechnicalTraders.com/FreeResearch/ to review all of our detailed free research posts.

In closing, we would like to suggest that the next 5+ years are going to be incredible opportunities for skilled traders.  Remember, we’ve already mapped out price trends 10+ years into the future that we expect based on our advanced predictive modeling tools.  If our analysis is correct, skilled traders will be able to make a small fortune trading these trends and Metals will skyrocket.  The only way you’ll know which trades to take or not is to become a member.

Chris Vermeulen
Chief Market Strategist
Founder of Technical Traders Ltd.

Chris Vermeulen – www.TheGoldAndOilGuy.com

It is an endless debate for investors interested in gold. Should they buy a direct play on the gold price, either gold bullion itself or even so-called paper gold with an ETF such as the SPDR Gold Shares (NYSEArca: GLD)? Or should they invest into gold equities, particularly the larger, higher quality gold mining companies?

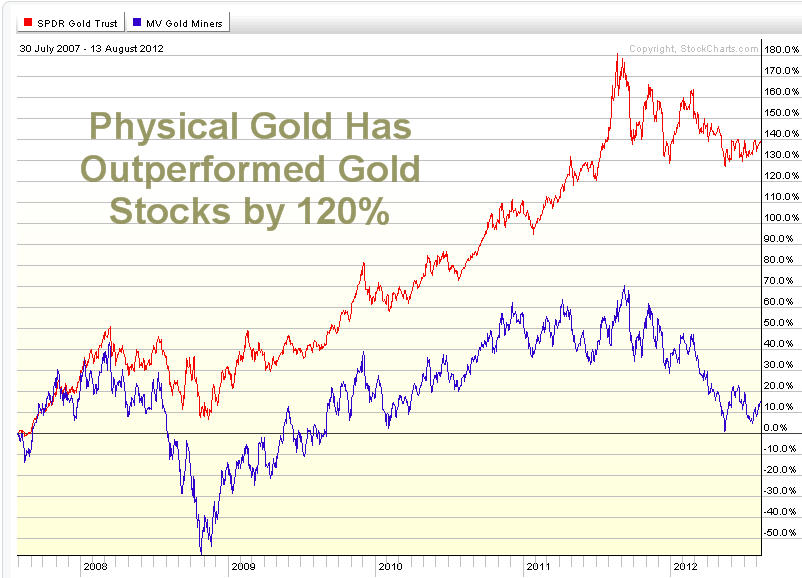
Recent history suggests the answer is gold itself. According to Citigroup, physical gold has outperformed global gold equities 120% percent of the time over the past 5 years. Stocks of the bigger gold mining firms seem to react adversely to bad news (which is normal), but the problem is they react with no more than a yawn to good news. These type of stocks are contained in the Market Vectors Gold Miners ETF (NYSEArca: GDX).

Gold Mining Stocks ETF - GDX

Gold Mining Stocks ETF - GDX

Evidence of this trend can been see in the latest news to hit the industry…the slowdown in expansion as recently signaled by the world’s largest gold producer, Barrick Gold (NYSE: ABX). The company’s stock has fallen by more than 30 percent over the last year due to cost overruns at major projects. The latest blowup in costs of up to $3 billion occurred in its estimate for development of its flagship Pascua-Lama project on the border of Chile and Argentina. The project may now cost up to $8 billion.

In addition, Barrick decided to shelve the $6 billion Cerro Casale in Chile and the $6.7 billion Donlin Gold project in Alaska. Barrick is not alone in its thinking among the major gold producers. The CEO of Agnico-Eagle Mines (NYSE: AEM), Sean Boyd, recently said “The era of gold mega-projects may be fading. The industry is moving into an era of cash flow generation, yields and capital discipline.”

Fair enough. But are gold mining companies’ management walking the walk about yields or just talking the talk? Last year, many of the larger miners made major announcements that they would be focusing on boosting their dividends to shareholders in attempt to attract new stockholders away from exchange traded vehicles such as GLD, which have siphoned demand away from gold equities. Barrick, for example, did boost its dividend payout by a quarter from the previous level. Newmont Mining (NYSE: NEM), which has also cut back on expansion plans, has pledged to link its dividend payout to the price of gold bullion.

So in effect, the managements at the bigger gold mining companies (which are having difficulties growing) are trying to move away from attracting growth-only investors to enticing investors that may be interested in high dividend yields. This is a logical move.

But rising costs at mining projects may put a crimp into the plans of gold mining companies’ as they may not have the cash to raise dividends much. And they have done a poor job of raising dividends for their shareholders to date. In 2011 the dividend yields for gold producers globally was less than half the average for the mining sector as a whole at a mere 1.3 percent. Their yields are below that of the base metal mining sector and the energy sector.

It seems like management for these precious metal companies have the similar emotional response shareholders have when they are in a winning position. When the investor’s brain has experienced a winning streak and is happy it automatically goes into preservation/protection mode. What does this mean? It means management is going to tight up their spending to stay cash rich as they do not want to give back the gains during a time of increased uncertainty. Smaller bets/investments are what the investor’s brain is hard wired to do which is not always the right thing to do…

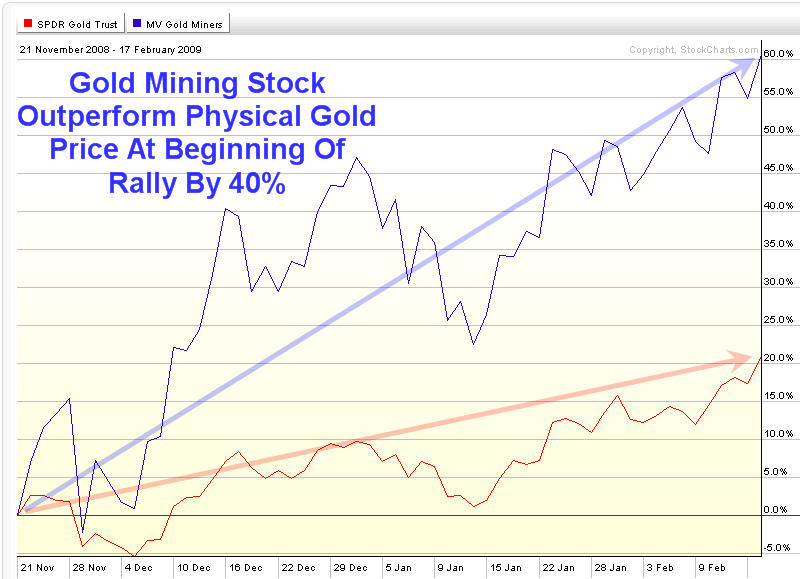
Looks like there is still a lot work to be done by gold mining companies’ to improve returns to their shareholders. But with all that set aside it is important to realize that when physical gold truly starts another major rally. These gold stocks will outperform the price of gold bullion drastically for first few months.

Gold Stock Rally

Gold Stock Rally


Gold Miner Trading Conclusion:

In short, last weeks special report on gold about how gold has been forming a major launch pad for higher prices over the past year. Gold bullion has held up well while gold miner stocks have given up over 30% of their gains. If/when gold starts another rally I do feel gold miner stocks will be the main play for quick big gains during the first month or two of a breakout. The increased price in gold could and value of the mining companies reserves could be enough to get management to start paying their investors a decent dividend which in turn would fuel gold miner shares higher.

Both gold and silver bullion prices remain in a down trend on the daily chart but are trying to form a base to rally from which may start any day now. Keep your eye on precious metals going into year end.

If you would like to get my weekly analysis on precious metals and the board market be sure to join my free newsletter at www.TheGoldAndOilGuy.com

Chris Vermeulen

The market continues to whipsaw traders out of positions as volatility rises. I have put together a few charts to show you where each of our commodities are trading along with the SPX (SP500 index).

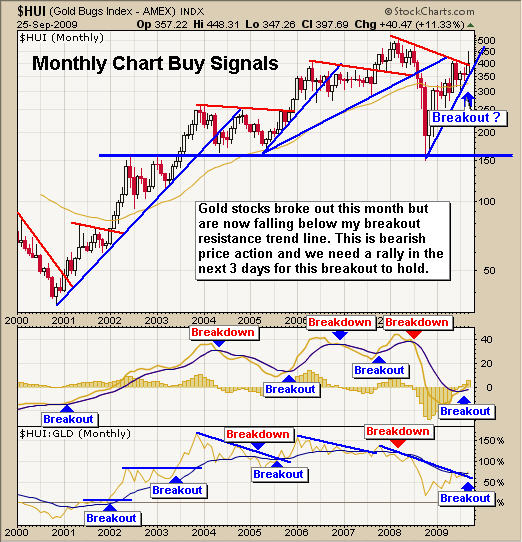
My Gold Stock Breakout Model – Monthly Chart
I use this chart to keep my big picture trades on the right side of gold. I found that gold stocks tend to lead the price of gold so watching this gold stock index on the monthly, weekly and daily charts can provide me with short term tops and bottoms for trading gold bullion, GLD or DGP exchange traded funds.

The monthly chart clearly shows the rally in stocks has now sold back down to my resistance trend line. If we do not get a rally this week in gold stocks, then I think we could see gold trade sideways or down for several months.

HUI Gold Stock Newsletter

HUI Gold Stock Newsletter

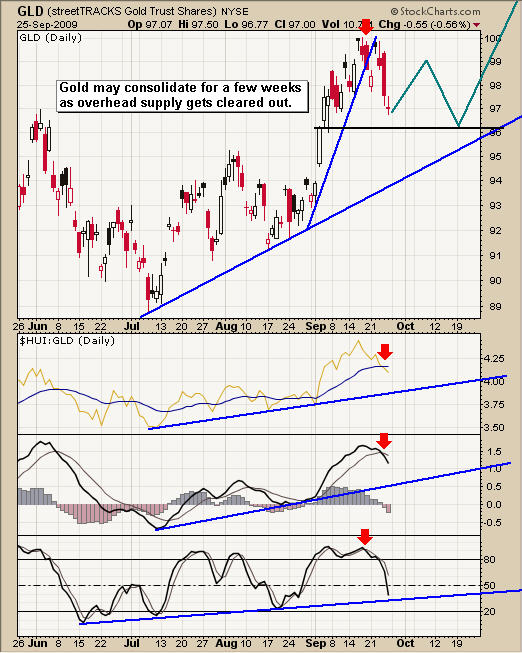
GLD Gold ETF Trading Fund – Newsletter
The daily gold bullion fund shows the recent price action and what I think could happen in the coming weeks. In the past couple days gold has moved to a short term support level where I think we could see buyers step in.

We took some profits near the high and continue to hold a core position until we have another technical breakdown or new setup to add more to the position again.

GLD Gold ETF Trading Newsletter

GLD Gold ETF Trading Newsletter

SLV Silver ETF Trading Fund – Newsletter
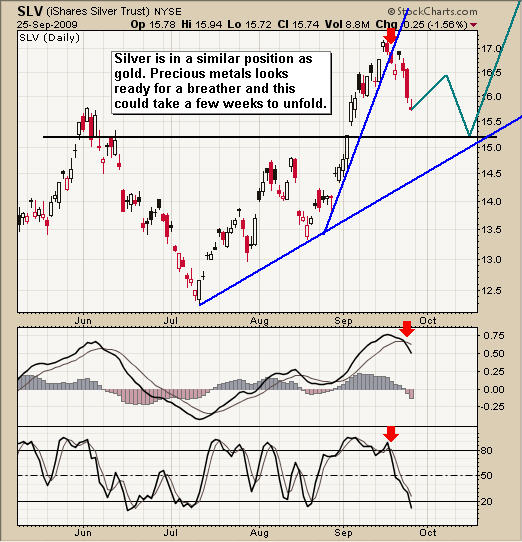
Silver is in the same boat as gold. We have taken some profits and are still holding a core position with protective stops in place just incase the market does head lower from here.

Silver SLV ETF Trading Newsletter

Silver SLV ETF Trading Newsletter

USO Crude Oil Trading Fund – Newsletter
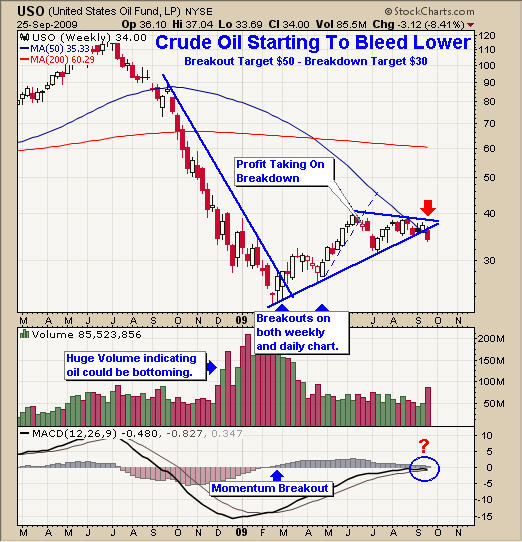
Crude oil started to bleed lower last week as the price sliced through the multi month support trend line. Volume shot up as stop orders get triggered on the way down. We finally have a move outside of the pennant formation that has been in place for several months. Now we can start looking for a low risk setup for trading crude oil again.

Crude Oil USO Trading Newsletter

Crude Oil USO Trading Newsletter

UNG Natural Gas Trading Fund – Newsletter
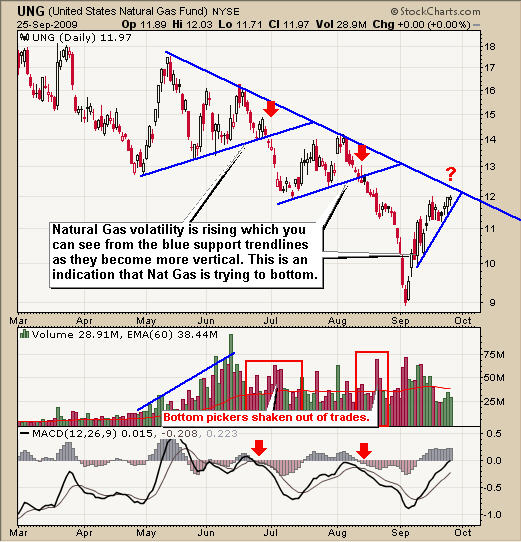
Natural gas has really come back to life. I mentioned on September 2nd that natural gas (UNG) looked like a buy between $9 – $9.50 and it has now rallied 25% since that point. But stepping back and looking at the chart we can see resistance is hovering over head between the $12 – $12.25.

I may send out a setup for a short play if we get one but I feel the heavy sell off in August was the final wave down, flushing out traders. Speculative traders seem to have moved into natural gas and I think they will continue to buy it for some time. Pullbacks will be sharp but most likely followed with more buying as we enter the cooler months of the year.

Natural Gas UNG Trading Newsletter

Natural Gas UNG Trading Newsletter

SPX Index Trading – Active Trading Partners
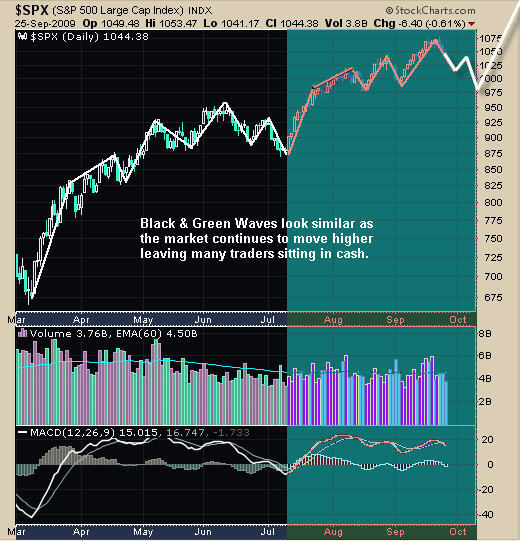
I thought that I would show a quick picture of the SPX because it shows the psychology of traders and how it repeats it’s self over and over. The black and green waves are virtually the same patterns.

I feel as though the market is ready for a larger pullback than what we had in June/July but my focus will be to buy in the oversold dips and lighten my positions in overbought conditions (scaling in and out of positions) until the trend confirms it has reversed.

SPX SP500 Trading Newsletter

SPX SP500 Trading Newsletter

My Market Trading Newsletter Conclusion:
Gold stocks are pulling back and precious metals continue to move with the overall market action. I do feel that gold and silver will break this relationship and start to move higher in the coming months but until that happens I remain cautious with my positions tightening my stops.

Crude oil is starting to come alive and I am now looking for some low risk setups for energy related funds. Last week’s technical breakdown could provide us with a big move in the coming months.

Natural Gas continues to hold up but is now trading near resistance. Depending how many spec traders there are still lingering around (as most lost their shirts in the recent months), will dictate how much higher natural gas will move. The 25-30% rally in the past month has been very powerful and this could be just the beginning. I am now waiting for another setup that could be a long or a short trade depending on what happens next.

If you would like to get my Bi-Weekly Trading Reports via email please visit my websites at: www.TheGoldAndOilGuy.com for commodities and www.ActiveTradingPartners.com for Stock Trading.

I hope everyone had a great weekend!
Chris Vermeulen