Posts

The financial markets continue to climb the wall of worry on the back of more Fed Quantitative Easing. Those trying to pick a top in this choppy bull market may prove to be correct for a couple hours but over time the shorts continue to get clobbered.

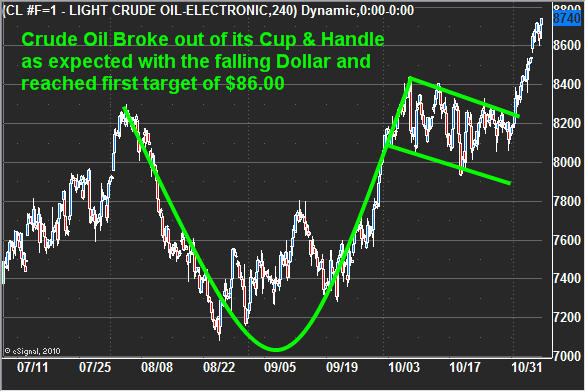
Quantitative easing was enough to turn gold back up and gave oil just enough of a nudge to breakout of its cup and handle pattern explained later.

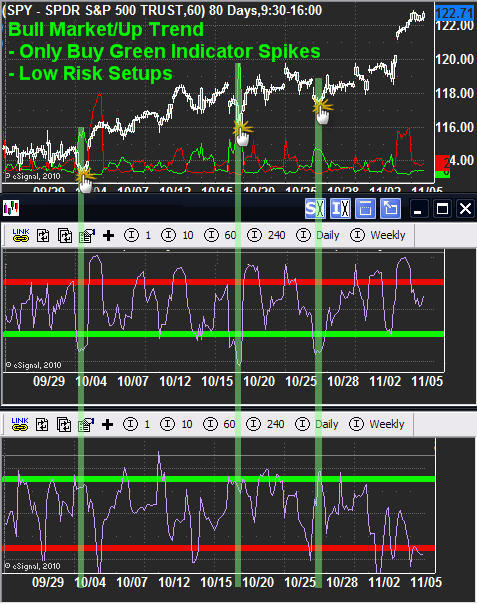
The past few weeks the number of emails I receive on a daily basis about what individuals should do about short positions they took on their own has growing quickly. Usually when my inbox starts to fill up with traders holding heavy losses trying to pick a top I know something big is about to happen and its not going to be in the favor of the herd (everyone shorting). In the past couple week there have been some great entry points for the broad market whether its to buy the SP500, Dow, NASDAQ or Russell 2K. I focus on trading with the trend and entering on extreme sentiment readings as shown in the chart below.

Extreme Trend Trading Analysis

Below are my main market sentiment indicators for helping to time short term tops and bottoms. That being said I don’t pick short term tops in hopes to profit on the down side. Rather I wait for a extreme sentiment bottom to be put in place, then enter long with the up trend (Buy Low).

Once there is a 1-2% surge in price and sentiment indicators are showing a short term top I like to pull a little money off the table to lock in some profits while still holding a core position (Sell High). This is exactly what I/subscribers have done over the last couple weeks. This is a simple yet highly effective strategy and works just as well in a down trend except I focus on shorting extreme sentiment bounces. Subscribers know what these indicators are as I cover them each week in my daily pre-market trading videos as we prepare for the day ahead.

SPX Running Correction

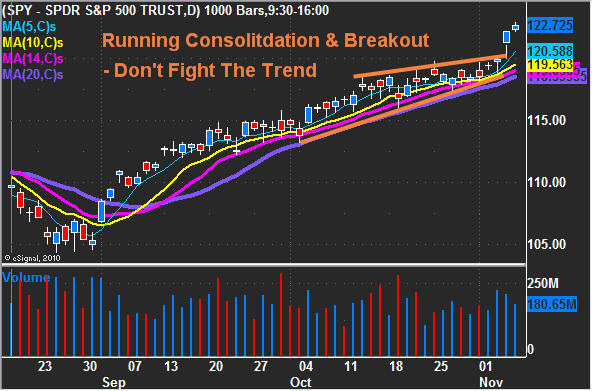
Since early September the equities market has been on fire. In late September the market was extremely toppy looking and trading at key resistance levels from prior highs convincing a lot of traders to take a short position. But instead of a correction the market surged and has since continued to grind its way up week after week.

This rising choppy price action can be seen two ways:
1. As a rising wedge with a blow off top (Bearish)
2. Or as a Running Consolidation (Bullish)

The running consolidation happens when buyers are abundant picking up more shares on every little dip. Overall looking at the intraday price action you will see market shakeouts as it tries to buck traders out before it continues higher. This choppy looking market action if not read correctly looks extremely bearish to the novice trader and the fact the market is so overbought it easily convinces them to take short positions. This choppy action is just enough to wash the market of weak positions before starting another run up.

All that said, both a blow off rising wedge and a running correction are very bullish patterns for a period of time. Again I cannot state it enough, trade with the trend and the key moving averages.

Gold Shines On The Daily Chart

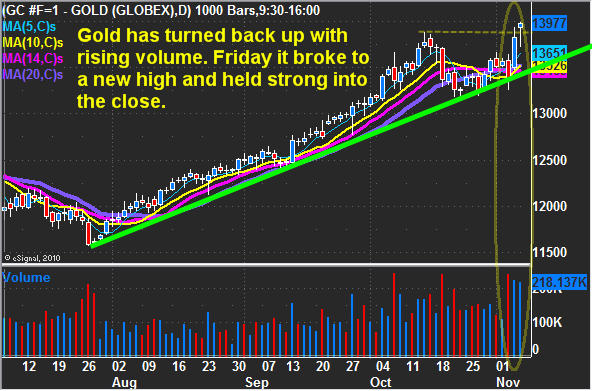
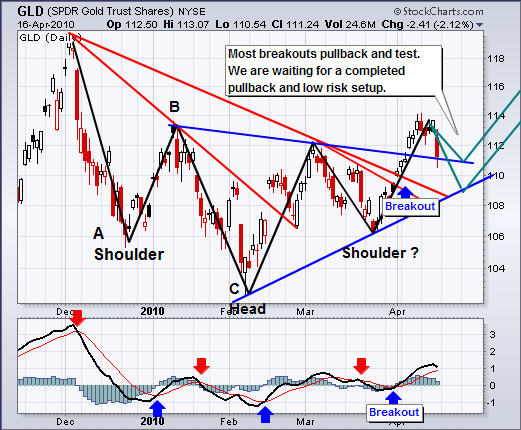
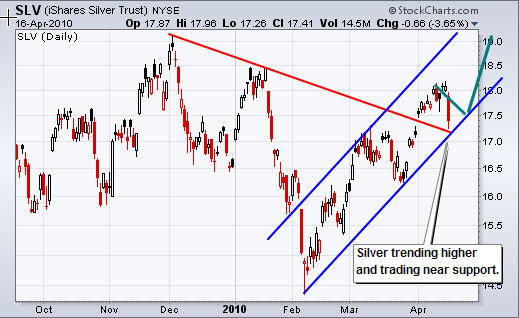
The gold story is straight forward really… Trend is up, quantitative easing is back in action and that is helping to list gold and silver prices. Key moving averages have turned back up and gold closed at a new high which shows strength.

Golden Rocket

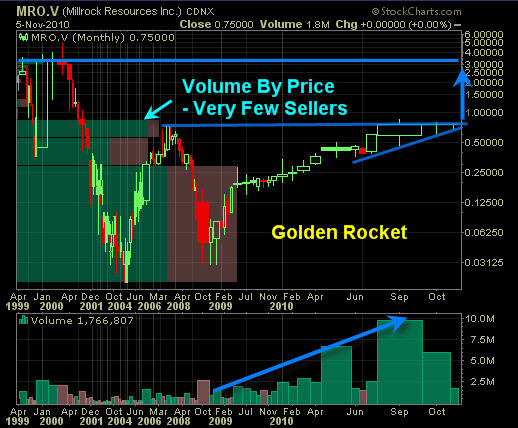
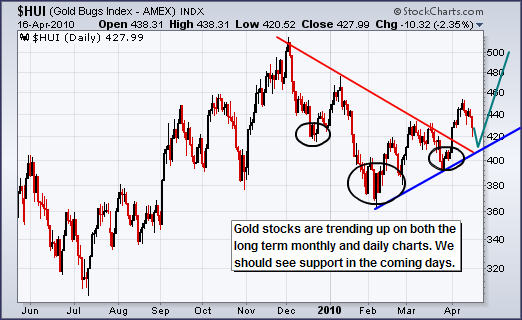
With another round of quantitative easing just starting and gold making another new high last week there is a very good chance gold stocks will rocket higher in the coming 8 months. I have been following Millrock Resources Inc. because of the team involved with this company. A breakout to the upside here could post some exciting gains if you take a look at the chart and see where the majority of volume has traded over the years along with the bullish chart patterns (Cup & Handle/Rising Wedge) with strong confirming volume. From 84 cents to the $3.50 area there should not be many sellers other than traders slowing taking profits on the way up.

Crude Oil Breaks Out Of Cup

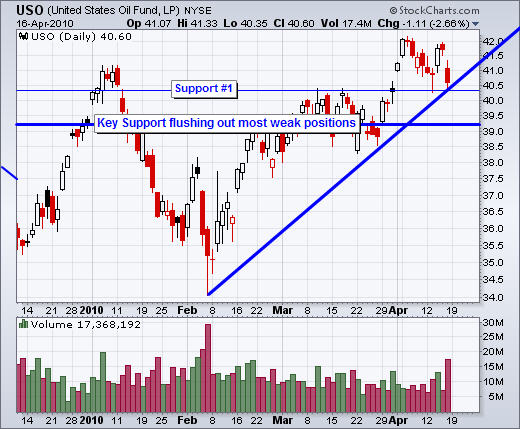
Crude oil has been dormant the past few weeks even though the US Dollar has plummeted. But last week’s news on more QE was enough to send oil higher. The surge took oil prices straight to the 2010 highs as expected and blew past my first target of $86.00 per barrel. I figure it will consolidate here for a while until we see if the dollar bottomed last week or is just testing the breakdown level.

Weekend Trading Conclusion:

In short, the market has played out exactly as we planned and all four of our positions are deep in the money. As we all know the market goes in waves in both price and for trade setups. The past couple weeks were great for getting into trades and now the market is running in our direction. It will take a few days for the market to stabilize (pullback or pause) before we could get anther round of trade setups. Keep position sizes small as the market remains overbought and a sharp correction could happen at any time. Until then, keep trading with the trend.

Disclaimer: I own shares of SPY and MRO.V

Get My Daily Pre-Market Trading Videos, Daily Updates & Trade Alerts Here: www.TheGoldAndOilGuy.com

Chris Vermeulen

by Jeff Clark, Editor of BIG GOLD

October 27, 2008 was the gold mining sector’s Black Monday, the day nearly every stock hit rock bottom. Hindsight makes it plain they got caught in the violent deleveraging that sucked down every equities market in the world.

The broader markets were of course making year-to-date lows at the same time, and unlike gold stocks, they continued falling after a short intermission. In fact, the Dow fell 2,000 points after Obama was elected. In sharp contrast, the mining stocks went on a tear. Between November ’08 and January ’09, many of our BIG GOLD picks made substantial gains, rising anywhere from 45% to 149%.

This good news isn’t the whole story, of course; many mining stocks saw percentage losses greater than the broader market averages during the Big Selloff. But given the fact that gold stocks started rebounding while the broader markets continued lower, the BIG GOLD portfolio ended the year down 24% while the S&P lost 38%. We were also glad to see our portfolio responded better than the HUI; the broad-based mining index lost 32% on the year. Meanwhile, the demand for physical gold and silver was surging, likely attributed to investors who’d been spooked by the broad meltdown.

We held on to our shares throughout the selloff and advised our readers to do the same – and subsequently watched our stocks rebound mightily. And we fully expect these kinds of surges to repeat as gold pushes higher. Keep in mind that the real mania is yet to come. Once inflation responds to the Federal Reserve’s ongoing monetary foolishness, gold will need a space suit and our miners oxygen masks.

A key point to remember going forward is that gold mining shares constitute a minute fraction of the global equities market, and a small shift in investor interest toward our sector can move gold stocks sharply higher in a big hurry. The market cap of the fifteen largest gold producers in the world — combined — is a paltry $125 billion. That’s barely more than a single company such as General Electric, at $116B; much less than Microsoft ($175B); and waaay less than Exxon Mobil at $400B.

Miners have also had a temporary respite from high energy costs due to the collapse in the price of crude oil. Energy is one of the biggest expenses a miner has to carry. As energy prices came down, the cost of producing gold also declined, fattening the bottom line. Oil is likely to get back to and then beyond $143 per barrel at some point, but not for a while. We doubt it will top $75 this year, which is enormously helpful for our companies.

Recently, gold stocks have outperformed bullion, a trend we’re keeping an eye on and one we’re confident will continue in the future, especially when we see the certain emergence of serious inflation and the dollar resumes its downtrend.

So… what to do now?

What we hope you’ve been doing all along. Our general rules: If you’re already fully committed to this sector, stay the course; you will be well rewarded.

For those with money still to invest, accumulate well-run, sound companies on weakness. Volatility will continue; we expect days and weeks marked by retracement in the prices of even the best companies. The dips will be your buying opportunities. Place below-market bids and let the price come to you. Take positions with half or so of the funds you’ve allotted for this sector, then fill out your portfolio with whatever bargains come your way.

Whether you’re already full-up with gold stocks or are just getting started, you should be well positioned before the all-out mania for gold stocks hits.

The Quandary of Timing

It may surprise some to hear that we are not “all-in” yet with our portfolio. Why? Because our attitude is one of caution, and because we know that our big gains since October could get clawed back, partly or wholly, by another reversal – which would lead to another buying opportunity we wouldn’t want to miss.

But caution can be expensive when the market runs away from you. What if the train has already left the station? In that case, those waiting on a pullback will be disappointed. Just as all below-market bids placed on October 28 of last year went unfilled, so could today’s, or tomorrow’s.

Looking as little as a year out, our money is confidently on our stocks going higher – much higher. We expect the government’s assorted “stimulus” packages to fail to deliver as advertised, and usher in high inflation. This will push gold and gold stocks much higher.

But the question is, if the broader markets head lower, will gold stocks follow them down or ride on gold’s coattails?

That question leaves you in a quandary only if you’re looking at the short term. Or if you get emotional about this stuff. Those with no stomach left after the gut-wrenching selloff into last October probably shouldn’t deviate from the cautious strategy outlined above. If you’re one of those who see the big picture and ignore the gyrations along the way – which is what Doug Casey does – then you’re drawn to the idea of placing a bet when you judge that the odds are in your favor. It’s when you see the price of something is far less than its value that you can have the confidence to load up, whether that’s today or perhaps later this summer.

Whether you buy today or wait in hopes of a pullback, we believe you’ll be looking at profits a year from now. In the big picture, our stocks are still deeply undervalued, even after so many of them have doubled off their lows. But could they retreat again? In a general market pullback, definitely. Could they tread water for a while? Certainly. And could they leave present levels in the dust and double again from here? Absolutely.

There are times when one must put away the crystal ball and simply prepare for more than one scenario. This is one of them. Whether you respond more conservatively or more aggressively, keep your eye on the endgame. We think you’ll be glad you did.

Prudent precious metals strategies for conservative investors – that’s what BIG GOLD is all about. And now that the gold price is going up again, you shouldn’t wait to jump on the bandwagon. Read in our latest report why super-low interest rates mean we could see $1,500/oz gold this year – click here to learn more.