Chris Vermeulen, www.TheGoldAndOilGuy.com
Posts
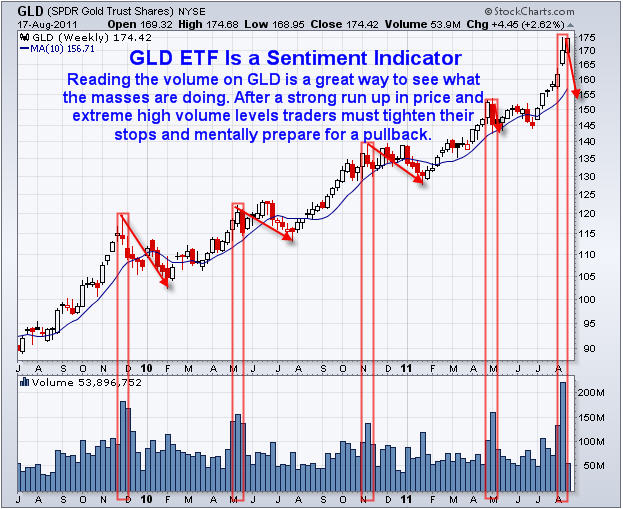
The past few weeks traders and investors have been completely spooked from the surge of negative news and collapsing stock prices. This fear can be seen by looking at the volume on the GLD gold ETF fund. With gold being in the spot light for several years now and the fact that anyone can own gold simply through buying some GLD shares. It only makes sense that reading the volume on this chart gives us a good feel for what the masses are feeling emotionally.
If we step back to trading basics we know that fear is the strongest force in the financial market for moving prices. And that there are a few ways to read fear in the market and the more which line up at the same time means there is a higher probability of trend reversal in the near future.
The first thing I look for is a rising volatility index (VIX). This index rises when investors become fearful of stock prices falling be hedging positions or flat out buying put options to profit from a falling market.
Second, I look for a high selling volume ratio meaning at least 3:1 shares traded are from individuals hitting the sell button in a panic thinking that the market is about to collapse.
And last but not least… I look at the GLD gold etf volume and price action. A surge in GLD volume after a strong move up means everyone is scared and dumping their money into a safe haven.
Let’s take a look at some charts to get a better feel.
GLD Weekly Gold Chart:
As you can see there are sizable price movements which ended with strong volume surges. Those volume surges mean that the majority of investors have reached the same emotional level and bought gold for safety (GLD ETF). Keep in mind that the big money players and market makers can see this taking place and that is when they start selling into that surge of buying volume locking in maximum gains before there are no more buyers left to hold the price up. Tops generally take a few weeks to form so don’t expect a one day collapse.
The recent rally in gold has taken place when stocks have fallen sharply. Money has been pulled out of stocks and pushing into gold but I think that is about to change…
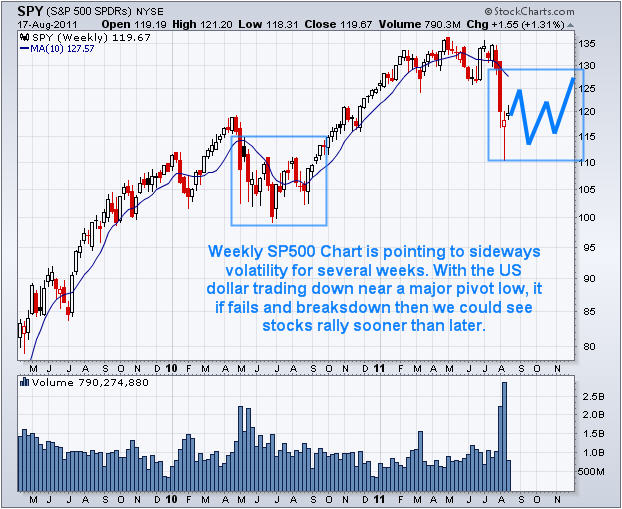
SPY Weekly SPX Chart:
The past month has been a blood bath for stocks. But from looking at the charts, volume and the fear in the market I can’t help but think we are going to see higher stock prices as investors see stocks moving higher, they will pull money out of gold and dump it back into stocks and likely high dividend paying stocks…
Mid-Week Trading Conclusion:
In short, everyone piled into gold sending it rocketing higher and I feel it has moved to far – to fast and is ready for a pullback (pause lasting 2-12 weeks). In association with gold’s pullback I feel investors are now realizing they sold their stocks at the bottom of this correction because fear took hold of their investing decisions. Now they are starting to think about getting long stocks but it still may be a bumpy ride for a few weeks yet…
Consider subscribing so that you will be consistently informed, have 24/7 Email access to me with questions, and also get Gold, Silver, SP500 and Oil Trend Analysis on a regular basis. Subscribe now http://www.thegoldandoilguy.com/trade-money-emotions.php
Chris Vermeulen
The market continues to become quicker and fiercer as it move up and down 2+% on a regular basis This week we have seen some wild price swings due to earnings, events and the Fed’s which just makes trading that much more intense.
I have pointed out yesterday that this market only gives you a brief moment to take profits before it starts going wild shaking traders out of positions. This increased volatility is caused from a couple of things:
1. Traders/Investors know the financial system is still riddled with unethical practices/manipulation. This causes everyone to be extra jumpy/emotional and causes volume surges in the market as the herd starts to get greedy or fearful.
2. Volume overall on the buying side of things just isn’t there… I see some nice waves of buying but it doesn’t move the market up much… then it only takes a small wave of sellers for the market to drop… Investors are just scared to buy stocks and that is not a good thing…
I keep a close eye on the buying and selling volume for the NYSE as it tends to help pin tops and bottom within a 2-3 day period. In short when we get panic buying meaning 75%+ of volume is from buyers then I know the general public is jumping into the market buying everything up and that’s when the smart money starts to scale out of their position selling to these retail investors. These retail investors are buying on news and excitement much like what we are seeing now with earnings season. Stocks have run up for 5-10 days, as the smart money buys in on anticipation of good news, then the earnings are released which are better than expected and the stocks pop and drop. Well the pop higher on BIG volume are all the retail investors buying and are generally the last ones in. The smart money is quickly selling into this buying surge so they end up getting out at high prices.
My point here is that in general I see 4-6 of these panic buying or selling days a year which I find are tradable. The crazy part is that we have seen 11 of these panic days (both buying and selling) in just 8 weeks… We are seeing more selling than we did at the bottom in 2009! Something big is about to happen and I want to make sure we get a price of it once the moves starts.
Anyways, below is a chart of the SP500 showing how its trading under some key resistance levels. Today the market gapped up testing the 50 day moving average and above the 5 day moving average then sold down very strongly during Ben Bernanke’s speech. This is not a good sign for the overall health of the market.
On the commodities side of things we are not seeing much happening with gold or oil at the moment. Gold is still in a short term down. And gold took an $8 drop today when Ben Bernanke said inflation would remain low for an extended period of time.
As for crude oil, yesterday afternoon I pointed out to members that oil had a big run up on virtually no volume Tuesday and it would most likely give back those gains today. We saw this today with oil dropping from $78 down to 76.50 per barrel. Overall Oil looks like it wants to go higher but has some work to do before that can happen.
Mid-Week Trading Conclusion:
In short, the market remains choppy and we are getting more than normal news/events which are moving the market and this is causing extra noise and volatility for traders. Cash is king during volatile times and if you are doing some trades be sure to keep the positions small for another month or so.
If you would like to receive my detailed trading analysis and alerts be sure to checkout my websites at www.TheGoldAndOilGuy.com or www.FuturesTradingSignals.com
Chris Vermeulen
Get My Free Weekly Trading Reports!
I hope everyone had a great weekend and Easter Holiday!
This is quick update as its Easter Sunday and it’s a time to relax with the family 🙂
Below are two charts and my thoughts on what I am looking for in the coming days and weeks.
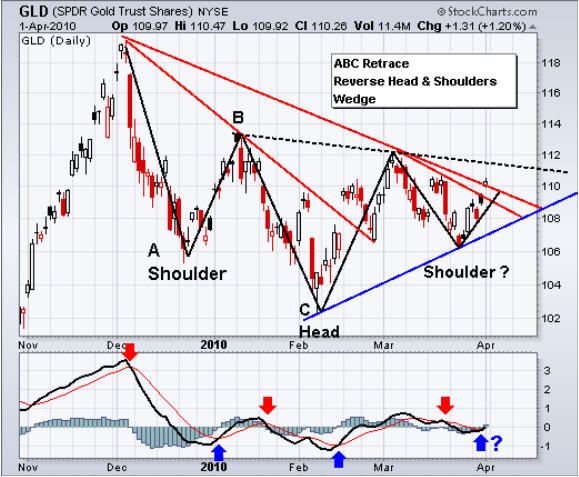
Gold Exchange Traded Fund – Daily Chart
As you can see the price action of gold has been trading within a few patterns the past couple months. First we saw a nice ABC Retrace correction and now it looks like a possible reverse Head & Shoulders or Wedge pattern is forming.
All three of these patterns are bullish but resistance must be overcome before I will start putting my money to work.
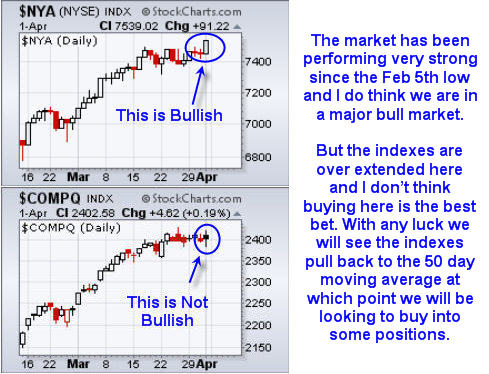
NYSE & NASDAQ Indexes – Daily Charts
We saw the broad market trade sideways for the majority of the week. As usual we had a pre-holiday pop in prices with the week closing slightly positive for stocks. These gains are generally given back the following week as volume picks back up.
The one thing that has me scratching my head is that the major indexes like SP500, Dow, NASDAQ and Russell 2000, all stayed below their previous weeks high. But the NYSE as shown below as the top chart clearly broke out to a new high.
I look at the NYSE as leading indicator and this makes me think we could see stocks grind higher right into earning season. All we can do at this point is wait for more data points on the chart and continue analyzing the market one day at a time.
Weekend Trading Conclusion:
As I mentioned last week, the market is over extended as we enter earning season. The market is in the same situation as we saw going into the January earning season.
I do not think we will have a huge pullback but I think a 3-5% correction is likely in the coming days or week. Once we get a pullback we should see support around the 30 or 50 day moving averages and then see the market head toward new highs once again.
The precious metals sector is getting a lot of attention because of the whistle blower on JP Morgan stating that metals are seriously manipulated with a huge amount of short positions still in place. I think this could be helping this sector and I hope we get a low risk setup in the coming week or two.
If you would like to Receive My ETF Trading Signals please visit my website at http://www.thegoldandoilguy.com/specialoffer/signup.html
Chris Vermeulen
Over the past month the gold and silver markets have taken a good drubbing. Silver has dropped from 19.50 to 15.00 and gold from 1227 to 1044 as the US Dollar has finally rallied after a long drawn out correction.
Since the advent of ETF’s market players have been able to invest in gold and silver for the first time without using Futures and investors have made the gold and silver ETF’s a very popular way of investing in the precious metals. The advantages of ETF’s are many versus buying a futures contract. Investors can hold them for the long haul, there is no contract switching every few months, investors can buy as much or as little as they want and there is no need to worry about a leveraged position. But are there any disadvantages to ETF’s versus a futures contract?
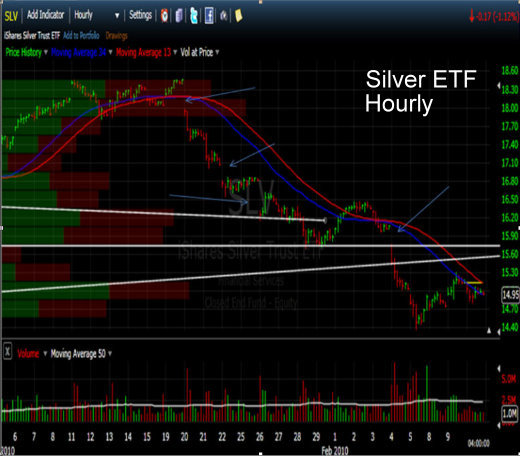
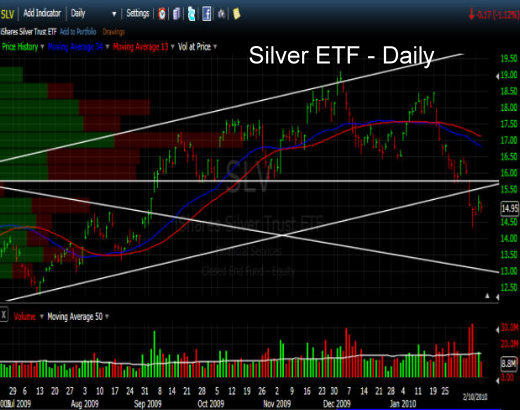
The chart below is the silver ETF with the symbol (SLV). Because the precious metals are a global commodity and one that has been in the spotlight lately, like most commodities they trade on a world wide scale 22-24 hours per day. Since ETF’s only trade during stock market hours there can be drastic changes to price when local markets open up the following day.
The arrows I’ve drawn show how the price of silver has been vulnerable to severe price drops on the open of trade in these stocks. The recent severe correction in silver is an excellent example of how prices can open much lower than the previous day’s close. Technicians call them price gaps when they appear on a chart pattern. Investors who are using the ETF’s to be long the metals call them EQUITY gaps because of the drop in price that occur affect their bottom line.
When investors awake to learn that gold or silver is down heavy overseas, the natural tendency for short term traders is to bail out on the open for fear of losing more money than they already have. Since these ETF’s have been closed for trading about 16 hours previously, big price changes can and do happen.
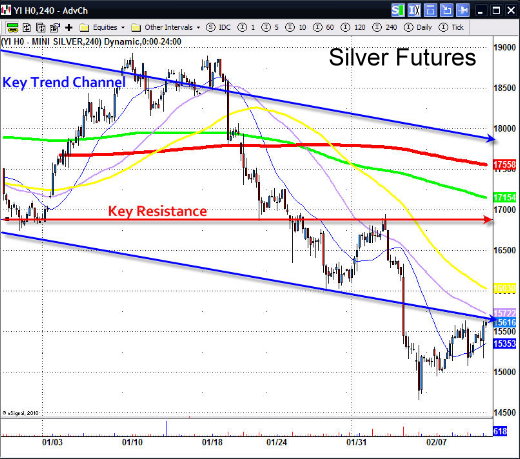
Now let’s look at a futures chart of silver. The chart below is a 1000 ounce silver futures contract.
Notice how there is only one price gap on the entire chart since the top price in January. That is because this contract trades 22 hours per day and price gaps only reflect the changes that occur from about 5 PM to 7:20 PM EST time. The remainder of the time the market is open somewhere in the world and the globex market is linked to all of them. Therefore an investor can avoid nasty drops in price over night by choosing to trade a futures contract.
Futures contracts are not for everyone as the mini contract has 1000 ounces as a minimum and most be rolled over every three months or so to a new contract. Most of the time there is a few cents difference in price as well and this is called a premium. For someone who is buying 1000 shares of the silver ETF and is an in and out short term trader might want to consider trading futures. The commissions can be much cheaper if you have the right broker charging under $3.00 commissions to trade a 1000 ounce contract which only requires a minimum margin of $1600 to trade $16,000 dollars worth of silver and the cost to fund an account is as low as $5000 dollars to open.
Probably the best advantage is that trading on these contracts begins on Sunday evening (in USA), a full 14 hours before the ETF’s open up for New York trading. On weeks such as we’ve seen this can be a marked advantage, especially when a severe correction begins to develop as the markets reopen from a weekend or Holiday.
Another advantage is the ease of which one can short these contracts. Unlike ETF’s one can short a contract just as fast and as easy as going long. It only requires a click of the button.
What about disadvantages?
Trading in futures is a leveraged game and while the gains can be magnified, so can the losses. However, if you’re already trading 1000 shares of SLV there is no difference. If you’ve never traded futures before it can be at times more emotional. Probably the biggest advantage is the ability to trade with ease and this can cause the user to overtrade and therefore accumulate more losses if you don’t have a game plan.
What about liquidity?
I’ve traded these contracts and have never ever had a problem getting in and getting out. However once in a while these contracts can fluctuate a bit more in after hours when trading is thin. I’ve seen 10-20 cent price rises after the market closes only to pullback to its original price before the markets close for those few hours a day in which there is no trading.
If you’ve been frustrated with your silver ETF when it opens down 50 cents in the morning you might want to look into trading a futures contract instead. But be sure to read up on futures and possibly try a demo trading package so as to get used to the ebb and flow and psychology of trading futures versus ETF’s. They are not for everyone, but for those who are disciplined and experienced traders; futures can offer advantages that the ETF counterparts don’t.
While we are on the subject, let’s take a look at the silver chart from a technical standpoint.
The chart below shows that silver has suffered some technical damage on the charts that should have technicians concerned.
Over the past 14 months silver has been in an uptrend defined by a parallel channel that has recently been broken on the downside and it has done so on heavy volume. As you can see by the chart, silver’s Friday lows were comparable to prices from April 2009, almost a full year ago. The correction from December has wiped out almost a year’s worth of gain in two short months. The break of the lower channel line confirms this downside momentum and has considerably weakened the technical picture.
We can see how the 16 dollar area was a key support level and when it got taken out a lot of stop loss orders were probably lying underneath that target area. Investors who had bought last spring saw all of their gains taken away in a few short months and the panic selling that ensued can be witnessed by looking at the volume spike.
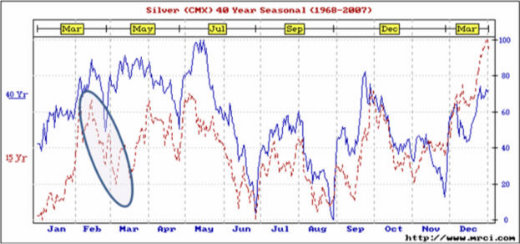
Investors should not be totally surprised. The January/February period for the precious metals tend to form tops in price from which late winter corrections are born and from which spring or summer bottoms are formed. This pattern has been more often than not the modus operandi during the bull market run of the past 9 years.
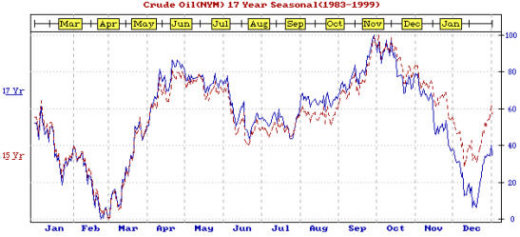
We can see by the seasonal chart below that this time period is usually met with a sell-off that lasts unto month end. Readers of my past articles have been shown the following chart before in other updates.
As we have stated in the past, the month of February is not usually a good time to be in precious metals and this month’s action confirms that very well.
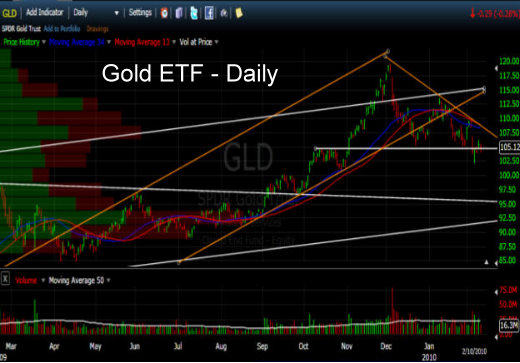
The chart above shows that gold recently took out a very important support area. For a few months the 1075 area in gold and the 105 area in the gold ETF (GLD) has been a key point technicians have been focused on. Last week’s rout finally took that area out. We can see that last week’s lows were below that line and that gold is trying to now climb back above it and maintain price in order to regain its support area. The important thing about a channel or support line is not whether it is penetrated by price but what price does immediately afterward. For the moment gold is trying to make its mind up as to whether it will forge forward here or breakdown to the next support area on the chart.
The next major channel line on our chart is all the way down at the 95 area on the chart. However, if we look at the September high and the October low during this rally we can make a case for support at the 100 area. For gold this would equate to the 975-980 area in spot gold. So at this current moment we remain neutral in the precious metals waiting for gold to make its decision on the next leg it is to embark on. Let’s look at the short term pattern by zooming in on the 60 minute chart of the April Gold Futures contract.
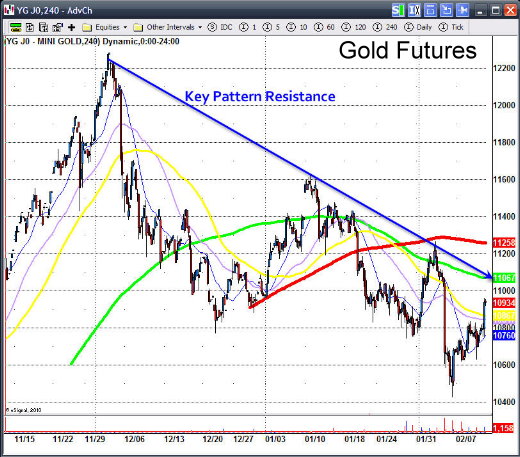
Ever since the December peak at 1227 the gold market has been in a correction that has shaved off about 180 dollars from peak to bottom. We can see that each attempted rally above the moving averages has ended up in failure. Last week, spot gold touched the 1143 area, just 10 dollars shy of the original breakout point of 1033. This return move to the point of breakout is not a rare occurrence in the commodity world and there are myriad examples of such a move before the “big” one came after the breakout. The 1044 area is also the place where India made their large purchase of gold last fall and from which the news launched the market much higher when it was announced they had purchased 200 tons of the precious metal.
Thus there are two key areas for gold to watch for. First a move back above the support shelf of 1075-1090 in gold would at least put gold back in a neutral pattern instead of a downtrend. Then if gold can above the 1100-1110 area it would provide impetus for a potential test of the highs at 1125 and 1163.
In summary, the February time frame is usually a weak time for gold and usually leads to a spring rally. The early peak in December opens up the potential for gold to attempt a March or April rally. In the meantime, one would be wise to watch the current areas of support.
1075-1090 – previous support area we need to get back above.
1010-1033 – The 200 day moving average and the original breakout point.
975-980 – The first support area of the last up leg in price that began in September.
Finally let’s look at the crude oil market.
In my past few updates I have advocated that a great play is to sell some precious metal holdings in early winter and raise some cash into the spring. Not only is this good due to the seasonal tendencies of gold to correct but it allows one to begin to deploy some of that cash into the crude oil market in late February. As you can see the oil market is usually much more seasonal in trend and that time of the year is approaching.
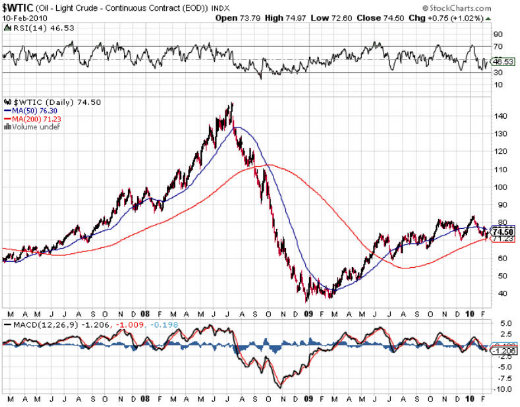
As you can see below, the crude oil chart shows price from March2007, 2008 and 2009. All three times oil turned out to be a great buy. The current pullback from the 83 area got as low as 71 before reversing this week and price is right at the 200 and 50 day averages. Thus the 200 day average is one place we should be on watch for as support. We are close enough now that we should be on guard for a seasonal low. Should there be a selloff as in the precious metals; the 58-60 area would offer a good chance at a seasonal bottom. If the rally has already begun the 200 day average or more importantly about 5 dollars below it would be a good support area.
We are constantly watching for low risk set-ups to get our subscribers into plays like this. Feel free to check this website for my past reports. They have advocated the same strategy as I have in this article. Why not drop by our website and see what we might have for low risk entry opportunities as we await the potential seasonal trend changes and position ourselves to take advantage of them.
Deciphering the SP500 Trend
The SP 500 and the markets topped one day after my Jan 18th forecast to our subscribers that the market had met all conditions for an interim top. This followed my Feb 25th, 2009 forecast for a huge bull market rally which we rode with aggressive stock trading. I am now forecasting an ABC correction likely lasting 3-5 months into June. We have adjusted our trading plans from individual stocks to Leveraged ETF’s to take advantage of the increase in volatility. Our ETF trading is designed to work in high volatility bull or bear cycles and has a 90% historical accuracy rate with profits typically within 24-48 hours of entry. The market moves in very clear herding behavioral patterns, and we identify those early and trade accordingly at David Banister. Here are his latest views, and you can read more at www.activetradingpartners.com/articles
If you would like to receive our Free Weekly Trading Charts and Analysis please visit our website at:
Chris Vermeulen – www.TheTechnicalTraders.com

