Posts

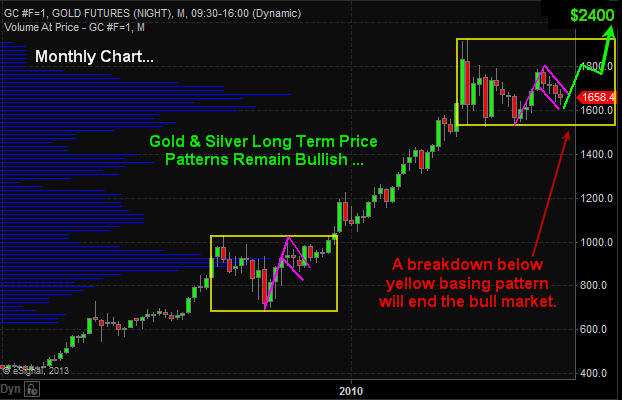
The precious metals sector has been dormant since both gold and silver topped in 2011. But the long term bull market remains intact. As long as we do not have the price of gold close below the lower yellow box on the monthly chart then technical speaking precious metals should continue much higher.

Large consolidation periods (yellow boxes) provide investors with great insight for investments looking forward 6-18 months upon a breakout in either direction (up or down). The issue with investing during these times is the passage of time. One can hold a position for months and sometimes years having their investments fluctuate adding extra stress to their life when they really do not need to.

Once a breakout takes place a powerful rally or decline will start putting an investors’ money to work within days of committing to that particular investment compared to money invested waiting months for the breakout and new capital gains to occur.

Gold Price Chart – Monthly

Gold Monthly Price Chart


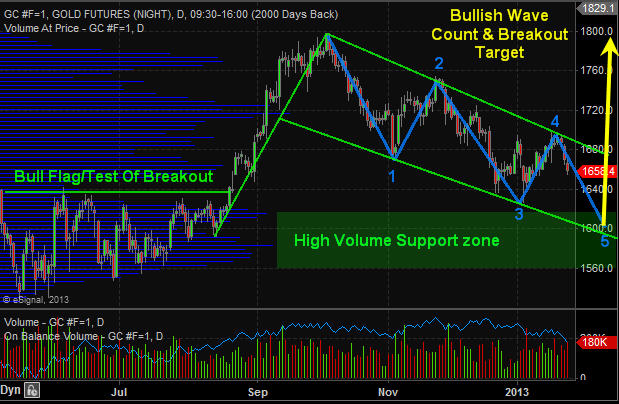
Gold Price Chart – Daily

The chart of gold continues to form a large bull flag pattern with a potential 3 or 5 wave correction. If price reverses this week and breaks above the upper resistance trend line then it will be a 3 (ABC) wave correction which is very bullish. But there is potential for a full 5 wave correction which is still bullish, but it just means we have another month or two before metals bottom.

Gold Futures Trading Daily Chart


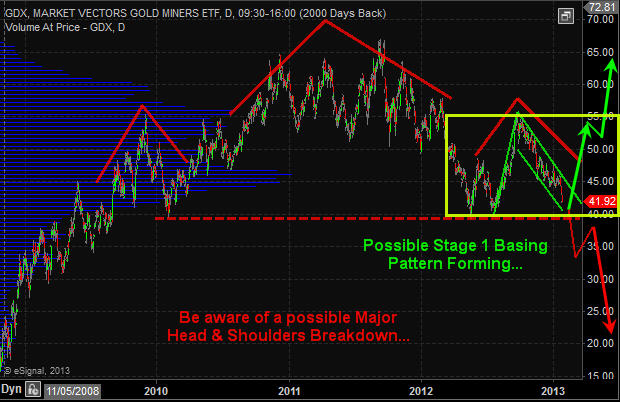
Gold Miner Stocks – GDX ETF Chart – Daily

Gold miners do not have the sexiest looking chart. It was formed a strong looking bull flag but has continues to correct and is not nearing a key support level. This level could act as a triple bottom (bullish) or if price breaks below then it would be breaking then neckline of a massive head and shoulders pattern which points to 50% decline. I remain bullish with the longer term gold trend until proven wrong.

GDX - Gold Miner ETF Trading


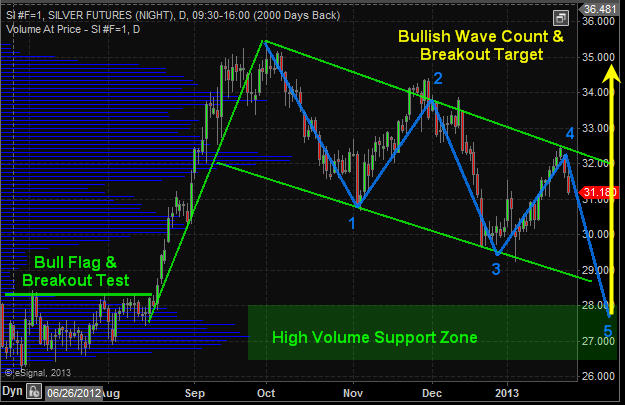
Silver Price Chart – Daily

Silver remains in a long term bull market much like the monthly chart of gold shown earlier in this report. Silver continues to work its way through a large bull flag pattern with a positive outlook at this time.

Silver Price Chart Daily


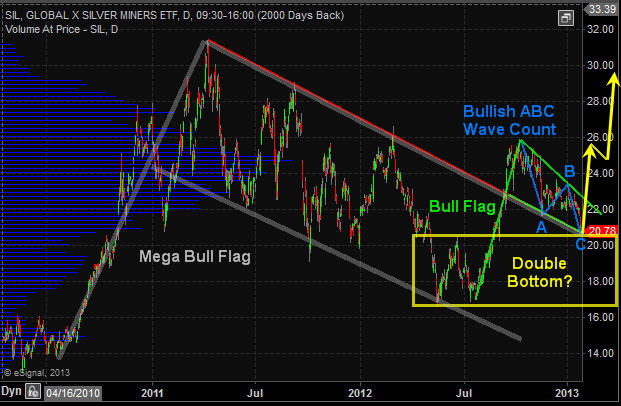
Silver Miner Stocks – SIL ETF – Daily Chart

Reviewing the precious metals sector it seems that silver miners have the sexiest looking chart. All price patterns are showing strength and are in proportion to one other. If this chart plays out to what technical analysis is pointing to then we could see the precious metals sector put in a bottom and rally within the next week or two. And if this is the case then silver miner stocks should provide the most opportunity going forward. Keep in mind you can view my actual watchlist of stock and ETFs I trade in real-time with my analysis free: https://stockcharts.com/public/1992897

SIL - Silver Miner ETF Trading


Precious Metals Trading Conclusion:

In short, what you need to focus on is the yellow consolidation box on the monthly gold chart. A breaking in either direction will trigger a massive move that should last 6-18 months. Until then long term investors can simply sit back and watch the sector while they put their money to work in other active sectors.

From a short term traders point of view, that f mine. I am looking for a signs of a bottom on the daily chart to get my money working earlier to play the bounce/rally that takes place and actively managing the position until a breakout occurs. The charts overall are not that clear as to when a breakout will take place. Metals could start to rally next week or in a few months and all we can do is wait for a reversal to the upside before we get active.

Knowing the big picture trends and patterns at play along with major support and resistance levels (breakout levels) is crucial for success and piece of mind.

Get my analysis, daily updates and trade alerts each day at www.TheGoldAndOilGuy.com

Chris Vermeulen

Crude oil prices hit a four-month high this week on the back of rising tensions in the Middle East and North Africa and the unfortunate murder of the U.S. ambassador to Libya. Added impetus on the upside was given to oil by the announcement of more money printing (QE3) by the Federal Reserve which said it would launch an open-ended  commitment to purchase $40 billion of mortgage-backed securities monthly.

The global benchmark for oil, Brent crude oil, jumped to about $117 a barrel. It maintained its roughly $18 premium to U.S.-based WTI crude oil which was trading at $100 a barrel on a couple days ago. Non-futures investors can easily participate in the oil market through the use of exchange traded funds. The ETF which tracks Brent crude oil futures is the United States Brent Oil Fund (NYSE: BNO) and the ETF which tracks WTI crude oil futures is the United States Oil Fund (NYSE: USO).

The real story behind the story in the oil market, however, is the ongoing Arab Spring which is sweeping throughout the Middle East and North Africa, pushing aside some regimes and threatening others. The countries whose governments, such as Saudi Arabia and the other Gulf states, feel threatened by popular uprisings are where investors should put their focus.

Saudi Arabia in particular is key because it accounts for more three-quarters of the world’s spare oil production capacity. So it is very important to note that the kingdom is no longer a price ‘dove’ in OPEC as it has been for decades. It has joined Iran, Venezuela and others in being a price ‘hawk’.

The reason behind the change in attitude is simple…Arab Spring.

Like its neighbors in the Gulf region, Saudi Arabia has gone on a public spending spree to appease its restless citizens. It has sharply increased outlays on subsidies for items like food, fuel and housing in an attempt to appease its citizens. In 2011, the kingdom raised its domestic spending by $129 billion – the equivalent of more than half its oil revenues.

Much of this increased spending will go toward upgrading the country’s infrastructure. Take electricity, for example. Saudi Arabia has revealed plans to spend more than $100 billion dollars on power plants and distribution networks by 2020. The kingdom has also set a goal to electrify 500,000 new homes that are being built in an attempt to mollify political unrest among its population of 27 million people.

This spending spree led the International Monetary Fund and other analysts to estimate that the kingdom and other Gulf countries need oil to be selling between $80 and $85 a barrel in order for the governments to balance their budgets. This is up, in Saudi Arabia’s case, from a mere $25 a barrel a few short years ago!

Unfortunately for oil consumers, this trend looks set to continue in years ahead. According to the Institute of International Finance, by 2015 the Saudi government will only be able to balance its budget if oil prices are at $115 a barrel if current spending trends remain in place.

So in effect, with the Arab Spring forcing governments to spend more on their citizens, it has put a floor under the price of oil. OPEC will do everything in its power to keep the price above the budget breakeven points for governments in the Gulf region.

Keep up to speed on the oil and precious metals markets with my free newsletter: www.GoldAndOilGuy.com

Chris Vermeulen
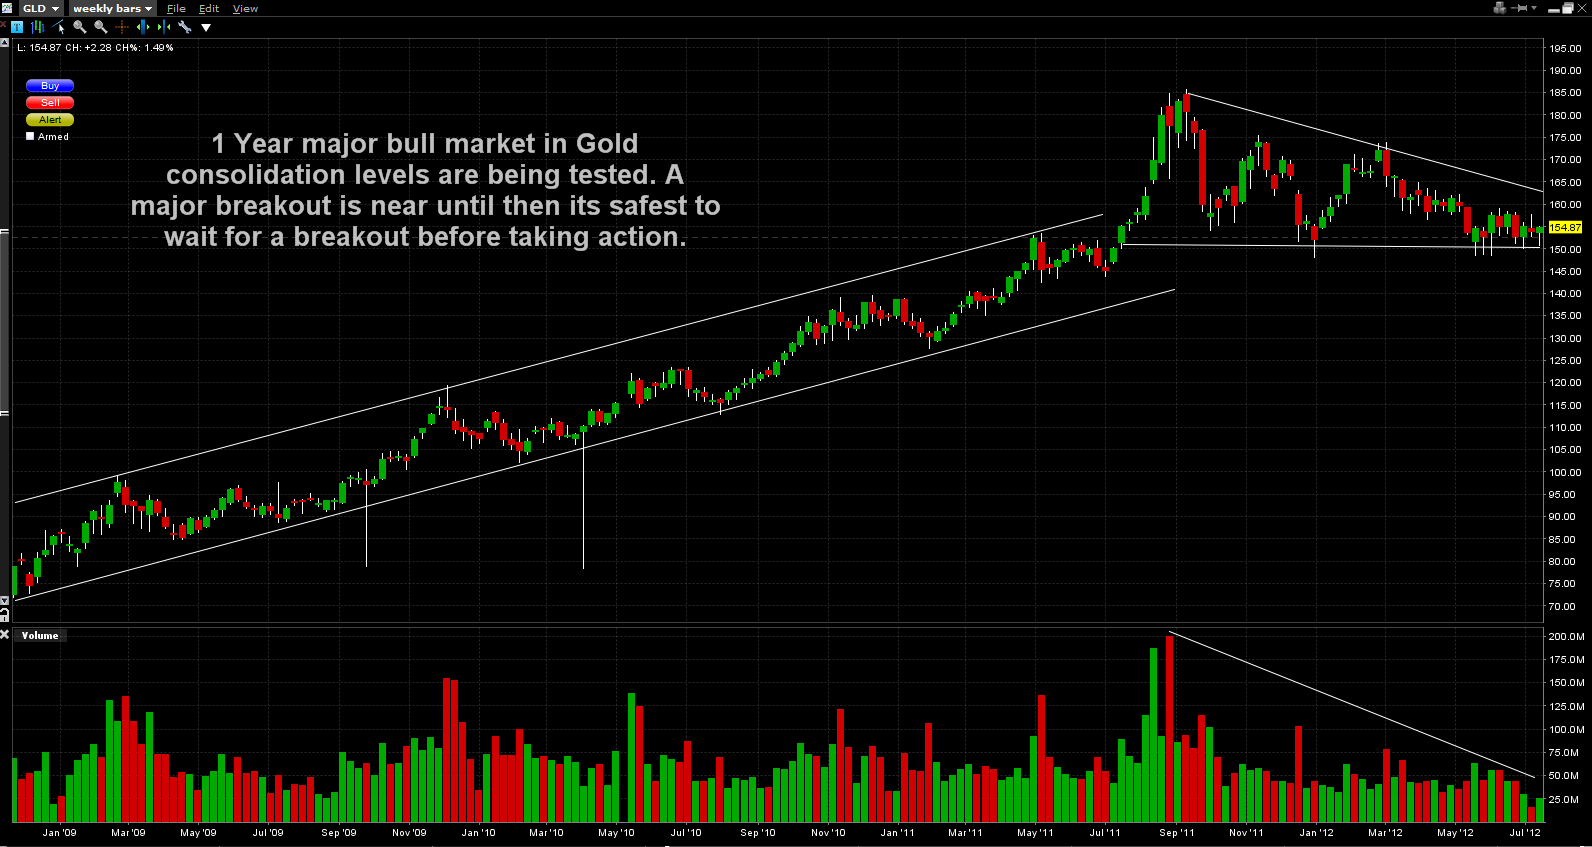
After making new highs about a year ago we have seen Silver and Gold consolidate for roughly the last twelve months.  Technically, it would typically be a bullish scenario with gold from the stand point that the last 12 months’ price action was a sideways consolidation in a bullish pennant formation.  However over the last year we have witnessed a series of lower highs and increasingly tested supports levels around $150 on GLD which raises caution.

  Click Gold Chart for Full Size

With the fed pulling any extensions on further quantitative easing in the form of QE3 or other programs, the bullish case has lately been criticised.  However I am still a firm believer that gold in most respects is a currency, and the only one that can maintain its value.  There are very serious issues looming in Europe and across the world that are far from resolution.  With few tools left in the toolbox to stimulate world economies, further easing can never be ruled out.

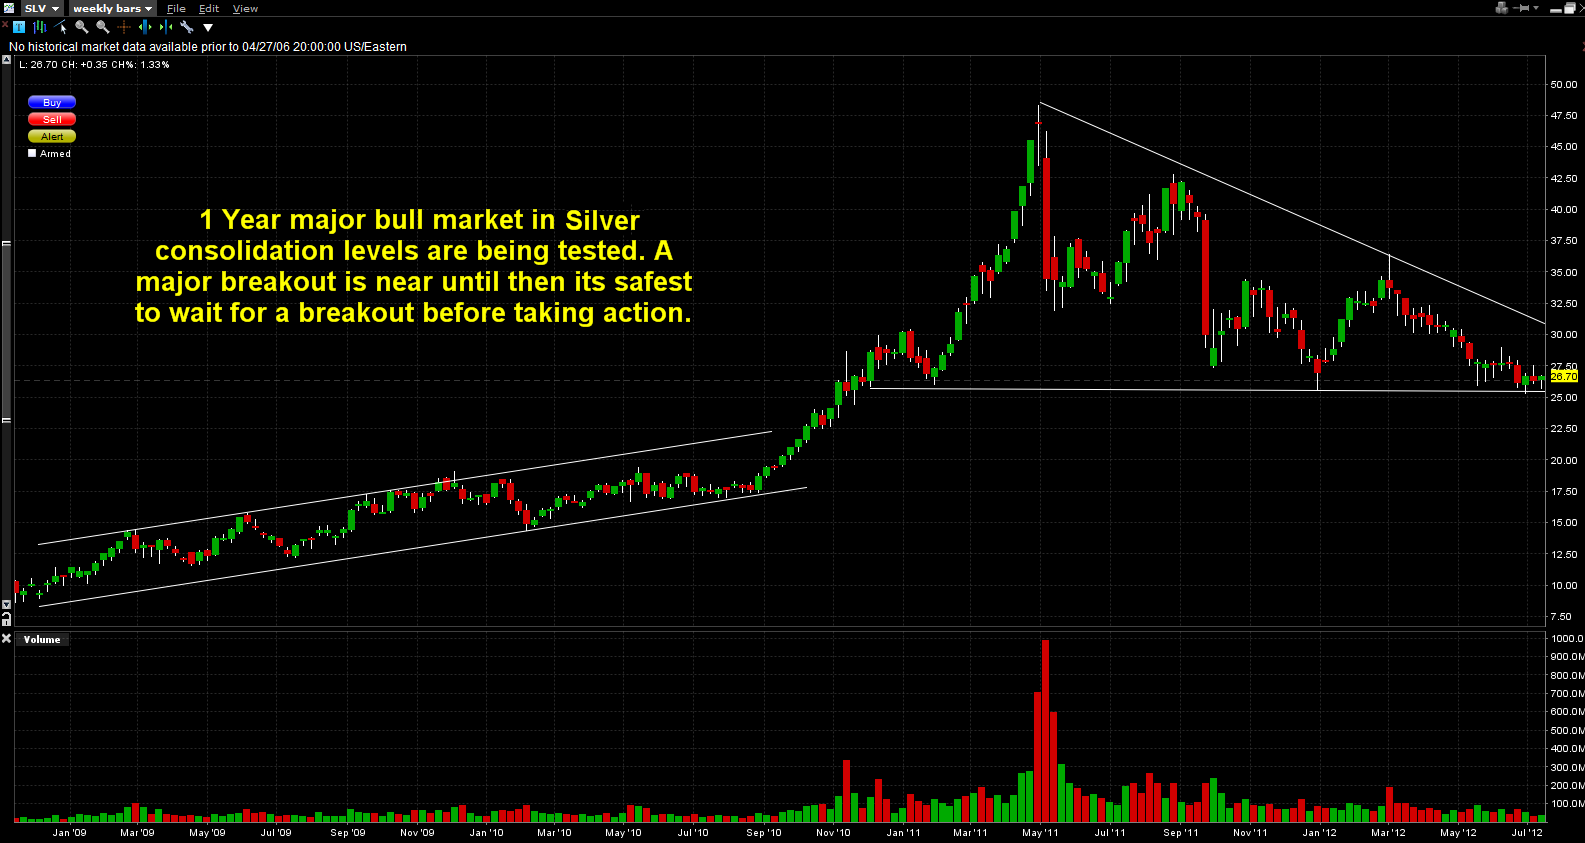
Silver, after breaking through strong resistance around $19- $20 in September 2011 went almost parabolic in spring 2011 prior to giving up most of its gains in the last year.  There seems to be significant support around $26 on SLV, however this level has been tested quite frequently over recent months and this again raises caution.  While silver owes some of its moves to its industrial application, the high correlation between the two metals is not to be ignored.

 Click Silver Chart for Full Size

I think the long-term trade will be long in both metals, but I’m waiting to see a significant breakout out of these consolidations on heavy volume to confirm a direction.  I would like to see both precious metals break out of their respective consolidations and ultimately have further confirmation in the USD.  Any major headlines over the next couple months involving Europe or quantitative easing may provide us with the trigger for the next big move.

Get My FREE gold cycles and trading analysis here: www.GoldAndOilGuy.com

Chris Vermeulen
Jan 22, 2010
It’s been a crazy week for stock and futures traders as the market moved up and down like a yo-yo, finally closing down sharply on the week.

Earlier this week I posted a report showing the Volatility Index (VIX) and how it was then trading at an extreme low level which triggered the sharp market corrections. Since that post the VIX has now risen over 30% as traders start selling positions to lock in gains.

Take a quick look at the Volatility Index chart:


Chart of S&P500 Daily Price Action

Since the low in the volatility index a few days ago we have seen the S&P500 drop over 3.4%. This sharp sell off in equities and ES futures has happened in a very short period of time making the overall market oversold when looking at short time frame of the daily chart. With the market oversold and also trading near a support level I expect we could get a weak bounce lasting 1-5 days before rolling over for another wave of selling.

There are several reasons I feel this will happen:
1. Experience from seeing setups/patterns like this across many different indexes and investment vehicles leads me to believe distribution of shares are now starting to flood the market.

2. The market sentiment surveys are still extremely bullish. What does this mean? Well if almost everyone is bullish, then who is left to buy?

3. As the good old saying goes “Buy the Rumor, Sell the News”. With earning season starting I cannot help but think everyone (smart money) will be selling into the good earnings news as dumb money buys into stocks as they meet or beat earnings. This inflow of dumb money is exactly what the big guys need to unload massive amounts of shares at a premium. Also I would like to point out that earning estimates have been very low that past year which I think has been on purpose for the institutions. This makes it very easy for companies to beat estimates each quarter giving the warm cozy feeling to retail investors (us, the small guys)

4. Also Chares Biderman on Bloomberg pointed out the other day that the market looks to be manipulated by the feds as virtually all the gains have been produced after hours in the futures market.

Chares Biderman Video
The United States in my opinion is much more corrupt than most people think and I don’t really want to get into this rather large and interesting debate at the moment. But Charles Biderman has some very interesting points which fall in line with my thinking about how much of what is happening is really natural and what is completely manipulated in the past 10 months of rising market prices.

Must Watch 5 Minute Video

Quick Technical Chart Update on Gold
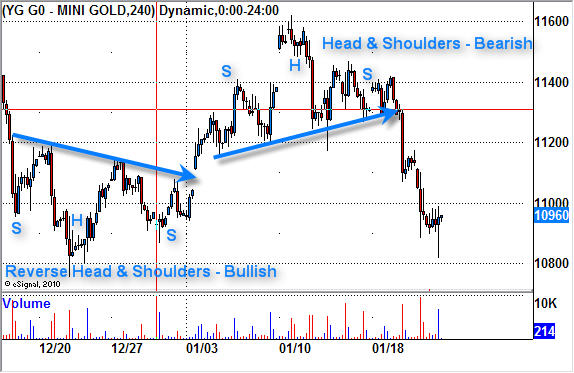
I thought this chart may be of interest to some of you as it shows two perfect textbook plays on the 4hr gold futures trading chart.

As you can see the first pattern is a reverse head & shoulders pattern. This is bullish and a breakout above the neckline would signal a buy point. Now if we use basic technical analysis with this pattern we can measure the potential move up by looking reverse head and shoulders pattern. You take the low of the upside down head $1075, and go straight up to the neckline at $1117. That is a total of $42. So if we add that $42 to the breakout point above the neckline then we can have a price target of $1117 + $42 = $1159.

As we can see the price of gold over the next couple days rallied to the $1160 level. Trading is not that easy but that is how it works in general. The hard part is knowing how to manage your trade and I scale out of positions as the price matures reaching short term resistance levels and by adjusting my stops accordingly to lock in maximum gains while minimizing downside risk.

A couple days later the same chart formed a regular Head & Shoulders and has since moved its potential measured move. I m not expecting a weak bounce in gold as with the overall stock market, but I am still not sure that the selling is over.
4 Hour Gold Trend

The “Weak’end Trading Conclusion:
In short, the market was turned upside down this week. Those who follow me should be in cash or mostly in cash as this drop was anticipated a few days ago.

Trading during fast moving markets is much tougher for swing traders as pivot points for indexes and commodities tend to happen during the intraday or during futures trading at night. High volatility like this is fantastic for active traders who focus on shorter time frames like the 4hr and 60minute charts, as opposed to trading just the daily chart and entering and exiting positions at the open and close each day.

I continue to watch the market and plan on providing some of these short term setups on the 4 hr chart using both the GLD etf gold fund and the YG Gold futures mini contract.

If you are interested in Trading Gold Futures and other contracts please join my Free Futures Trading Newsletter:

Chris Vermeulen