Posts

We don’t hear much about gold and silver anymore on the news. This time last year you could not go 5 minutes without a TV or radio station talking about them. Why is this? Simple really, precious metals have been building a Stage 1 Basing Pattern for the last 12 months. This boring sideways trading range is how the market gets most of those long holders out of an investment before it starts another move up. The saying is “If the market doesn’t shake you out, it will wait you out”.

We all know time is money so the above statement makes a lot of sense doesn’t it? Instead of having your money sitting in an investment that has clearly displayed a large sideways range with month and possibly years before any significant breakout will occur, why would you want their money in it doing nothing? There are other opportunities which you could be putting your money into that could generate more gains until the precious metals sector sets up with a high probability trading pattern.

The good news is that gold, silver and precious metal miner stocks are forming a very large Stage 1 Accumulation pattern on the weekly chart. This points to a multi month rally in prices if they breakout above our resistance levels.


Gold & Gold Miner Stocks Weekly Analysis:

The chart below shows a lot of analysis and to the untrained eye this may look messy and confusing, so take your time to review it. In short, what I am showing are sideways price patterns using the previous highs and lows for support and resistance levels. The analysis shows the shift in prices from bearish (down), to Neutral (sideways). The exciting part about this pattern is that a new bull market should emerge if my analysis is correct. Now, I’m not talking about 5 -10% move here, I’m talking about a multi month and possibly a yearlong rally in precious metals that could allow some individuals to retire early if played properly…

A break above our red dotted resistance lines should trigger aggressive buying in gold miners along with physical gold bullion.

Gold Miners ETFs

In the past month I have been giving out some of my Stage 1 trading ideas which have generated some decent gains for those who follow along. All but one have generated gains with FSLR 12.5%, FB 12%, RIMM 54%, AAPL 5%, TLT 2.5%, XLU 1.5%, and KOL down -5.2%. Keep in mind that you can follow my trading charts live for free and get some of my stock and ETF trading ideas here: https://stockcharts.com/public/1992897


Silver & Silver Miner Stocks Weekly Analysis:

This chart of silver and silver miner stocks (SIL), shows a very similar pattern to that of its big shiny sister (Yellow Gold). Silver carries a lot more risk because of its industrial usage. Also this commodity is thinly traded and can move very quickly on a daily basis compared to gold. Because of these quick price movements it has attracted a lot of speculative money which also has increased the volatility. More often than not silver will move 2-3 times more on a percentage bases than that of yellow gold.

Silver Miners ETFs


Battle of the Miner ETFs Weekly Performance:

This chart compares three precious metals miner ETFS (GDX – Gold Miners, SIL – Silver Miners, NUGT 3x Leveraged Gold Miners).

Silver miners have held up the best because the herd saw how big the move was a year ago and are front running the next potential rally. But, depending on how you read the charts and sentiment it may be pointing to the dormant gold miners for a bigger than expected rally. But debating which one will breakout and run the most is a conversation/debate of its own and even I can argue both sides. The safe play is that even if gold miners (GDX & GDXJ) underperform the silver miners (SIL), the NUGT which is 3x leveraged gold miners should be the same if not outperform silver miners.

Precious Metals Mining Stocks


Precious Metals & Miners Trading Conclusion:

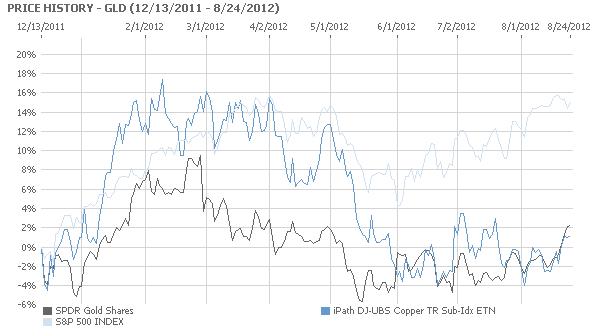
In short, I favor trading the miners over physical bullion simply because the charts show much more profit potential than if one was to buy the bullion exchange traded funds GLD and SLV.

The market seems to be setting up for some very large moves in 2013 and members of my trading newsletter should do very well. Be sure to join and follow along at www.GoldAndOilGuy.com

Chris Vermeulen

There should be an inverse relationship between gold (NYSEARCA: GLD) and copper (NYSEARCA: JJC).

Most of gold is used for investment purposes.  As a result, it rises when there is economic weakness and investors lose confidence in the fiat currency of a country.  Most of copper is used for industrial purposes.   Therefore, the price of The Red Metal should increase when economies are booming, as there is a greater demand for it from the factories operating at full throttle and for the buildings being constructed.

Gold Bullion Prices

Gold Bullion Prices

As the chart below evinces, the inverse relationship between the exchange traded for gold, SPDR Gold Shares, and the exchange traded fund for copper, iPath Copper, has broken down due to traders positioning themselves for the introduction of Quantitative Easing 3 when Federal Reserve Chairman Ben Bernanke speaks at Jackson Hole this Friday.

Continuing economic weakness in the United States will almost certainly lead the Federal Reserve to act in way that is more powerful than Operation Twist, the selling of short term securities to buy those with a longer term.   Based on the most recent data, economic growth in the United States is falling as the unemployment rate is rising.  A recent statement by the Federal Reserve was unusually clear in calling for greater action.

Both the JJC and the GLD have risen together as traders expect more economic stimulus from the United States Government.  This will weaken the US Dollar and raise the price of commodities, as happened with Quantitative Easing 2.  During the period of Quantitative Easing 2, from November 2010 to June 11, the US Dollar fell in value and the GLD and the JJC soared, along with other commodity prices, particularly oil.  This pattern is being repeated as traders are preparing for the initiation of Quantitative Easing 3 when Bernanke speaks Friday, or at the next Federal Open Market Committee meeting.

Gold Spot Price Chart

Gold Spot Price Chart


TheTechnicalTraders Analysis & Trade Idea Delivered To Your INBOX!

Chris Vermeulen – www.TheGoldAndOilGuy.com

It is an endless debate for investors interested in gold. Should they buy a direct play on the gold price, either gold bullion itself or even so-called paper gold with an ETF such as the SPDR Gold Shares (NYSEArca: GLD)? Or should they invest into gold equities, particularly the larger, higher quality gold mining companies?

Recent history suggests the answer is gold itself. According to Citigroup, physical gold has outperformed global gold equities 120% percent of the time over the past 5 years. Stocks of the bigger gold mining firms seem to react adversely to bad news (which is normal), but the problem is they react with no more than a yawn to good news. These type of stocks are contained in the Market Vectors Gold Miners ETF (NYSEArca: GDX).

Gold Mining Stocks ETF - GDX

Gold Mining Stocks ETF - GDX

Evidence of this trend can been see in the latest news to hit the industry…the slowdown in expansion as recently signaled by the world’s largest gold producer, Barrick Gold (NYSE: ABX). The company’s stock has fallen by more than 30 percent over the last year due to cost overruns at major projects. The latest blowup in costs of up to $3 billion occurred in its estimate for development of its flagship Pascua-Lama project on the border of Chile and Argentina. The project may now cost up to $8 billion.

In addition, Barrick decided to shelve the $6 billion Cerro Casale in Chile and the $6.7 billion Donlin Gold project in Alaska. Barrick is not alone in its thinking among the major gold producers. The CEO of Agnico-Eagle Mines (NYSE: AEM), Sean Boyd, recently said “The era of gold mega-projects may be fading. The industry is moving into an era of cash flow generation, yields and capital discipline.”

Fair enough. But are gold mining companies’ management walking the walk about yields or just talking the talk? Last year, many of the larger miners made major announcements that they would be focusing on boosting their dividends to shareholders in attempt to attract new stockholders away from exchange traded vehicles such as GLD, which have siphoned demand away from gold equities. Barrick, for example, did boost its dividend payout by a quarter from the previous level. Newmont Mining (NYSE: NEM), which has also cut back on expansion plans, has pledged to link its dividend payout to the price of gold bullion.

So in effect, the managements at the bigger gold mining companies (which are having difficulties growing) are trying to move away from attracting growth-only investors to enticing investors that may be interested in high dividend yields. This is a logical move.

But rising costs at mining projects may put a crimp into the plans of gold mining companies’ as they may not have the cash to raise dividends much. And they have done a poor job of raising dividends for their shareholders to date. In 2011 the dividend yields for gold producers globally was less than half the average for the mining sector as a whole at a mere 1.3 percent. Their yields are below that of the base metal mining sector and the energy sector.

It seems like management for these precious metal companies have the similar emotional response shareholders have when they are in a winning position. When the investor’s brain has experienced a winning streak and is happy it automatically goes into preservation/protection mode. What does this mean? It means management is going to tight up their spending to stay cash rich as they do not want to give back the gains during a time of increased uncertainty. Smaller bets/investments are what the investor’s brain is hard wired to do which is not always the right thing to do…

Looks like there is still a lot work to be done by gold mining companies’ to improve returns to their shareholders. But with all that set aside it is important to realize that when physical gold truly starts another major rally. These gold stocks will outperform the price of gold bullion drastically for first few months.

Gold Stock Rally

Gold Stock Rally


Gold Miner Trading Conclusion:

In short, last weeks special report on gold about how gold has been forming a major launch pad for higher prices over the past year. Gold bullion has held up well while gold miner stocks have given up over 30% of their gains. If/when gold starts another rally I do feel gold miner stocks will be the main play for quick big gains during the first month or two of a breakout. The increased price in gold could and value of the mining companies reserves could be enough to get management to start paying their investors a decent dividend which in turn would fuel gold miner shares higher.

Both gold and silver bullion prices remain in a down trend on the daily chart but are trying to form a base to rally from which may start any day now. Keep your eye on precious metals going into year end.

If you would like to get my weekly analysis on precious metals and the board market be sure to join my free newsletter at www.TheGoldAndOilGuy.com

Chris Vermeulen

This year has been a very exiting time for traders and investors. We have seen a steady climb in prices with controlled pullbacks in the broad market and gold.

Using technical analysis we are able to quickly and accurately make informed decisions just from looking at the charts. In the charts below you will see how simple chart patterns along with support & resistance levels can provide excellent low risk entry points. Also you will see how candle stick charts can be an early indicator for prices to reverse direction.

DIA ETF – Daily
The DIA (Dow Jones Index Fund) is trending higher. By applying some basic technical analysis you are able to time your entry points having the odds in your favor.

In this chart I use two simple forms of analysis. The broadening formation (red trend lines), and horizontal support zones shown in blue.

Broadening Formations: This is when the price becomes more volatile making higher highs and lower lows. I think of it as one of those Megaphones for talking to large groups of people. So when a chart has this pattern it’s virtually yelling at me and I start taking profits or tightening my stops.

Horizontal Support Zones:
I like to focus on support or resistance zones which are a little different than most traders. I do not use the top and bottoms of previous waves for these levels. Instead I take the average price then expect the support level to be penetrated somewhat as the level is tested. This is how the market keeps you out of the good trades. I cover this in great detail in my Stock Market Trading Education Course available in January.

Analysis:
The DIA ETF looks ready for a pullback to the $99- 100 level.

DIA ETF

DIA ETF

GLD Exchange Traded Fund – Weekly
Gold has been on fire and riding this wave up has been very profitable thus far. Last week a doji candle was formed on the chart and this can signal a change in short term price action.

This chart shows some of the past doji candles and what happened to the price of gold soon after. What this candle is telling us is that the buying and selling pressure is equal. So we know momentum is slowing and we should expect a consolidation or correction.

Because gold has rocketed higher, indeed going almost straight up in the recent weeks, I expect a pullback to be very quick. A drop to the $110 or even the $100 level in the coming weeks is not out of the question, but we all know commodities can go parabolic for several months (straight up). This is why we continue to tighten our stops and keep holding out long positions.

Gold Exchange Traded Fund

Gold Exchange Traded Fund

US Dollar – Weekly
The US dollar has been up and down like a yo-yo in the past 15 months. The chart below clearly shows what has been happening with this currency and what I think we could see very soon.

The blue support zone (73-74) is a key pivot point for the dollar. That being said lets take a look at the chart.

During the time when the price is trending higher July 2008 – Feb 2009 we see lower wicks appear more often. This tells me that sellers pushed the price down early in the week but were then overcome by buyers nearer the end of the week. This is bullish price action. Also the broadening patterns during this timeframe’s tops indicate increased volatility and we know that is a sign of weakness.

From March 2009 – Sept 2009 the trend was down and there are longer upper wicks telling us buyers became over powered by sellers each time the price rallied.

In the recent 3 months we observe lower wicks meaning buyers are moving into the US dollar again. Knowing that there is major support below the current price I have to think the dollar could start to bottom around this level.

US Dollar Trading

US Dollar Trading

Trading Conclusion:
The broad market is becoming unstable and looks like it could have more of a pullback this week. I would not be adding to any long positions until we see the market trading near support. Three out of four stocks move with the market so it is crucial to understand the overall market direction when buying and selling stocks and commodities.

Gold is trading at a level which is fuzzy. The weekly chart is neutral and the daily chart is still on fire as it moves up. All we can do is ride our positions and keep raising our stop prices.

The US dollar could start to bottom over the next few weeks. Depending what happens with Dubai this week we could be in for a big bounce in the dollar as investors flock to safety as the US dollar is still the currency of choice if/when other countries start to have a financial melt down again.

If you would like to receive my free weekly trading reports join my newsletter:

Chris Vermeulen
www.TheGoldAndOilGuy.com

Commodities so far this week have not changed much. But I can point out a few things for us to watch Thursday and Friday.

Precious Metals – Gold GLD fund – Silver SLV Fund – PM Stocks GDX Fund
We could start to see a shift between the price relationship between gold and the broad market. I pointed this out last week mentioning that gold and silver are starting to hold up in value while stocks sell off on big days. For example, Wednesday’s sell-off in equities did not have much effect on precious metals. This is what we want to see. It means money is moving out of stocks and into gold and silver bullion as a safe haven.

These three charts of GLD, SLV and GDX show Wednesday’s price action as gold and silver moved higher while precious metal stocks sold down with the rest of the market. This is generally a bearish indicator for gold and silver but because I am starting to see this happen more often and traders are ready for the market to top any day, I am seeing this as a bullish indicator. If the market starts to slide I have a feeling investors will be dumping a lot more money into gold and silver.

Gold, Silver, Precious Metals Stocks

Gold, Silver, Precious Metals Stocks

Energy – Oil USO Fund – Energy Stocks XLE Fund
We are seeing a similar pattern in the energy sector. Oil had a nice move higher today while energy stocks sold off. Stocks are starting to fall out of favor.

Energy Oil Stocks

Energy Oil Stocks

Natural Gas – UNG Fund
Natural gas is still in a bear market and trading under a major resistance trend line. This commodity could go either way so I am going to wait for the odds to be more on my side before jumping on board with a long or a short trade.

Natural Gas UNG Fund

Natural Gas UNG Fund

Mid-Week Gold, Silver, Oil and Nat Gas Conclusion:
The market is starting to look and feel top heavy with many indicators and price action patterns giving cross signals. While the market could continue to rocket higher with new money getting dumped in from average investors because of solid 3rd quarter earnings, we must be cautious by tightening our stops and take some profits off the table. Until we get a short term oversold market condition I am trading very conservatively.

Waiting for a good trade is crucial in trading. If you always want to trade and force positions when the market is choppy you end up with lower probability trades.

To receive my free trading reports, please visit my website: www.GoldAndOilGuy.com

Chris