Posts

While the exchange traded funds for gold (NYSEARCA: GLD TRADING –  GLD QUOTE) and copper (NYSEARCA: JJC) fell today due to investors expressing disappoint at the modest response of the Federal Reserve to declining economic growth, it was silver (NYSEARCA: SLV Trading, SLV Quote) that was off the most.

SPDR Gold Shares (GLD) fell in trading today by 0.89%.    IPath Dow Jones Copper (JJC) dropped 1.89%.  Plunging the deepest was iShares Silver Trust (SLV), off by 2.14%.

SLV Trading

SLV Bullion Trust

Traders were hoping for more aggressive action by Federal Reserve Chairman Ben Bernanke.  But that will not come until after the November elections in the United States.  Remember that Quantitative Easing 2 did not begin until November 2010, though it was announced at the Jackson Hole economic policy summit in August of 2010.

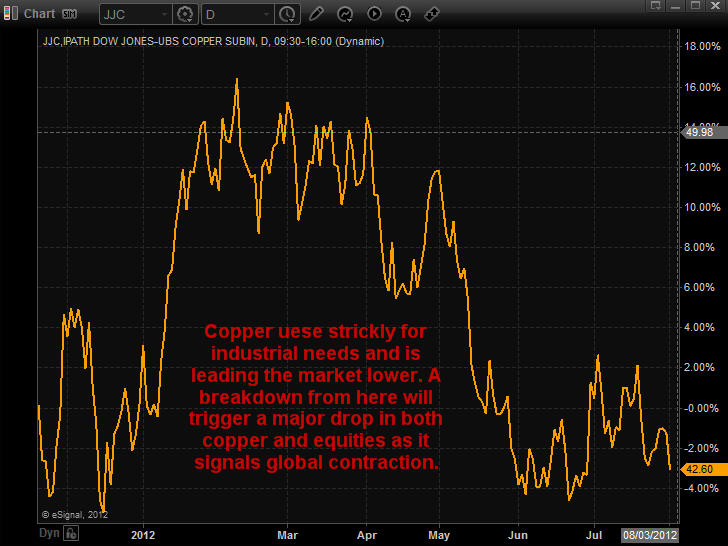
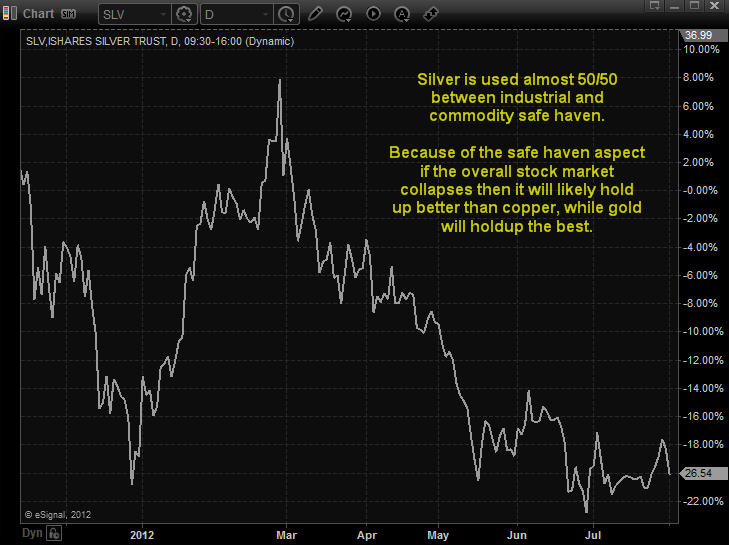
Silver is in what would seem to be the “sweet spot” between gold and copper.  Almost all of gold is used for investment or decorative purposes.  Almost all of The Red Metal goes for industrial needs.   For silver, it comes almost down right in the middle between commercial and a commodity for investments or jewelry.  The charts below show the trading relationship for each of the exchange traded funds when paired against each other.

JJC Copper ETF Trading

JJC Copper ETF Trading

Even though silver has a much higher industrial usage, the SLV moves along with the GLD.   As a result, it soared during Quantitative Easing 2.  Obviously, the charts reveal that most of the trading is from speculators as the JJC should move in an inverse relationship with the GLD.  That is due to gold being used almost entirely for non-industrial end uses while copper is used almost industrial for industrial uses.

Up slightly for the week as traders thought more dramatic economic stimulus efforts would result from the Federal Open Market Committee meeting  other than an extension until the end of the year for Operation Twist, the SLV is down for the last month, quarter, six months and 52 weeks of market action.  Year to date, the SLV is off by 1.48%.

For the last year, however, the SLV is down 33.35%.  Volume was up today, with the SLV below its 20-day, 50-day and 200-day moving averages.  In the most obvious trend, it is trading much lower under its 200-day day moving average at 11.67% down than underneath the 20-day moving average, beneath it by only 0.17%.  The only move worth noting in the technical indicators for silver were the long engulfing green bodies last week after Treasury Secretary Geithner’s  gloomy testimony on The Hill and more bad economic news from the US peaked buying as traders thought Quantitative Easing 3 was coming.

SLV ETF Trading

SLV ETF Trading

If traders long on silver are looking for help from Bernanke, it will not be coming until after the November election, though it could be announced when he speaks later this month at Jackson Hole.


Chris Vermeulen

After a fierce equities rally on Friday, which I figured would happen, just not that strong; I have to wonder if there is some event or major decision in the works we don’t know about?

Friday’s rally could be something simpler like window dressing by the funds. This is when the funds buy up all the top performing stocks for month end reporting. They do this so that their investors think they are on the ball and know what they are doing. Window dressing will end Monday and from there we could see some profit taking (selling) start. But for all we know Obama could be extending the tax cuts for everyone or cutting payroll taxes etc…

It would only take one of these events to trigger a sharp up move in the market and that could be what Friday’s move was anticipating. That being said volume has remained light and during low volume session the market has a tendency to move higher. Sell offs in the market require strong volume to pull the market down, so until volume picks up there could still be higher prices just around the corner.

Let’s take a look at some charts…

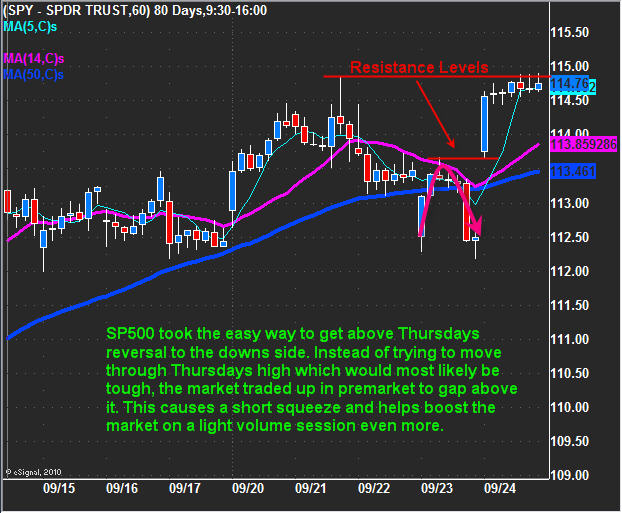
SPY – SP500 60 Minute Intraday Chart

Last week we saw the market reverse to the down side with a strong end of say sell off. That set the tone for some follow through selling and for any bounces to be sold into. That being said, the market always has a way of surprising traders and it did just that on Friday gapping above Thursday’s reversal high causing shorts to cover and the typical end of week light volume drift to help hold prices up.

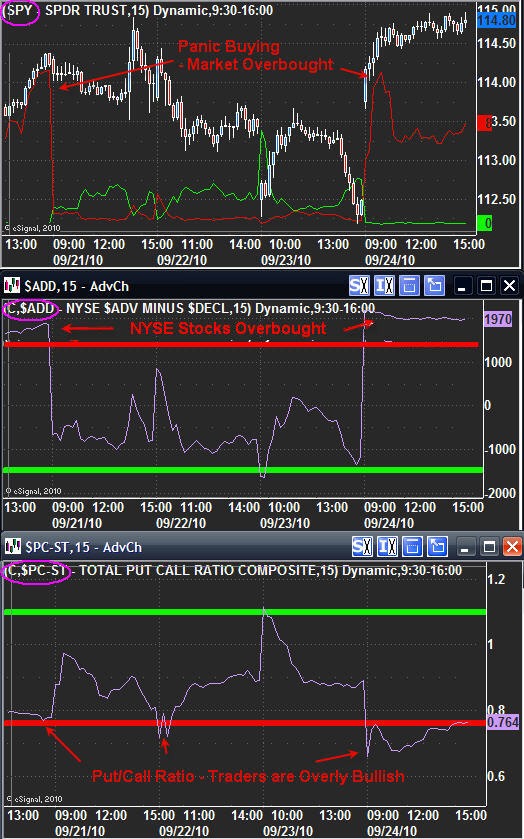
NYSE Market Internals – 15 Minute Chart

I like to follow some market internals to help understand if investors are becoming fearful or greedy. It also helps me gauge if the market is over bought or oversold on any given day.

These three charts below show some interesting data.
Top Chart – This indicator shows me if the majority of shares traded are bought or sold. When the red line spikes up and trades above 5 then I know the majority of traders are buying over covering their shorts. I call this panic buying because traders are buying in fear that the market will continue higher and they will miss the train. When everyone is buying you know a pullback is most likely to occur.

Middle Chart – This is the NYSE advance/decline line. When this indicator is below -1500 then the market is over sold and bottom pickers/value buyers will step in and nibble at stocks. But when this indicator is trading over 1500 then you know the market is overbought and there should be some profit taking starting any time soon.

Bottom Chart – This is the put/call ratio and this tells us how many people are buying calls vs put options. When this indicator is below 0.80 level more traders are bullish and buying leverage. My theory is if they are buying leverage for higher prices, then they have already bought all their stocks and now want to add some leverage for more profits. When I see the majority of traders bullish then I an sure to tighten my stops (if long) as top my be forming.

Putting the charts together – When each of these charts are trading in the red zone know I must be cautious for any long positions because the market just may be starting to top. Or a short term correction may occur.

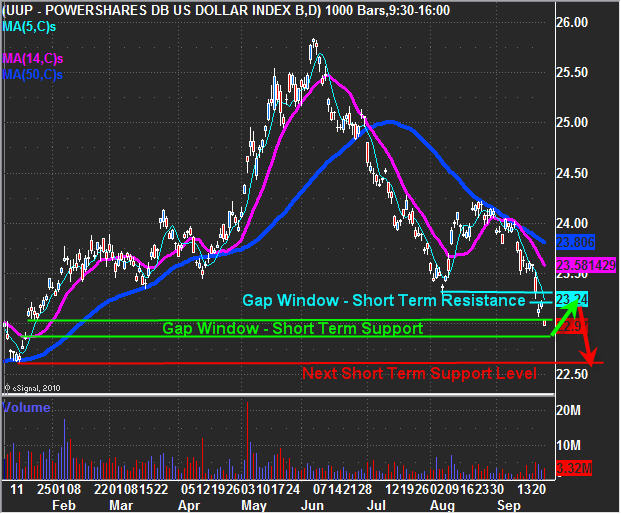
UUP – US Dollar Daily Chart

The US dollar has been under some serious pressure with all the talk about quantitative easing (printing money). Obviously the more the Fed’s print the less value the dollar will have. The chart below shows a green gap window which I think once it is filled should put the dollar in a oversold condition for a short term swing trade bounce before heading back down. A bounce in the dollar will put pressure on equities, gold and oil.

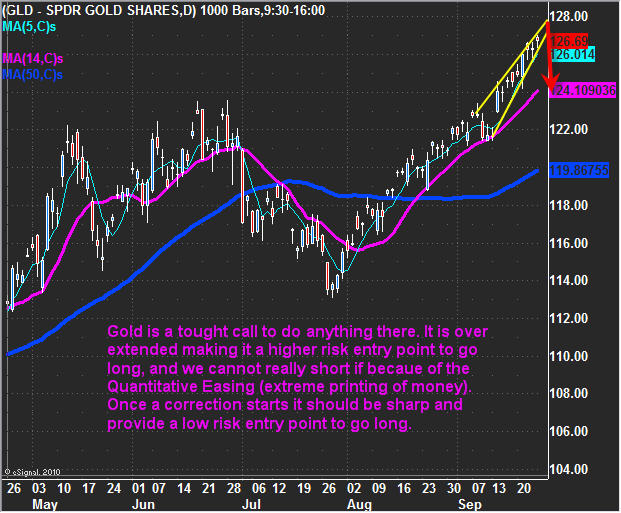
GLD – Gold Daily Chart

Gold continues to grind its way up. This move is looking very long in the teeth and pullback will most likely be sharp.

Weekend Trading Conclusion:

In short, equities and gold continue to grind their way higher while the US dollar continues its grind lower. When I say the market is grinding I am implying the market is over extended and a reversal any day should occur.

Financial stocks like Goldman (GS) which typically leads the market has been strongly underperforming over the past week. Insiders were selling GS very strongly which is strange and makes me wonder what’s up there? With the financial stocks underperforming it sure looks like a market reversal is just around the corner.

If Friday’s rally was simply window dressing by the funds then it should end on Monday and with any luck we will see a sharp reversal to the down side early this week.

You can get my ETF and Commodity Trading Signals if you become a subscriber of my newsletter. These free reports will continue to come on a weekly basis; however, instead of covering 3-5 investments at a time, I’ll be covering only 1. Newsletter subscribers will be getting more analysis that’s actionable. I’ve also decided to add video analysis as it allows me toe get more into across to you quicker and is more educational, and I’ll be covering more of the market to include currencies, bonds and sectors. Before everyone’s emails were answered personally, but now my focus is on building a strong group of traders and they will receive direct personal responses regarding trade ideas and analysis going forward.

Let the volatility and volume return!

Chris Vermeulen
www.TheGoldAndOilGuy.com

Get More Free Reports and Trade Ideas Here for Free: FREE SIGN-UP

Wed Aug 25th
Understanding the key differences between both gold and silver’s risk/volatility levels plays a large part in how I choose a low risk trade setup. Those of you who follow me already know the GLD etf is my favorite trading vehicle as it provides me with low risk trading setups along with a very high win rate.

Ok, let’s jump into to comparing gold and silver as trading instruments. I get the same questions from new traders all the time and I think these two questions will help clear them up.

The questions are:

1. Why don’t you give silver (SLV) trading analysis/signals?
2. Why don’t you trade silver?

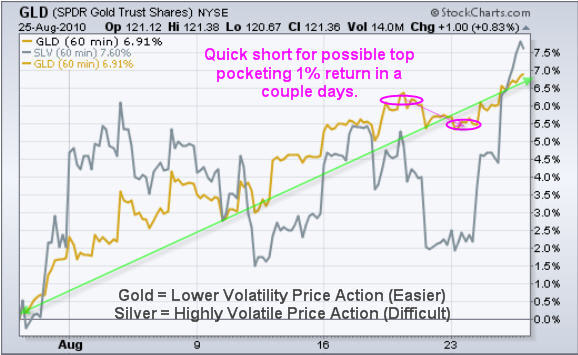
My answer to the questions are simple and the chart below displays my view.

The gold (GLD) signals I provide work with silver so you can just trade silver when I have gold long or short trade. This is the reason I don’t provide much silver analysis because it’s duplicate info.

The chart below shows how gold and silver trade together when it comes to rallies and sell offs. But notice how volatile silver is while gold had a nice slow and steady trend upwards… Gold’s low volatility trending characteristics is what I love about it. Silver on the other hand is all over the place making it easy to have protective stops triggered before the majority of the trend is over. The silver charts almost always look terrible (tough to read for a direction). I really don’t like getting shaken out of a winning trade…

The pink circles show a quick short trade we did this week catching a quick 1% drop. The short trade was for FuturesTradingSignals where we capture 1-3 day extreme market sentiment shifts.

GLD – Gold ETF Trading Chart

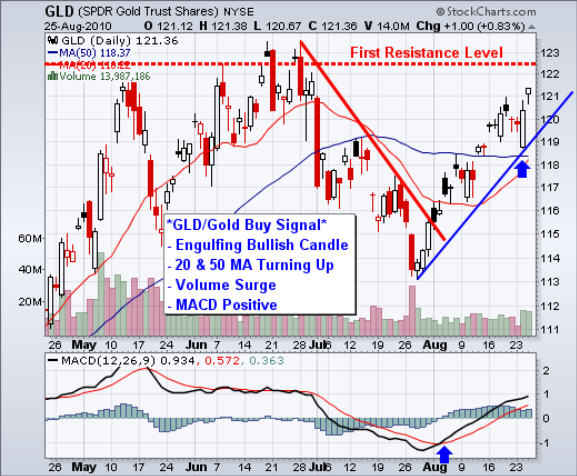
The chart below shows several points as to why gold/silver was screaming BUY ME on Tuesday afternoon. The two things that carry 90% of the strength in my opinion are the candlestick pattern (Bullish Engulfing) and the volume surge. Those two things when seeing on virtually any time frame are a good indication to go long for 1-3 candlesticks minimum.

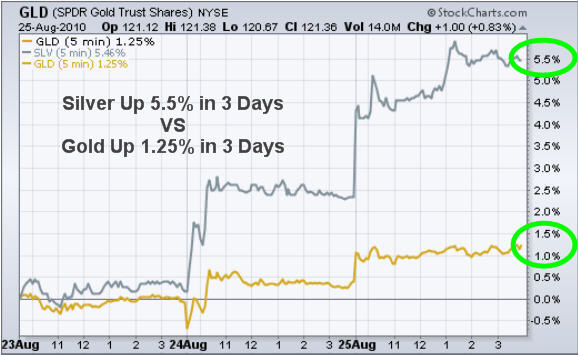
Gold VS Silver – 5 Minute 3 Day Chart

This chart clearly shows the power of trading a more volatile commodity with silver being the one. This week’s buy signal in gold is dwarfed by the performance of silver. Silver has always shined more in my opinion but when it comes to trading… It tougher than it looks to trade because of the wild whipsaw action it makes on a regular basis.

Gold and Silver Trading Conclusion:

In short, gold is the safe haven when it comes to actively trading. I do trade silver here and there but the size of my position is much smaller because of the difficulty level and volatility associated with it. I will not that I do trade gold and silver futures at times but for this report I focused on ETF’s.

If you want to get my Trading Analysis and ETF Trading Alerts Join My Newsletter: www.TheGoldAndOilGuy.com

Chris Vermeulen
GET THESE FREE EDUCATIONAL REPORTS EACH WEEK

Trading commodities and indexes through the use of exchange traded funds sure keeps things simple for an average trader. These funds allow individual investors to buy and sell things like gold, silver, oil, the sp500 and other investments which where not available only few months ago like “wheat” for example.

One of the nice things with ETFs is that is allows everyone to follow the price of a commodity or index using any charting website and can even apply indicators to help spot key support and resistance levels using volume by price analysis. There is no need for a expensive data feeds, charting programs and you don’t have to worry about contract expiration.

Below are a few charts of the trend and my short term forecast.

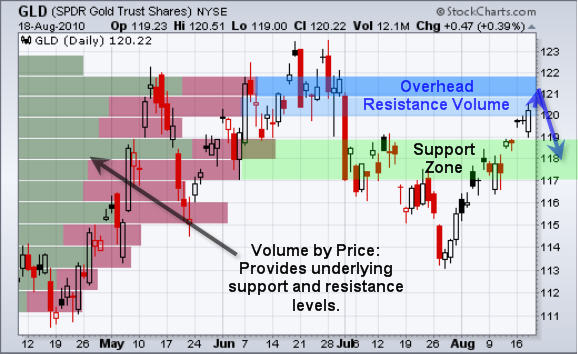
GLD – Gold Bullion ETF

As you can see gold broke out of its support zone this week and popped into the next resistance level. This is very typical price action in the stock market. It is important to look at the price charts like an apartment building. It’s nothing but a bunch of floors and ceilings.

How it works; if a ball breaks though a floor it will naturally fall to the next floor and bounce. The same for if a ball breaks through a ceiling, it will hit the next ceiling then bounce back down. This is essentially how the market moves.

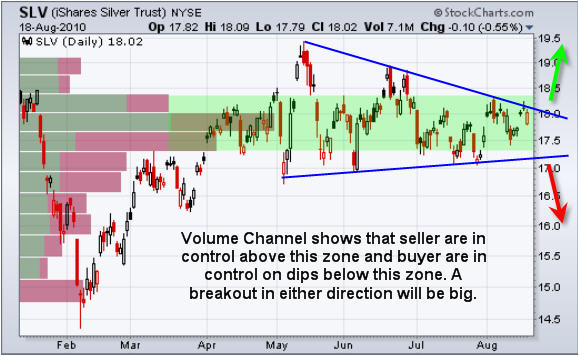
SLV – Silver ETF

Silver is forming a large pennant and nearing its apex. With the amount of volume traded within this large volume channel I would expect a sharp breakout once a direction is made.

USO – Oil Traded Fund

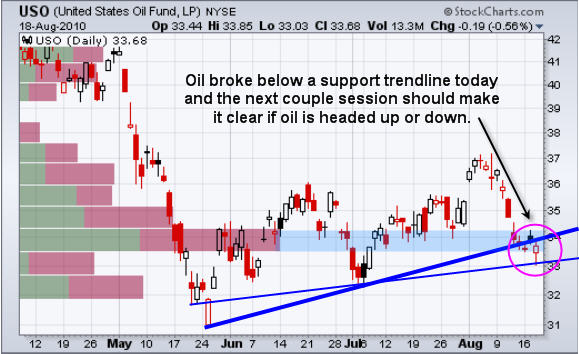
Crude oil had a funky day. Early Wednesday morning in pre-market trading we saw virtually every investment drop at the same time which was strange. Anyways the US dollar dropped sharply and oil when down also. Normally as the dollar drops oil rockets higher but that was not the case today.

Currently oil is trading between two trendlines and is trying to hold up. If we get a breakdown then we could see a sharp drop in oil over the next 1-2 weeks.

SPY- SP500 ETF Trading Fund

The SP500 is trading within a high volume channel, similar to silver. Once a breakout in either direction is made I would expect a sizable move lasting a few w

Mid-Week Commodity and Index ETF Report:

In short, the market looks bearish for the short term of 5-10 trading sessions. This is because everything looks to be trading near resistance levels. That naturally brings sellers out of the woodwork putting pressure on prices.

Silver and gold stocks tend to lead the metals sector on breakouts so it will be important to keep an eye on them as we near a possible breakout or breakdown in the metals. If you see SLV or GDX ETFs out performing the GLD gold fund by 2-3x then I would expect to see gold move higher later that session or the following day.

The US dollar trend usually helps to identify if oil will have downward pressure or not. Also energy stocks tend to lead the price of oil by a few hours and some times a day. I keep an eye on XLE energy etf for a feel of how the energy stocks are doing and also UUP US dollar fund.

As for equities tech, financials and the Russell 2K (small cap stock) tend to lead the way for the broad market. Watching XLK, XLF and IWM help to confirm breakouts.

If you would like to Get My Trading Analysis and Alerts please join my free newsletter at: www.TheGoldAndOilGuy.com

Chris Vermeulen
Nov 4th, 2009
Precious Metals ETF have gone wild the past 2 weeks. Last week we saw gold and silver prices drop sharply as it shook out short term trader’s stop orders before breaking out and moving higher. Also there is a disconnect between the gold and the dollar.

Energy commodities like natural gas and crude oil are moving in opposite directions and look to be picking up speed. Natural gas is losing pressure and oil is on fire.

GLD ETF Trading – Pivot Trading Low
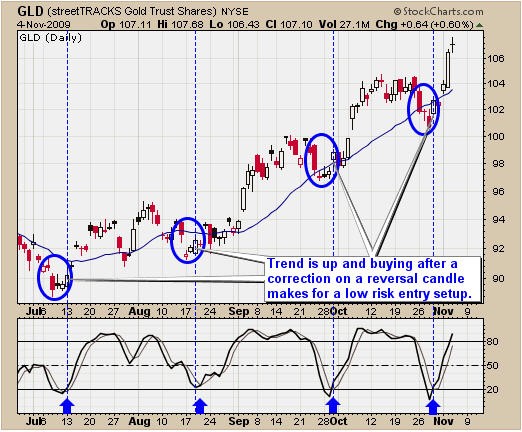
Last week we had our pivot trading low generate another buy signal for gold. Trading pivot lows is a simple trading strategy. I call them low risk setups and take advantage of buying a stock, commodity or currency after a pullback to support and when a reversal candle is formed. This chart clearly shows when you are trading with the trend buying on the dips is generally a low risk play with great up side potential.

Gold Bull Market Pivot Trading Low

Gold Bull Market Pivot Trading Low

Precious Metals ETF Trading – Gold Bullion Takes Control
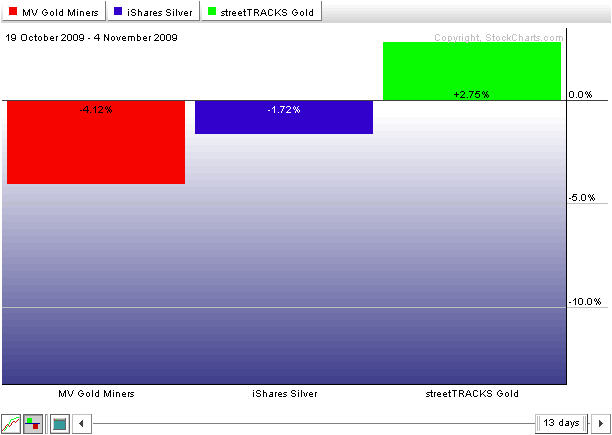
This is a chart which shows the performance of gold stocks (red), silver bullion (blue) and gold bullion (green). As you can see the past 2 weeks while the market has been selling down precious metals stocks have been hit harder than silver and gold.

Because of the heavy selling in stocks recently the smart money had been going into commodities especially gold bullion. Gold stocks are a great play but this is telling us investors feel safer in physical bullion than stocks.

Gold is the most known precious metal and safe haven which is why it’s holding value better than silver and stocks. This week we are seeing gold become more valuable in several major currencies which means gold is actually making a real move higher.

Gold Bullion, Silver Bullion, Precious Metal Stocks

Gold Bullion, Silver Bullion, Precious Metal Stocks

USO ETF Trading – Breakout & Bull Flag
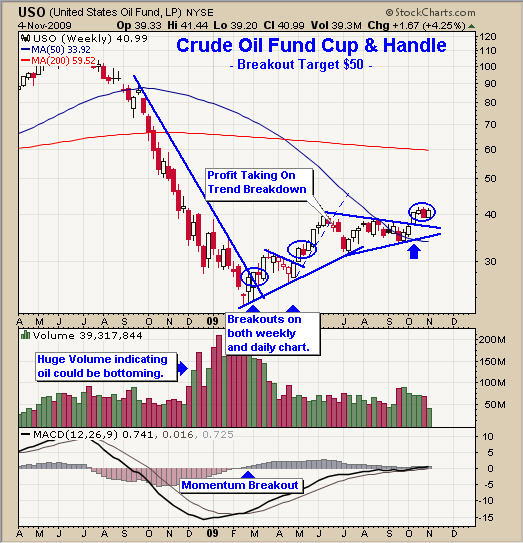
Crude oil has had some great breakouts this year and it looks like we are about to get another buy signal shortly. We had a breakout in Oct from the large pennant and are now flagging which is very bullish. We could see USO reach $50 in the next month or two.

Crude Oil Bull Market Breakout

Crude Oil Bull Market Breakout

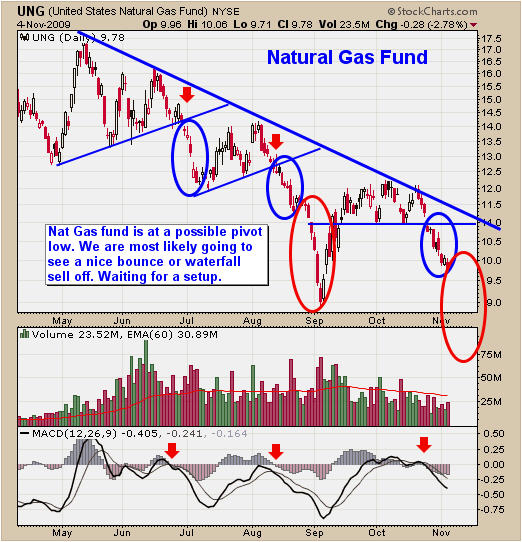
UNG ETF Trading – Pivot Low or Waterfall Sell Off?
Natural gas is at a crucial level for a higher low bounce or another massive panic sell off. Trading right now with UNG is a 50/50 shot so we will just have to wait and let things unfold more before taking any action.

Natural Gas Pivot Low Bear Market

Natural Gas Pivot Low Bear Market


The Stock Markets, Precious Metals & Energy Trading Conclusion:

The market is starting to feel a little squirmy as it tries to find support. Small cap stocks continue to get crushed while blue chip (large cap) stocks are holding more of their value. Gold has broken higher this week while silver and precious metal stocks under perform their big sister Yellow Gold.

Crude oil is holding up nicely forming a 3 week bull flag and showing signs of life while natural gas continues to get hammered.

The market has been jumpy the past 2 weeks because market participants are very uneasy about the future direction of the US dollar.

If you would like to receive these free trading reports join my free list:

Chris Vermeulen
Today we had a reversal day for the broad market, us dollar, precious metals and oil. The market is over extended. We have seen the market rally 20% since the July low.

Inter-market analysis is important to understand because everything is related in some way. The next month will be very interesting with the US dollar trying to rally, which will put pressure on precious metals, stocks and commodities.

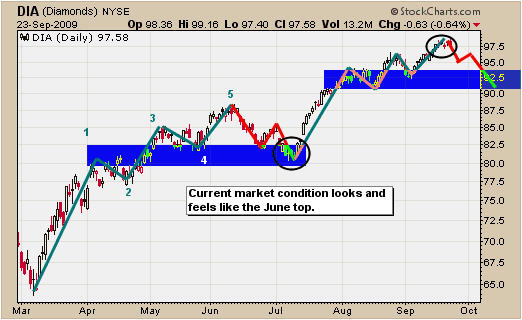
DIA ETF – Dow Industrial Fund
Stocks look to have formed a similar pattern as the March rally this year. The market has the same feel and price action that we saw during the June high, which is telling me we should move stops up to protect profits. Wednesday the market had an intraday reversal and that is a sign of weakness. The past four trading day’s is the same as the July bottom (multiple Doji Candles). Doji candles indicate a possible reversal.

DIA ETF Trading Newsletter

DIA ETF Trading Newsletter

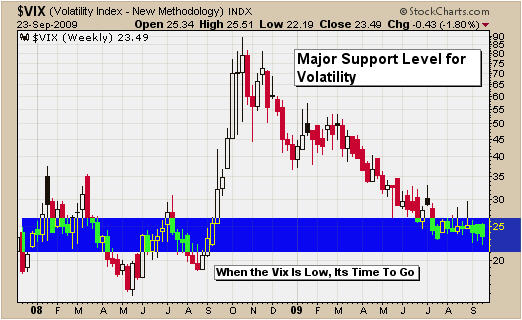
Broad Market Volatility Index
Here is a weekly volatility chart that shows we are at a long term support level. The saying is, buy when the VIX is high, sell when the VIX is low. Just to be clear, I am not saying sell everything. I am just pointing out that the market is ready for a multi week correction. I am tightening my stops and limiting my position size for new log positions.

VIX Volatility Index Trading

VIX Volatility Index Trading

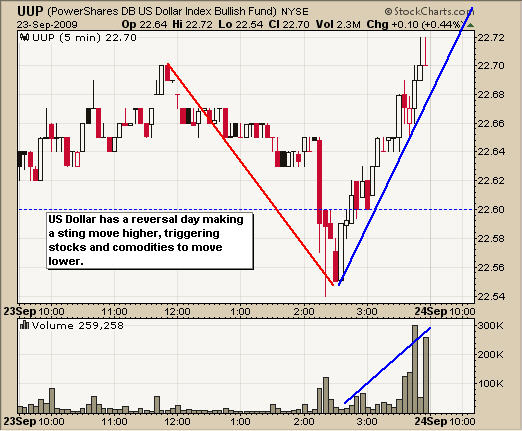
UUP ETF – US Dollar Intraday Price Action
The dollar sold down Wednesday, then rallied very strong into the close, indicating a shift in momentum. The dollar has been trending down for several months and ready for a bounce.

UUP US Dollar Trading Fund

UUP US Dollar Trading Fund


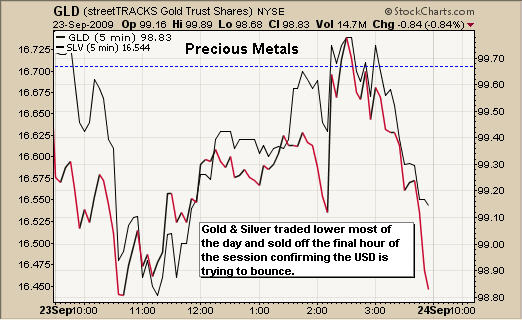
Precious Metals Under Pressure

Below is a chart of Gold and Silver showing the weakness on Wednesday and the sharp sell off late in the session, when the US dollar started to rally.

Precious Metals Trading Newsletter

Precious Metals Trading Newsletter

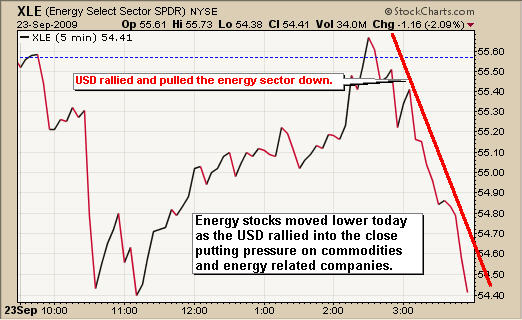
XLE Energy ETF – Intraday Chart
Energy sector moved down in the morning and managed to wiggle its way back to positive territory late in the day, but when the US dollar rallied, crude oil and the energy sector sold off sharply.

XLE Energy Trading Newsletter

XLE Energy Trading Newsletter

Inter-Market Analysis Conclusion:
In my opinion things look to be setup for a multi week shift in momentum. It looks like the US Dollar will bounce putting pressure on precious metals, stocks, and commodities like crude oil.

Stocks look ready to correct and a bounce in the dollar will trigger the correction.

Gold is at a major resistance level, and taking a breather at this level would be normal price action. Gold has also been trading in sync with stocks, so this relationship is most likely still in place. If stocks move down, so will gold.

Crude oil is having a tough time moving higher and with Wednesday’s higher than expected oil inventory levels, there will be more down side pressure.

Currently we have several profitable position and we will be tightening our stops and looking for new opportunities in the coming days.

If you would like to receive my Free Weekly Trading Reports for ETF’s or Stock Trading Reports please visit my websites: www.GoldAndOilGuy.com and www.ActiveTradingPartner.com

Chris Vermeulen
Over the past couple of months, gold and silver have been uneventful. In this report I have posted weekly charts to show the larger trend of gold and silver. Also I have provided small charts of the US and Canadian gold stock funds GDX and XGD.

Because this report has weekly charts, which are a slow and dull time frame to follow, I have added another one of my Kitco Spot Gold Overlay trades, which is a short day trade to liven things up.

GLD ETF – Gold Bullion Price Action – Weekly Chart
I spoke with a few members last week, who wanted me to change my analysis for gold, which I agree with. So I would like to address this now to keep everyone on the same path.

In previous reports I have pointed out the reverse head & shoulders pattern in this weekly chart below. But to be honest, it is not a reverse head & shoulders, which everyone is saying it to be.

Why is gold not in a reverse H & S pattern? Because a reverse H & S pattern is just that, it means the price will reverse from the previous trend. A reverse H & S happens after a downtrend, which forms a bottom and the trend is not moving higher.

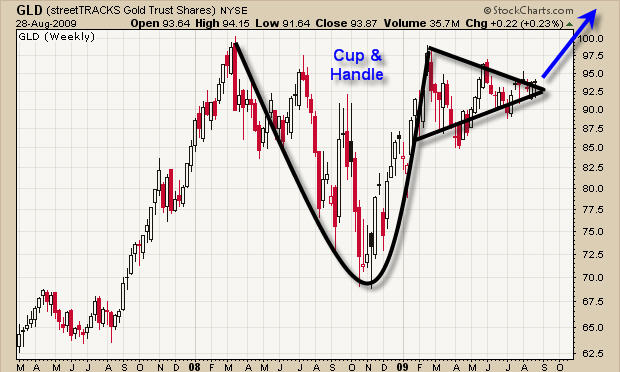
Gold has been moving higher, which you can see in 2007 and this large pattern is more like a Cup & Handle pattern – extremely bullish.

Trading Spot Gold Chart - Weekly

Trading Spot Gold Chart - Weekly

SLV ETF – Silver Bullion Price Action – Weekly Chart
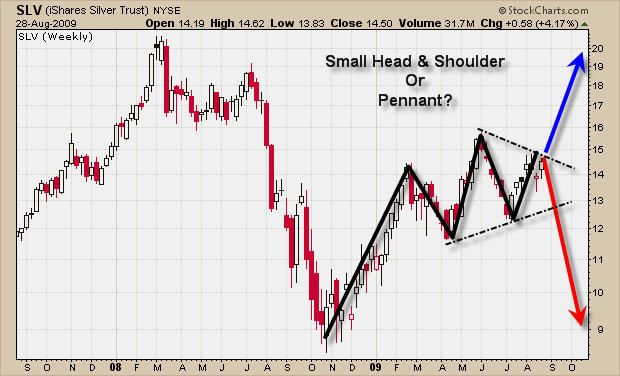
Silver is trading a little different than gold. As you can see the price is trading much lower than the 2008 high. There are also two small patterns forming, which are a small head and shoulders top or a bullish pennant.

Last Friday we saw gold and silver prices jump, but until we get a low risk entry point, I continue to watch these commodities move inside their large weekly price patterns.

Spot Silver Chart - Weekly

Spot Silver Chart - Weekly

US & Canadian Gold Stock Funds
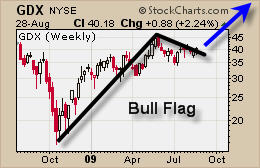
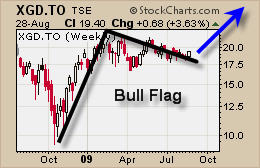
These small charts show how bullish the price action is this year for gold stocks. But the exciting part, which is tough to see here, is that the Canadian fund is starting to show bullish price action. When both the US and Canadian gold funds are moving together, it means there will most likely be some tradable moves in the near future. Let’s keep focused and ready to take action in the coming weeks, as these bull flags near the end of their cycle.

US Trading Gold Stocks

US Trading Gold Stocks


Canadian Trading Gold Stocks

Canadian Trading Gold Stocks

Day Trading Spot Gold – Day Trading GLD ETF
I will keep this short because I have written about this once before and below is the link to read my gold trading strategy in detail.

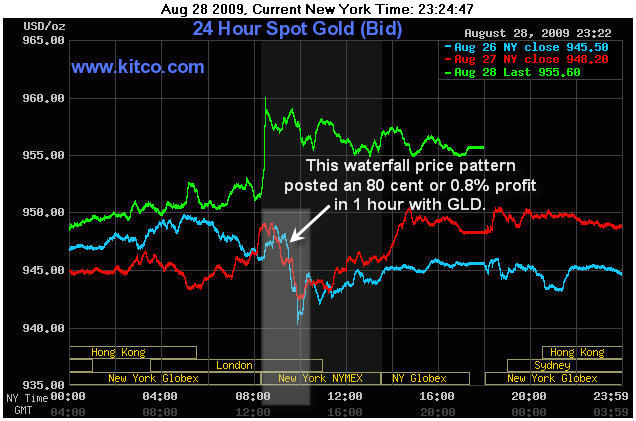
Day trading spot gold using the real-time kitco overlay chart is what I use to identify a possible day trade. The shaded box below shows a simple waterfall sell off and when I see that price action, I will generally take a position the next day around that time for a short trade in GLD.

I did not think to save this kitco chart until the following day so the waterfall price action was miniaturized because of Fridays rally. Also I would like to note this waterfall pattern happened 3 times in a row last week and I took advantage of them.

My Basic Strategy
Gold tends to move similar to what it did the previous day and traders know this, which is why the patterns starts 5-30 minutes earlier the following day, as we anticipate the move. Moves tend to repeat for up to 3 days. So you identify a sizable move and take action on it the following two days, as long as the rest of the day trades similar to the previous days. I like to scale into positions and once I see it going my way I add one final position to increase my exposure.

I am sure some of you are wondering how I traded GLD at 8am ET?
I trade with an online broker that allows me to trade pre-market and post market hours. Not very often these setups happen before 9:30am ET but last week it did.

Important note:
Once you see the price of gold making opposite moves of the previous day, minimize your position or don’t take the trade. As you can see in this chart below, the red line is starting to move the opposite way of the previous day (baby blue line) and later in the afternoon it was completely the opposite. This is a warning that there is a shift in the buyers/sellers and you can see the next day prices spiked higher in the opposite direction.

Day Trading Spot Gold - Day Trading GLD ETF

Day Trading Spot Gold - Day Trading GLD ETF

Read my previous Gold Day Trading Guide:
http://www.thegoldandoilguy.com/spot-gold-price-charts/

Technical Gold Trading Conclusion:
Overall precious metals are trending sideways in their bullish patterns and we are waiting for some low risk entry points.

During slow trading times, which we are currently in, I like to look for other profitable positions to satisfy my need to trade. As a full time trader, it is important to have a few styles of trading, which allow you to profit in any market condition. My main focus is on the commodity ETF’s, with low risk setups, but I also day trade GLD when opportunities arise and I also trade extremely over bought/oversold index plays using the leveraged ETF’s and focusing on my Active Trading Partners stocks trades, which provides profitable trades week after week. Combining these trading styles allow me to pull money from the market week after week without forcing any positions. I just let perfect setups unfold and I take advantage of them.

Soon I will be providing these gold day trades and index trades for members, which I think is very exciting. If you would like to receive my free weekly trading reports please visit my website at: www.GoldAndOilGuy.com

Chris Vermeulen