Posts

Recently, the Transportation Index and the S&P SPDR ETF setup topping patterns near the end of April 2020.  In terms of technical triggers, these patterns need to see additional downside price confirmation before we can confirm the true potential for these setups. If they do confirm, we could be starting a new downside price trend fairly soon.

The recent market upside price move is dramatically different on the TRAN chart vs. the SPY chart.  Even though the SPY price advance has mirrored the move in the ES and NQ, the TRAN upside price move has been more muted.  This is because global economic activity has continued to stall and is not translating into active shipping and trucking activity.  Remember, the Transportation Index helps us to understand the core levels of economic activity as parcels and products move around the globe.

Initially, the downside price break that occurred on Friday, May 1, 2020, which acts as a potential new downside price trend, yet we would want to see the recent lows from 8 days ago breached before we could consider this a truly confirmed trend.  Technical traders may choose how and when to enter new trades/trends – yet we like to teach our followers to wait for true confirmation. I posted a short video about how I analyze the index for new trades here.

TRANSPORTATION INDEX (TRAN) DAILY CHART

On the TRAN chart, the recent lows near 7,762 would qualify as a breakdown price move.  Thus, if the TRAN sells off below that level, then we would have a confirmed downside price trend expecting 6,500 to be reached again.
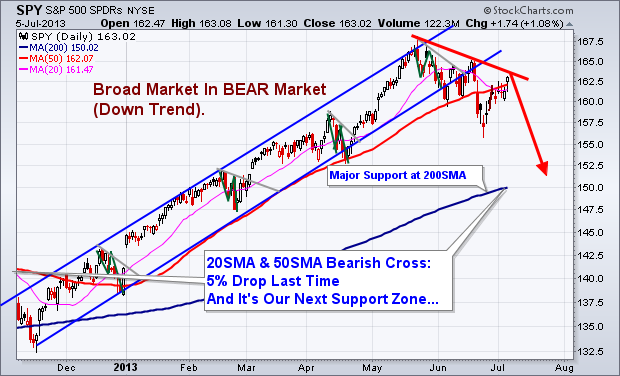
SPY DAILY CHART

On this SPY chart, a similar type of Three River Evening pattern setup a nearly perfect top over the past four days.  A confirmation appears to be valid on Friday, May 1, 2020.  Yet, we would need to wait to see if the low price level near 272 is breached before we could confirm a true breakdown in this upward price trend.


Skilled traders should pay very close attention to what happens over the next five or more trading days as any new breakdown in price could be very volatile and aggressive.  Our researchers believe the 251.50 level on the SPY would be the next downside target (see the YELLOW ARROW on this chart).

The heavy GREEN Arcing line near the recent peak is our proprietary Fibonacci Price Amplitude Arc representing a very key resistance level (1.618x).  Notice how this level played a very key role in providing initial support in early March and is now acting as a major top/resistance area.

We could be in for a very big ride if a new breakdown begins soon.

SPY WEEKLY CHART – REVERSAL CANDLE

This 35% bounce in the SP500 I called many weeks showing how this very similar setup unfolded during the 2000 market top.

2000 STOCK MARKET TOP & BEAR MARKET THAT FOLLOWED

The chart may look a little overwhelming, but look at each part and compare it to the market psychology chart above. What happened in 2000 is what I feel is happening this year with the stock market sell-off.

In 2000, all market participants learned of at the same time was that there were no earnings coming from their darling .com stocks. Knowing they were not going to make money for a long time, everyone started selling these terrible stocks, and the market collapsed 40% very quickly.

What is similar between 2000 and 2020? Simple really. COVID-19 virus has halted a huge portion of business activity, travel, purchases, sporting events, etc. Everyone knows earnings are going to be poor, and many companies are going to go bankrupt. It is blatantly clear to everyone this is bad and will be for at least 6-12 months in corporate earnings; therefore, everyone is in a rush to sell their stock shares and are in a panic to unload them before everyone does.

Before you continue, be sure to opt-in to our free market trend signals
before closing this page, so you don’t miss our next special report!

2020 STOCK MARKET TOP IS UNFOLDING

As you can see, this chart below of this year’s market crash is VERY similar to that of 2000 thus far, it’s based on a similar mindset.

I posted this chart originally mid-March, expecting a 30+% rally from these lows before the market starts to fall and continue the new bear market, which I believe we are entering. Only the price will confirm the direction and major trend to follow, and since we follow price action and do not pick tops or bottoms, all we have to do is watch, learn, and trade when price favors new low-risk, high reward trade setups.

It does not matter which way the market crashes from here, we will either profit from the next leg down, or will miss/avoid it depending on if we get a tradable setup. Either cause is a win, just one makes money, while the worst-case scenario just preserves capital in a cash position, you can’t complain either way if you ask me.

I have issued an Important Trade and Investment Alert here because a new bear market is potentially just around the corner.

CONCLUDING THOUGHTS:

As a technical analyst and trader since 1997, I have been through a few bull/bear market cycles in stocks and commodities. I believe I have a good pulse on the market and timing key turning points for investing and short-term swing traders. 2020 is an incredible year for traders and investors.  Don’t miss all the incredible trends and trade setups.

Subscribers of my Active ETF Swing Trading Newsletter had our trading accounts close at a new high watermark. We not only exited the equities market as it started to roll over in February, but we profited from the sell-off in a very controlled way with TLT bonds for a 20% gain. This week we closed out SPY ETF trade taking advantage of this bounce and entered a new trade with our account is at another all-time high value.

Ride my coattails as I navigate these financial markets and build wealth while others watch most of their retirement funds drop 35-65% during the next financial crisis.

Just think of this for a minute. While most of us have active trading accounts, what is even more important are our long-term investment and retirement accounts. Why? Because they are, in most cases, our largest store of wealth other than our homes, and if they are not protected during the next bear market, you could lose 25-50% or more of your net worth. The good news is we can preserve and even grow our long term capital when things get ugly like they are now and ill show you how and one of the best trades is one your financial advisor will never let you do because they do not make money from the trade/position.

If you have any type of retirement account and are looking for signals when to own equities, bonds, or cash, be sure to become a member of my Passive Long-Term ETF Investing Signals which we issued a new signal for subscribers.

Chris Vermeulen
Chief Market Strategies
Founder of Technical Traders Ltd.

The US stock market has rallied substantially since the bottom on March 23, 2020.  Our Adaptive Fibonacci Price Modeling system is showing us just how fragile the US stock market and certain sectors of the markets really are right now.  What’s going to happen next and how should you prepare for the next big move?  Let us try to explain our beliefs.

First, the US stock market bottom just as the US Senate and Fed announced major stimulus packages designed to support the collapsing markets.  Everything done prior to the March 23 date was “fodder” as the risk to the global markets was far greater than anything the US Fed or global central banks could muster.  On March 23, the US Fed initiated an unlimited asset purchase program to support the failing markets.  This changed the perspective of traders/investors immediately – but it also created a massive risk factor that few even considered. For a complete timeline on the US Fed actions, review this link.

Our own research team was calling for a breakdown in the US and global markets many months in advance of this move – even before the world knew about the Chinese/Wuhan virus event.  Take a look at some of our research posts from the past

January 26, 2020: The Black Swan Event Begins

January 29, 2020: Are We Setting Up For A Waterfall Selloff?

February 18, 2020: Is The Technology Sector Setting Up For A Crash? Part II

Less than 3 days prior to the massive selloff event, we posted this:

February 24, 2020: Has The Equities Waterfall Event Started Or A Buying Opportunity?

Today, we are posting this research article to highlight the unique setup in many of the major US stock indexes and sectors.  Using our Adaptive Fibonacci Price Modeling system, two things become clearly evident in the charts…

A.  Price must hold above support levels (the upper TRIGGER ZONE level and/or the GREEN Fibonacci Trigger level on the right side of the chart) in order for the uptrend to continue.

B.  Price has already reached (in most cases) the CYAN Fibonacci projected target level and this level may turn into major resistance pushing the price back into a downtrend.

BEFORE WE CONTINUE, BE SURE TO 
OPT-IN TO MY FREE MARKET TREND SIGNALS 
SO YOU DON’T MISS OUR NEXT SPECIAL REPORT!

DAILY SPY CHART

This first Daily SPY chart clearly highlights the setup we are describing.  First, take a look at the CYAN line on the chart near the 282.97 level.  This Fibonacci target level becomes support when price moves above it and becomes resistant when price moves below it.  Currently, the SPY is trading very near to the 283 level and we believe this level may turn into massive resistance over the next 5 to 10+ days.

Secondly, take a look at the TRIGGER ZONE on this chart (a price zone drawn between the Bullish and Bearish Fibonacci price trigger levels).  This zone represents a very dangerous price area where the overall price trend may change directions and where volatility could explode. As long as the price stays above this zone, then moderate bullish price activity should be expected.

If the price falls below this zone, then moderate to strong bearish price activity should be expected.  The reason why the downside risk is much greater than the upside potential is because of the recent downtrend in the market that sets up a “recent higher high” near 295.50.

MONTHLY SPY CHART

This Monthly SPY chart highlights the longer-term Fibonacci price analysis.  The extreme breakdown in price has already broken below the RED Fibonacci Bearish price trigger level near $300 and broken through the BLUE initial target level near $279.00.  The next downside price target levels are GREY, near $173.40, and RED, near $128.00.  Currently, the SPY price has rallied back above the BLUE target level and is stalling near $282~285.  This price level is already below the $300 Bearish Trigger level – which suggests further downside price activity in our future.

Additionally, pay attention to the “arcs” that are on this Monthly chart.  These are our proprietary Fibonacci Price Amplitude Arcs that show us where price may target based on a theory that each price trend creates “price amplitude waves” into the past and future.  Currently, the “4D” area on this chart is our most likely bottom area.  There is also a “1.618” GREEN price arc that is just above the current price level (near $292).  We believe this Green 1.618 level is acting as major resistance and that price will reverse back to the downside within a 5 to 10-day window.

WEEKLY TRANSPORTATION INDEX CHART

This Weekly TRAN, Transportation Index, chart highlights a similar pattern but also shows how much downside pricing pressure is still evident across different sectors of the markets.  Even though the ES, NQ, and YM have rallied to near 50% to 61% of the initial downside price move, the Transportation Index has only recovered to the 38.2% Fibonacci Retracement level.  This suggests that the US Fed and global central banks have poured capital into the blue chips and technology sectors while leaving much of the broader market bloodied and on the sidelines.

A similar type of setup is appearing in this TRAN chart.  The CYAN target level has been reached and the price has stalled just above this level.  The TRIGGER ZONE is clearly evident on the chart and the price is slightly above that level right now.  Very clear downside price targets are evident (RED, Blue and GREY) and any price move below $7565 will likely prompt a much bigger downside price move.  What we are seeing in the markets is that any substantial downside price rotation will potentially set up a much bigger downside price collapse in the US and global markets.

WEEKLY XLF CHART

This Weekly XLF chart, the Financial Sector SPDR ETF, sets up almost identical to the TRAN chart.  Deeper price targets, the price has already reached the CYAN target level and stalled recent downside price rotation, and a very real possibility that any downside price move could breach the Fibonacci Bearish Price Trigger Level near $21.

What happens if, suddenly, the US and global markets roll lower by 5% to 10% and a new wave of selling panics the markets?

CONCLUDING THOUGHTS:

The answer is that the US and global markets will attempt to reach the most recent low price levels, or one of the deeper Fibonacci bearish target levels on these charts, and attempt to find support (or true market value) before attempting any move higher.  One must understand that until price shows us that it is capable of rallying above all-time highs, there is still a very real risk that another downside price move could take place.

These TRIGGER ZONES are key to understanding where the fragile balance in price is located on these symbols. As long as price stays above this zone, then continued bullish price action should be expected. If the price falls below this zone, then more downside price activity should be expected.

If you pay very close attention to almost all of these charts, you’ll notice that the next Fibonacci upside price targets (above the CYAN level) are well above the most recent all-time high levels.  This suggests that price will have to rally well above these all-time high levels to qualify the next bullish price target.  It could happen if the global markets recover much quicker than we expect and the earnings/GDP damage is minimal.  But given what we believe is really happening throughout the world right now, the downside targets seem more realistic outcomes (unless the US Fed and global banks absorb $40 to $50 Trillion in global risk assets over the next 60 days.

Watch how the markets react to these price levels and how the longer-term price pivots setup on these Weekly/Monthly charts.  The price will tell us where it wants to go.  We just have to be on the right side of the move so we don’t get slaughtered by a sudden price move.

As a technical analyst and trader since 1997, I have been through a few bull/bear market cycles in stocks and commodities. I believe I have a good pulse on the market and timing key turning points for investing and short-term swing traders. 2020 is an incredible year for traders and investors.  Don’t miss all the incredible trends and trade setups.

Subscribers of my ETF Swing Trading Newsletter had our trading accounts close at a new high watermark. We not only exited the equities market as it started to roll over in February, but we profited from the sell-off in a very controlled way with TLT bonds for a 20% gain. This week we closed out SPY ETF trade taking advantage of this bounce and entered a new trade with our account is at another all-time high value.

Ride my coattails as I navigate these financial markets and build wealth while others watch most of their retirement funds drop 35-65% during the next financial crisis.

Just think of this for a minute. While most of us have active trading accounts, what is even more important are our long-term investment and retirement accounts. Why? Because they are, in most cases, our largest store of wealth other than our homes, and if they are not protected during the next bear market, you could lose 25-50% or more of your net worth. The good news is we can preserve and even grow our long term capital when things get ugly like they are now and ill show you how and one of the best trades is one your financial advisor will never let you do because they do not make money from the trade/position.

If you have any type of retirement account and are looking for signals when to own equities, bonds, or cash, be sure to become a member of my Long-Term Investing Signals which we issued a new signal for subscribers.

Chris Vermeulen
Chief Market Strategies
Founder of Technical Traders Ltd.

Precious Metals ETF Trading: It’s been a week since my last gold & silver report which I took a lot of heat because of my bearish outlook. Friday’s closing price has this sector trading precariously close to a major sell off if it’s not already started.

On a percentage bases I feel precious metals mining stocks as whole will be selling at a sharp discount in another week or three. ETF funds like the GDX, GDXJ and SIL have the most downside potential. The amount of emails I received from followers of those who have been buying more precious metals and gold stocks as price continues to fall was mind blowing.

If precious metals continue to fall on Monday and Tuesday of this week selling volume should spike as protective stops will be getting run and the individuals who are underwater with a large percentage of their portfolio in the precious metals sector could start getting margin calls and cause another washout, spike low similar to what we saw in 2008.

ETF Trading Charts:

Below are updated with Friday’s closing prices showing technical breakdowns across the board..

ETF Trading Strategies ETF Trades ETF Trade


Sweet & Sour ETF Trading Analysis:

Just to make things a little more interesting I would like to point out a couple other types of analysis.

cefSweet:  Through analysis of the CEF Central Fund of Canada Ltd. chart and evaluation it is clear precious metals are falling out of favor at an increased rate. This fund owns physical gold and silver bullion and investors are fleeing the fund so fast that it is now trading at a 7% discount of its asset value. While this may not seem good for metals I see it as a positive.

When everyone is running for one door after an extended moves has already taken place it tends to act as a contrarian indicator. Knowing that some of the largest percent moves in a trend takes place before reversing, I see this information as an early warning that a bottom will soon be put in place.


Sour: While the USD index has not been much help compared to 2012, I feel as though a rising dollar is likely to unfold for a couple weeks which may lend a hand to pulling the precious metals sector down.

ETF Trading Chart


Precious Metals ETF Trading Conclusion:

While I am starting to get bullish for a long term investment in precious metals I know that a bottom has likely not yet been made. But even if it has been, it is better to buy during a basing pattern or breakout to the upside from a basing pattern than to be underwater with a position for an extended period of time along with all the other negatives that come along with it.

I do like the idea of CEF as a long term investment when I feel the time is right. I have invested and traded it many times in the past. The key to trading the fund is to be sure you are buying it at fair value or a discount from the net asset value. You do not want to be buying it when it is trading at a 5-7% premium. The fund owns both gold and silver making it a simple diversified precious metals play.

Get More Free ETF Trading Ideas & Analysis at: www.GoldAndOilGuy.com

Chris Vermeulen


US Equities opened higher this morning and are setting up for a sharp pullback based on technical analysis using trends, cycles, momentum, volume, market breadth and key resistance zones.

Take a look at the charts below for a quick flash of what I think.

Barchart Market Momentum Index

This chart I look at daily. In short if its price is at 101 or higher I expect the broad market to pause or pullback within the next day.  It tells me if stocks have moved to far in one direction on a daily basis and if so sellers (big money players) are likely to re-align stocks by taking profits or shorting during these times.

Momentum1


Stock Trading Above the 50 Day Moving Average

Here we can see that while the SP500 has been rising over the past 6 months less stocks are trading above their 50 day moving average. This means a smaller group of stocks is holding the market up and it’s just a matter of time before those stocks burn out and roll over also.

Broadmarketstrength2


SPY Swing Trading Analysis – Daily Chart

With the SP500 breaking down from its trend channel and testing a short term resistance trend line. Odds favor sellers should become more active and pull the market down as they unload any remaining long positions and possibly get short the market. Both of these actions will put pressure on US Stocks.

SPYswingTrend


Big Picture Outlook – Don’t Get Me Wrong!

This chart is just to show you what is possible. I am not a perma-bear nor do I want another bear market like this to happen. But knowing what is possible still has to be known. Major market tops are a lengthy process and tends to take several months. If this is the case then it could be a wild and choppy market for the rest of 2013 and a great way to play this is through writing options. Do not expect price to just collapse and free fall for 18 months… Dreams like that do not happen. Bear markets must be actively traded as they carry a lot of risk.

SP500LongTermTop


Flash Chart Analysis Conclusion:

This week is do or die for US stocks. We need sellers to step in here and pull stocks down. With the SP500 trading at resistance, stocks being overbought on a short term basis and the holiday week behind us which typically favors higher prices it is now time for sellers to become active once again.

Get more timely updates at: www.GoldAndOilGuy.com

Chris Vermeulen


Chris Vermeulen www.TheGoldAndOilGuy.com

Over the past week I have been keeping my eye on several key sectors and stocks for potentially large end of year rallies to lock in more gains before 2013.

My recent calls have been RIMM (up 54%), AAPL (up 5%), FB (up 8%) so it’s been a great month thus far. That being said there are three other plays that look amazing and one of them is the utilities sector.

Looking back 30 years clearly utilities have a tendency to rally going into year end. What makes this setup so exciting is that the Obama tax for 2013 has caused many investors to lock in capital gains along with dividend gains so the utility sector has recently been beaten.

I always like to cheer for the underdogs because they can make large moves quickly and this season its utility stocks.

30 Year Seasonality – Utilities Stocks

Utility Stocks Seasonality


Utility Sector ETFs:

In the graph below I show the main utility ETFs for trading. Simple analysis clearly shows the selling momentum is slowing and where price should go if it can breakout above the red dotted resistance line. Exchange traded funds XLU, FXU, IDU, and DBU are the funds I found to be setting up.

Utility Sector ETFs


Utilities Sector Trading Conclusion:

While I feel utilities are about start moving higher it is important to mention that the broad market is setting up for a 1-3 day pullback. If the stock market does pullback this week then we should see utilities pullback also. What I am looking for is a minor pullback in XLU with price holding up above $34 while the stock market pulls back.

If you would like to get my simple yet profitable ETF & Stock Trading Ideas then join my newsletter today: www.TheGoldAndOilGuy.com

Chris Vermeulen

Add to SocialTrade

The stock market is at a very critical pivot point which I feel will generate opportunities in December and for the first quarter of 2013.

Trading with the trend is not always an easy task. It is human nature to predict and jump to conclusions and usually it’s better to trade with the trend no matter what your emotions are telling you. The current trend is down and I stick with that until we are proven wrong.

If you carefully analyze the charts below you will understand where we are trading in the market and what the risks are at this point. The question is are in the middle of a trend reversal back up, or is this just a bounce within a down trend? Either way, any pullback this week should be aggressively managed to lock in gains and tighten stops because it could go either way and you do not want to be on the wrong side of the table.

The chart below shows the US dollar index 4 hour chart. It looks as though we should start to see a bounce this week and that should put pressure on stocks and commodities.

The SP500 (SPY etf) below that shows my analysis and key price levels. I took a short position on the SPY Friday afternoon as I feel a pullback is imminent. That being said, all I need is one big down day and I will be pulling money off the table to lock in gains and tighten my stop.

If a detailed educational lesson on stock market cycles read my mini course here: http://www.thegoldandoilguy.com/downloads/COAAROTB.pdf

Dollar Index and SPY ETF Trading

My trading charts make reading the market simple, quick and precise so if you want this type of analysis and trade ideas delivered to your inbox every day including my Pre-Market video analysis then join my newsletter here: www.TheGoldAndOilGuy.com

Chris Vermeulen

The equities market technically still has another day of positive momentum behind it and with a short holiday week higher prices are favored.

This morning in the video I mentioned how oil continues to look untradible because of the sharp news related swings and lack of clear chart patterns. Yesterday it rallied over 2% and today is back down 2%… Steer clear of this beast…

SP500 (broad market) continues to grind sideways/higher today. Volume is very light which bodes well for lower prices in the coming days. I would love to see a Pop-N-Drop tomorrow which is when the index gaps higher at the open into a resistance zone at which point we would be looking to get short (buy the SDS).


Research In Motion shares hit our first resistance level after being upgraded this morning…. Buy the rumor sell the news…? If you are long taking some money off the table here is smart play and to move your stop to break even or better.


Coal sector is looking tasty today and we may take a long position in KOL, but I will update if I do so.


Remember you can now view some of my live charts at stockcharts each day. If you are a member of stockcharts.com then PLEASE follow my ChartList and Vote for it each day so I know its worth me updating for you: http://stockcharts.com/public/1992897

Chris Vermeulen
Add to SocialTrade

This will be an interesting week as we look for the stock market to pullback.

The US dollar has pullback this morning and that has help lift stocks back up to their Friday’s high. This type of move is normal for the stock market as it tests trader’s emotions and trading skills. As we all know the market knows how to shake out the masses just before a big move. With any luck this morning’s move up will cause a lot of traders to cover their shorts and then the market will roll over and sell down sharply.

The dollar still looks bullish in my opinion and should continue up today/this week. If this happens it will put pressure on both stocks and commodities.

Gold and silver are trading sideways/down slightly this morning, nothing significant.

Oil is trading up near resistance in a rising wedge and my actually start to pullback very soon. I’m keeping my eye on it for a setup as we may go long an inverse oil fund this week looking for a 2-5 day pullback.

In this morning’s video I talk about how the market in generally likes to test high and lows and where we stand with our current position.

Watch Short Video Now: http://www.thetechnicaltraders.com/ETF-trading-videos/

Get these Free Weekly Reports EVERY WEEK

The past month has been a wild ride for both equity and commodity traders around the globe. Novice traders have had their heads handed to them and their investment accounts drained. When fear, uncertainty and volatility are running high, some of the best opportunities become available to those who know what to look for. These market conditions force you to focus and strive for perfection in finding low risk entry setups and to also actively managing positions with laser focus because within hours a winning trade can turn into a losing trade.

Looking back on the daily charts of the dollar, SP500, gold, and also the overseas markets it looks as though we are nearing a market bottom. I say NEARING because I think investments need more time for the current selling pressure and bearish sentiment to run its course, which could take another few weeks and possibly a few month before truly bottoming.

Let’s take a quick look at some charts…

SPY 30 Minute Chart Looking Back 2 Months

As you can see below price action has been wild. But for subscribers to my newsletter it has been a fun and exciting time having pocketed over 40% return from August 1st – up until today.

The point of this chart is to show you the basic market phases (Impulse, Uncertainty, and Corrective). Understanding how to identify each phase using momentum, price action, volume analysis and market sentiment is crucial for success in today’s volatile market. Once mastered you can trade virtually any investment with a high level of confidence, though I recommend mastering 3-4 investments at most and just trading those full time with pinpoint accuracy. Through my newsletter members learn exactly how to read the market and manage positions from my daily video market analysis, intraday updates, trade alerts and trading tips.

As you can see below I am anticipating weakness in the market over the next few days. Once those levels are reached or if the charts start hinting that a reversal back down is imminent I will be ready to take action using an inverse leveraged ETF.

Index ETF Trading Newsletter


Gold 30 Minutes Chart Looking Back 2 Months

This chart will piss some people off for sure… but the chart to me is still pointing to lower prices at this time. Until we get a breakout above the upper resistance level I am not bullish on gold. Keep in mind that during strong selloffs in the stock market almost all investment drop together (gold, silver, oil, stocks).

Gold ETF Trading Newsletter


German DAX Daily Chart Looking Back 3 years

This chart shows the long term chart of the DAX which I think is giving us some insight to a global market bottom in the coming months. You will notice I painted the phases over the chart and where I feel the market is trading and where it is headed looking forward.

Dax ETF Trading Newsletter


Dollar Index Daily Chart Looking Back 3 Years

The dollar also shows us three years for price action. If this strong rally continues in the dollar we will see lower stock and commodity prices for a few more months.

Dollar ETF Trading Newsletter

Trend Trading Idea Conclusion:

In short, I feel we have some very exciting times ahead along with huge potential trades starting to unfold. While I don’t want the market to collapse I will admit I prefer trading the short side of the market because fear is easier to trade than greed, not to mention prices drop much quicker than they rise… I’m sure you like making money fast also… J

I can email you my bi weekly reports and videos by joining my free newsletter here: www.GoldAndOilGuy.com

Chris Vermeulen

Over the past couple months everyone seems to have been preparing for a sharp market correction. Crazy part is that the SP500 dropped about 10% from the high and that is a typical bull market correction. The thing is… the stock market has a way of slowly unfolding making it look and feel minor, then before you know it, the correction is over and it’s back to an uptrend. That is kind of how this one unfolded.

The good news is that we caught the low risk portion of the correction locking in a 4.5% drop, and we are now in a long trade and in the money by 2.5% with very little down side risk at this point. Time will tell if this up trend is sustainable or not…

Now, let’s take a look at the charts…

Dollar 60 minute intraday chart
As you can see below the dollar looks to have started a breakdown today. If there is continued selling pressure in the next couple days then expect to stocks and commodities to move higher as the US Dollar drops. It is important to know that when a bullish pattern fails we typically see a very strong reaction in the opposite direction (down) catching the majority off guard and they rush to the door.

SPY Broad Market ETF – Daily Chart
A couple weeks ago we watched the market go into a free fall creating a washout bottom. From there we saw prices bounce back and retake my key moving averages. This gave us a bullish bias and dips should be looked at as buying opportunities. I will admit that stocks still have a long way to go before the masses are convinced. I feel we need to see the February and March highs get taken out first. Once they get taken out there should be strong buying as short covering (protective stops from traders who are short) causes a surge in buying pressure sending stocks sharply higher yet again.

My trading buddy David Banister at Active Trading Partners is starting to see small cap stocks come back to life. Money is starting to flow into these lucrative areas of the market and he is on top of things… This week’s trade is up 20% in less than 24 hours which is very exciting.

Gold Daily Chart
Gold has been moving up this year but the current price action is not really getting me excited to buy just yet. Recently we have seen strong selling volume and very light buying volume. My bias still favors higher prices but there is still a good chance we get another dip in the coming sessions.

Mid-Week Trading Conclusion:
In short, I feel as though the dollar will trigger the next wave of buying in stocks and commodities for the next week or two… We should see the dollar make a clean moving in either direction shortly and that will help guide my analysis, positions and setups. I hope this analysis helps you to see the market from a different perspective.

If you would like to get my mid-week reports free please join my free newsletter here: http://www.thegoldandoilguy.com/trade-money-emotions.php

Chris Vermeulen