The SP500 continued to rally and is pushing extreme overbought conditions today. Our net short ETF trading strategy on the SP500 is close to getting stopped out as the trend is on the verge of turning back up if sellers do not step in tomorrow. We are under water on this trade and unfortunately we lose when trends reverse as that is just part of trading. The trend remains down and we could get a miracle tomorrow to save the day. only time will tell.
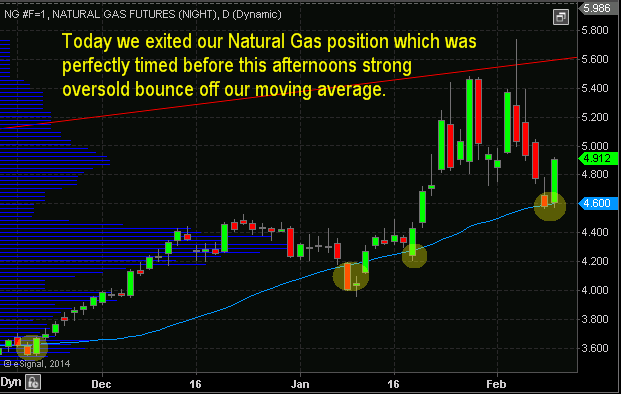
Natural Gas ETF Trading Strategies: This morning we closed out our natural gas trade for a big profit of roughly 18-20% depending where you entered and placed your stop. I have had a several emails from members wanting to add to their position yesterday, and another bunch today saying they still hold their position in natural gas cause they think price will continue to move in their favor. Technically, closing out our trade today was the proper thing to do. We followed our rules and the trade managed it’s self perfectly. While natural gas could continue to sell down in the long run, wanting to hold your position or add to a trade that is up 40% without any real pullbacks is the sign of a GREEDY trader. General rule is, if you do not take profits on a trade, the market will simply take them back, its that simple.
ETF Trading Strategy for DGAZ Pays out 20% return!
It looks as though precious metal miners and gold are having an impulse wave higher and have turned up. Silver remains in a down trend/basing pattern. I plan to get long this sector on the first pause or pullback. Though we could get long Silver tomorrow using one of our precious metals etf trading strategies.
Chris Vermeulen
https://thegoldandoilguy.com/wp-content/uploads/2014/02/natgasbounce.png394621adminhttp://www.thegoldandoilguy.com/wp-content/uploads/2014/11/tgaoglogo.pngadmin2014-02-11 16:39:322014-03-03 13:35:18ETF Trading Strategies for Gold, Silver, Miners and Natural Gas
We all know quantitative easing devalues the Dollar but contrary to that general statement it looks as though we could see the dollar index continue to rise for a few more weeks.
If we analyze the chart of the Dollar ETF (UUP) it is clear that the short term momentum has turned up. The break above the down trend line and recent bounce off support bodes well for the dollar index.
The bull flag chart pattern that has formed in the past month has a measured move price target of roughly $22.30. The level also happens to be a key pivot point on the chart along with high volume resistance.
I expect the dollar to continue to work its way higher over the next week or two with $22.30 being the line in the sand where sellers will jump on price and drive it back down, or at minimum force price to consolidate for a few days.
US Dollar ETF Trading Strategy – Daily Chart Analysis
So far this week we have been seeing fear creep in the equities market. This Wednesday we started to see fear (green indicator) reach a level which tells me to start looking for the market to bottoming. I do follow a few other charts and indicators which warn me of a possible trend reversal (high probability setup) before it takes place but the US Dollar and selling volume are key.
As we all know, when the market is trying to top and roll over it tends to be more of a process than a couple day event. It’s this lengthy topping process which has a lot of choppy price action sucking traders into a position much to early or shakes you out of the position before the market does what you anticipated. Knowing that tops tend to drag out for an extended period of time is critical for an options trader simple because of Theta (time decay)
On the flip side, bottoming is more of an event because it tends to happen after a strong wave of panic selling. Fear is the most powerful force in the market (other than the Fed/Manipulators.. but that’s another topic). That being said, when you know what to look for in bottoms you can generally see the market starting to bottom and prepare for it.
The charts below of the US Dollar Index and the SPY clearly show the inverse relationship they have. Right now it seems everything is directly connected with the dollar… it has been like that for most if the year… I will note that its not normally this clear. Anyways, the dollar is currently trading at resistance which means there is a good chance it will turn back down. So if the dollar drops, then it should boost the SPY (equities market) and put in a bottom for stocks.
Looking at the lower chart of the SPY etf you can see that recent prices have dropped down to a support zone. The important thing to note here is how selling volume is ramping up. This to me means more traders are getting worried and are cutting their losses or locking in gains before it gets worse. We typically see panic selling enter the market near the end of pullbacks. Just like in a bull market where the retail trader (John Doe) is the last to buy into a stock before it falls, it’s the same but flipped in a down trend. The retail trader is the last to panic and sell out of their position before the market bounces/rallies.
Currently the equities market looks to be showing signs that a bottom is nearing. Over the next session or two the rest of this equation should come to light as a tradable bottom or to start playing the down side of the market, only time will tell…
If you would like to learn more and get my trading alerts along with my pre-market morning videos so you know what to look for in the coming session I recommend taking up a subscription with my ETF trading newsletter here: www.TheGoldAndOilGuy.com
Chris Vermeulen
http://www.thegoldandoilguy.com/wp-content/uploads/2014/11/tgaoglogo.png00adminhttp://www.thegoldandoilguy.com/wp-content/uploads/2014/11/tgaoglogo.pngadmin2010-12-15 22:56:472014-03-10 08:40:31The Inverse Dollar Relationship, SPX and Fear
Wednesday’s session closed mixed on the day. The DOW posted a third of a percent gain while the tech sector closed down almost nine tenths of a percent. While technology stocks have been leading the market higher in the recent months, today they took the back seat while the DOW took control.
Take a look at the intraday chart of the SPY price action compared to the tech sector. It’s clear the tech stocks where not in favor today. Some tech stocks that really took a beating today were FFIV, NTAP, APKT and AKAM.
On another note, we are entering earning season and I am wondering if we are going to see a “Sell the New” type of thing again.
The broad market is experiencing a 36 day down cycle which has played a very dominant roll in the market this year. It topped out 9 days ago so we should expect sideways chop or some selling over the next 9 trading session. Because the market is trending up, pullbacks should be shallow.
The market continues to grind its way higher on relatively light volume. I have been waiting several weeks now for the volume to come back into the market but its just not happening. The majority of shares being traded are from banks, funds and day traders as the average investor’s not taking part because of the uncertainty looming. The lack of volume (commitment) to the market from the masses is making the market internals swing from one extreme to another on virtually weekly basis making it more difficult to take advantage of short term extreme sentiment levels.
The current market environment has traders shifting gears to more of a momentum trading strategy to take advantage of trends and this is what I am going to start implementing again as the market expands.
Market Conclusion:
In short, the equities market is in an up trend but looks to be overbought. Also with the downward cycle I don’t think the market will expand here and take off. Rather it will most likely chop around and burn off time until some earnings are released and the cycle bottoms. Unless we get a really sharp reversal down which we have yet to see on the SP500 or DOW, nibbling on small long positions or staying in cash is what I am doing right now.
As for gold, silver, the dollar and oil… Well the dollar continues to lose value on a daily basis which in turn is boosting metals along with crude oil. All four of those investments are over extended but they are trending and not really looking like they want to reverse just yet.
Get More Free Reports and Trade Ideas Here for Free: FREE SIGN-UP
http://www.thegoldandoilguy.com/wp-content/uploads/2014/11/tgaoglogo.png00adminhttp://www.thegoldandoilguy.com/wp-content/uploads/2014/11/tgaoglogo.pngadmin2010-10-06 23:41:042014-03-10 06:16:06Stock Market Leaders Are Now Lagging?
Wednesday May 26th
It’s been an exciting week for traders as volatility levels are through the roof and the broad market is moving up and down like a yoyo. You cannot take your eyes off the screen if you have a large amount of money invested as you can quickly find yourself with a large profit or loss in the matter of minutes….
Although we have seen stocks jump around the past few days precious metals have held strong with very little volatility. This is because of the economic fears looming for the US and other countries of possible financial collapse. This fear is helping to boost gold and silver prices because they are seen as the safe haven. Also we are seeing money move in the US dollar because the country is still seen as a leader in many ways helping to boost the US dollar.
Below are a couple charts on Gold and Silver ETF’s showing the end of last years rally and the correction in prices which are now looking to setting up for another leg higher.
GLD – Gold ETF Trading Vehicle – Daily Chart
I called this chart “The Golden Correction” because it literally is. We saw prices rally late in 2009 finishing off with a parabolic spike which we know is not sustainable and almost always results in a VERY sharp drop. This correction unfolded as planned with an ABC retrace which shakes out weak positions. We then we saw a reverse head & shoulders pattern form which again also shakes out weak positions. Once the neckline was broken from the reverse H & S the new up trend was started providing a couple trading opportunities for us along the way. The most recent low risk entry point can be seen on the chart as gold prices dropped back to a key support level.
Gold Futures Price – 60 Minute Day Trading Chart
Gold has been showing some very bullish price action the past week forming several mini bull flags with confirming volume levels. I think we should see gold pop another $5-10 bucks in the very near future if not continue higher for several days.
SLV – Silver ETF Trading Vehicle – Daily Chart
Silver formed much of the same patterns as gold but with much more volatility. Also silver has yet to break the 2009 high which is surprising but with a large part of silver being use for industrial purposes it does make sense as the economy is not as strong as it was thought to be in 2009. Silver carries much more risk when trading because it has more random moves and increased volatility.
Mid-Week Precious Metals Trading Conclusion:
In short, gold and silver are in an uptrend and looking strong. Both are currently trading at short term resistance levels on the daily chart which has caused them to stop moving up today (Wednesday May 26th) but on an intraday basis they look solid and could break though these resistance levels.
That being said buying way up here adds a lot more risk because a good chunk of the move has already been made and if prices do roll over and start heading back down the next support level is several percentage points away for placing a protective stop with the proper amount of wiggle room.
May 9, 2010
As we all know, last weeks stock market blip/mini crash was very emotional for those of you watching or trading it live. A lot of money changed hands last week and you either lost a bundle or made a bundle…
Below are my ETF charts for the commodities and index I actively follow and trade.
GLD – Gold Bullion ETF – Daily Chart
GLD is a great ETF to trade as it generates 10-20 quality low risk setups each year for subscribers. The chart clearly shows the large rally in late 2009 and the correction as it formed patterns moving from a down trend – base – and back to an uptrend.
$USD – US Dollar Index – Monthly Chart
This weekly chart I think shows some serious potential for gold and silver prices. The US Dollar is now trading at a key resistance level which I think it will have a tough time moving higher. The dollar has been moving up for several months and looks ready for a pullback or at least a pause. If the dollar starts to roll over in the next few months then we should see gold and silver move substantially higher.
SLV – Silver Bullion ETF – Daily Chart
Silver like gold bounced off a key support level last week as investors started to buy silver as a safe haven. Gold moved up sharply on the day of the intraday market crash while silver traded sideways for a day before joining the party. The following day investors starting buying up silver because it was lagging its big sister “yellow Gold”.
USO – Oil Fund – Daily Chart
Several weeks back I posted this chart showing how volume was drying up as oil tested resistance on declining volume. This indicated to us that once/if the price started to roll over it would trigger a sharp sell off as short term traders who bought in anticipation of a breakout to the up side sold out of their positions once support was broken. This is what caused the heavy volume and sharp price drop.
SPY – SP500 INDEX Trading ETF – Daily Chart It’s tougher now to read the index charts as last weeks heavy volume market crash could be seen in two very different ways…
One – We are starting a correction and had a jump start with the human error of selling billions of dollars worth of investments instead of millions prematurely pushing pulling the market down to a level where I think it should/will test again before moving up.
OR
Two – This extremely heavy sell off is just the start of what is to come…
Since the government owns the largest banks and the banks are unloading/selling massive amounts of shares calling it an error how do we know it’s not a scam for them to completely short the market in anticipation for a collapse which would make them unheard of amounts of money as the market drops… It is tough to trust anyone sitting up there in those power positions after everything they have been caught for already…
I personally think we could see lower prices in the coming month then the market will bottom and we will see new highs for 2010.
Weekend Commodity & Index ETF Trading Strategy Conclusion: Stepping back and looking at the above charts it looks as thought we could see stocks and commodities digest the recent moves. In short, gold and silver have rallied strong and now trading near resistance. Oil dropped last week and is now trading near a key support level. I feel it the market will trade sideways and stabilize before for a while as the SP500 had that crazy drop last week and now the market is in shock. I figured it would see 3-4 weeks to reach those prices yet it happened in 1 day so now the market could do very little for 3-4 weeks…
The US dollar is something we will be watching more closely because it’s trading at key resistance level. In the past it has taken a month or two for a rally to roll over and head back down. This could play out very nicely if the dollar tops and the rest of the market trends sideways to digest the recent moves. Once the dollar starts to fall it will provide fuel for the next rally in both stocks and commodities.
May 5th 2010
It has been an exciting couple weeks with the stock market slowly forming its top before breaking down this week. I have been warning everyone keep tightening your protective stops and to keep new positions small because once prices start to sell off they will most likely drop like a rock.
This week we have seen all the markets around the world breakdown and this indicates that there could be some large waves of selling in the near future. Traders and investors are very bullish on both stocks and commodities and financial market is designed to hurt the largest group of investors possible. So with over 53% of trader’s bullish and only 18% bearish (same readings as the Jan high) it makes for a perfect blood bath in the market catching the majority off guard left holding the shares.
Here is a chart of the SP500 ETF – SPY Daily Chart
You can see from simple analysis these repeated patterns in price and volume.
Video – Gold, Silver, Oil and SP500 Technical Analysis
I have put together a short video covering charts of gold, silver, oil and the broad market pointing out what we must watch for in the coming days or weeks.
Mid-Week Trading Conclusion:
The broad market is now in the middle of a trend reversal and during times like these we can see wild price swings in stocks and commodities making trading much more difficult. But a few more sessions and we should see things smooth out and provide some great shorting opportunities before the market starts to head back up to make new 2010 highs.
I would also like to let you in on a totally free offer ever for investors. Let me introduce you to The Market Toolbox.
My friends at Investing Systems offer a great piece of software called The Market Toolbox and it is a “desktop finance portal”. They have including more information, tools and resources than I have ever seen in a single piece of software.
http://www.thegoldandoilguy.com/wp-content/uploads/2014/11/tgaoglogo.png00adminhttp://www.thegoldandoilguy.com/wp-content/uploads/2014/11/tgaoglogo.pngadmin2010-05-05 20:34:372014-03-10 08:57:57The Moment of Truth Video for Gold, Silver, Oil & SP500
May 2, 2010
The past couple weeks we have seen sellers control the price of gold. This can be seen on the charts by the light volume drifts up then heavy volume sell selling sending this metal sharply lower. This type of price action provides some excellent intraday shorting opportunities.
On the other hand the SP500 has been doing quite the opposite providing some very profitable intraday buying opportunities for those who have the time to trade during the day.
Below I show a couple of low risk intraday trading opportunities which lasted a couple days providing massive gains, tiny down side risk and immediate price action. But what I think is about to happen in the next week or so will turn the tables with gold providing great buying opportunities and the SP500 with some great shorting opportunities, opposite to what is happening now.
Two Shorting Opportunities in Gold Making 210% Return in 3 Days
The fist two weeks of April gold had formed an excellent mini head & shoulders topping pattern. This is a pattern which I find very profitable when trading the intraday charts.
The first chart is of the 2 hour intraday gold chart spanning 25 days. On this chart gold had formed a mini head & shoulders topping pattern which day traders were able to take advantage of with very little risk.
Once the first wave of selling was finished and gold reached our price target of $1134, we exited our position and waited for another intraday setup. It was only a couple days later when gold has setup for another opportunity to short which an even more potential than the first trade as it had the possibility of dropping to the $1115 level. This would have provided a $40 move in gold washing the market of weak positions setting itself up for another big rally.
Our first price target was reached at $1147.7 where we took some profits and moved our stop to break-even (our entry price) for the balance of our position. Doing this guarantees the trades will be a winner no matter what happens. As you can see on the chart depending what investment type you trade you would have earned 2.6% – 210% return on your investment.
Gold’s Surprise Rally – Spain Was A Pain
Last week Spain was downgraded causing large selling pressure on the Euro as everyone sold the Euro and moved their money into a safer investment like the US Dollar and Gold. This sent both dramatically higher at the same time. The chart below shows the same 2 hour chart of gold but is zoomed out so you can see farther back and also the most recent rally in gold.
The red arrow on gold shows where gold was most likely to go in the coming days, but instead it rocketed higher on the Euro-land news hitting the wires. Most of the price advance happened within the first 4 hours and since then the price has drifted sideways and grinded its way a little higher.
SP500 Buying Opportunity Makes 135% Gain in 3 Days
During the day on Wednesday I had low risk entry point for day traders on the SP500. The setup is simple really. Tuesday’s panic selling sent the market tumbling in a very short period of time putting the market in an oversold condition. A condition like this provides excellent low risk/instant price movement type of setup.
Take a look at the volume on the chart… Volume on the ES Mini SP Futures contract was not very heavy during the sell offs. But the days following shows strong buying volume indicating big money was buying up stocks at these discounted prices. This is great to see.
60 Minute SP500 Trading Chart
As you can see from the chart below Tuesday’s heavy volume sell off was an almost straight drop. That type of move generally provides a trad-able bounce or drift higher within a few days which tests the level were prices started to drop originally (the breakdown level).
The price of the SP500 drifted up into resistance with declining volume meaning traders are not willing to pay the higher price for the index. This is a sign of weakness and worked out perfectly with our price target of $1205-1206 at which point we took money off the table and moved our stop up to lock in some solid gains if the market did in fact reverse back down after reaching the key resistance level.
Gold & SP500 Trading Conclusion:
Some very exciting times lie ahead as I feel gold and the SP500 are changing short term trend directions. Gold which was down the past month is now headed higher as we are looking for low volume pullbacks to take long positions.
And the SP500 looks ready to take a swan dive to correct/digest some of the monster rally it has put in since the February low. With any luck we will get a nice shorting opportunity to catch some of the move down and then we should be setup for another large rally.
In short, we are looking for gold to dip to enter long and the SP500 to breakdown this week then form a low volume bounce/drift into a resistance level which we will try to short once the bounce loses its upward momentum. I feel we will have a bunch of day trades in the near future along with some great swing trades at the key turning points.
December 9th, 2009
Etf trading has made it so easy for traders and investors to get maximum exposure to the entire market without the high fees of mutual funds and manager. There are now etfs covering almost every investment type whether it’s stocks, indexes, sectors, commodities, bonds, real estate, currencies etc…
In this short report I will quickly show a few charts on what is happening for precious metals and energy.
HUI – Gold Stock
This monthly chart of the gold stocks index you can see how easy it is to trade the market and avoid large sell offs when using technical analysis. Currently gold stocks are in a bull market, testing the 2008 highs. Until we are proven wrong buying stocks after a pullback is a winning strategy.
Gold Stocks Trading
Trading the GLD ETF
We have been in the GLD etf for a few months as we ride this bull to new highs. This chart clearly shows how buying dips in a bull market can really pay off. I do have certain criteria which must be met before buying dips so I know the odds are in my favor.
Gold ETF Alert
ETF Trade Silver
Silver along with gold and oil are looking ready for an oversold bounce. I don’t think prices will jump and rally higher right out of the gate but eventually I feel the will head higher.
SLV Trading Newsletter
Crude Oil Fund Trade
Crude oil looks prime for the picking. It is currently oversold and testing 2 support levels. The downside momentum is still strong so this selling could last another 1-2 days but I’m expecting it to soon.
This is not a low risk setup. This is more of a short term aggressive contrarian play. For those of you who like heart pounding plays ?
USO Fund Trade
Natural Gas Fund Chart
Natural gas has been taking its time to bottom. Virtually every bottom picker has been burned this year. I am starting to hear everyone get more bearish on it again which is great! It should bottom any day then! LOL….
Seriously it cannot get much more bearish for gas. We don’t have enough space to store it and companies are finding more natural gas in the ground every day. Because it sounds like a terrible investment it must be getting close to a bottom. If this is the start of a flat basing pattern, then I expect it could drag out for a few months before actually making a nice move up.
UNG Nat Gas Trend
Dow Jones DIA ETF
The Dow looks similar to gold and silver. I feel we are ready for a 1-2 day bounce then we go a little lower to shake traders out of the market before heading higher.
DIA ETF Trading
ETF Trading Conclusion:
Gold stocks and the broad market are in a bull market. The recent pullback has many traders worried. I think this an opportunity to bet into some positions before the next rally. Buying the dips in a bull market is a low risk trade until proven wrong. I think we still have more of a pullback yet but then we could have a very profitable year end Xmas rally.
Natural Gas is just bumping along bottom I think. Not expecting any trade for a few weeks anyways.
Crude Oil looks like its ready for a move whether it is a 1-2 day bounce or the start of a new leg higher. If you loot at late Sept you can see USO broke down on heavy volume shaking most traders out of their positions just before the next leg higher, and this is what I feel it is doing now. Only time will tell.
Let’s see how the second half of this week unfolds.
http://www.thegoldandoilguy.com/wp-content/uploads/2014/11/tgaoglogo.png00adminhttp://www.thegoldandoilguy.com/wp-content/uploads/2014/11/tgaoglogo.pngadmin2009-12-09 23:23:572014-03-10 10:48:54ETF Trading Gold Oil and the Index