Posts

The energy sector has surged during the last two months which can be seen by looking at the XLE Energy Select Sector Fund. If crude oil continues to climb to the $112 level, XLE will likely continue to rally for another few days or possibly week as energy stocks are considered a leveraged way to play energy price movements.

Another way to look at this info is through the USO United States Oil Fund. This tracks much closer to the price of oil. The only issue is that many ETFs that “try to track” an underlying commodity is in how the funds are built. They own multiple contracts further into the future which does not exactly provide us with the short term news/event driven price movements in the current front month contract as they should.

What does this mumbo jumbo mean? Well, it means funds like USO and the highly respected UNG, and VIX ETFs… (just joking about the highly respected part), fail to track the underlying commodity or index very well when it comes to short term price movements. This means, you can nail the timing of a trade, and the commodity or index will move in your favor, yet your fund loses money, or goes nowhere…

Let’s Focus on the Technicals Now…

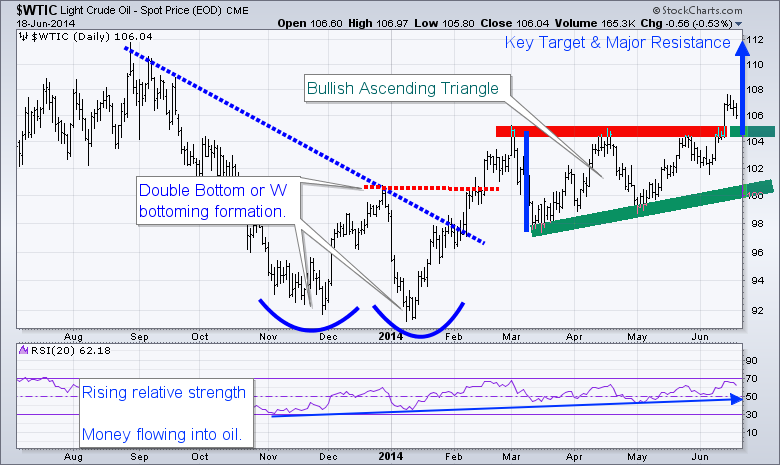
WTI crude oil has formed a bullish ascending triangle pattern from March to May of this year. The breakout to the upside is bullish and should be traded that way until the chart says otherwise. This breakout and first pullback must hold, or I will consider it a failed breakout. So if price dips and closes 2 days below the breakout level, it will be a major negative for oil in my opinion.

The range of the ascending triangle provides us with a measured move to the upside which is $112. Typically the first pullback after a breakout can be bought. The first short term target to scalp some gains would be $109, and at that point moving your stop to breakeven is a wise decision. Trading is all about managing capital and risk, if you don’t, then the market will take advantage of your lack in discipline.

Looking further back on the chart, you can see the double bottom formation also known as a “W” formation. Once the high of the “W” formation is broken the trend should be considered neural or up.

Also note that the RSI (relative strength) has been trending higher for some time now. This means money is rotating into this commodity. This is in line with my interview this week with Kerry Lutz and my recent article talking about the next bull market in commodities and the TSX (Toronto Stock Exchange).

clfutures

WTI Crude Oil Trading Conclusion:

In short, oil has some extra risk around it. The recent move has been partly fueled by news overseas. So at any time oil could get a lift or take a hit by news that hits the wires. I tent to trade news related events with much less capital than I normally do because of this risk.

Happy Trading!

WANT MORE TRADE IDEAS?
GET THEM HERE: WWW.THEGOLDANDOILGUY.COM


Chris Vermeulen
CEO & Founder
AlgoTrades.net
TheGoldAndOilGuy.com


Commodities in general have been under pressure for the last couple years. This can be seen by looking at the GCC Greenhaven Continuous Commodity ETF which holds a basket of resources.

The weekly chart has formed a bullish bottom pattern, and as of last January it looks as though it’s now building a basing pattern. Overall commodities are in the very early stages of a stage 1 basing pattern and it looks as though it will be a few more months before any significant breakout will occur. But there could be some early entry points if you know what to look for…

A few days ago I talked about how commodities tend to perform well near the end of a bull market in the United States stock market. I also pointed out which hot index was going to benefit from this.

Read Commodity Index Report: http://www.gold-eagle.com/article/gold-and-oil-fuel-canadian-stock-market-rally

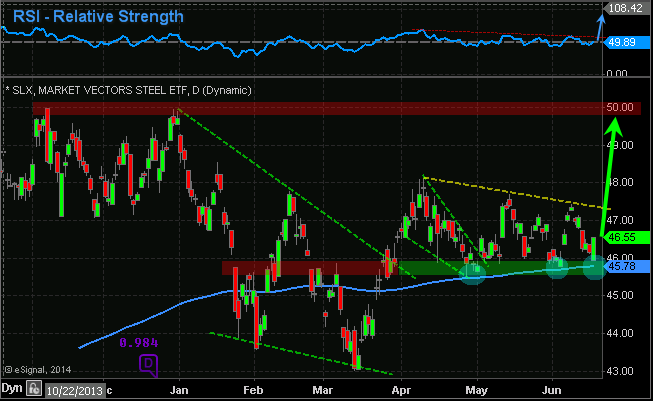
In this article I want to bring your attention to the steel market. Using the SLX Steel ETF you can clearly see the bottoming pattern and basing pattern for this commodity.

Currently steel is underperforming the stock market and is vulnerable to lower prices. But if we see a few things come together in the coming days or weeks, this could be a screaming buy.

My technical take on steel is this:

SLX has formed a bottoming pattern from January – mid March. It has since put in a strong impulse rally to make a higher high, and is now consolidating above key support. The RSI (Relative Strength) remains in a down trend, but if this starts to rise and SLX breaks above its recent highs around the $47.75 level I feel steel will start to rally with $50 being the next major whole number and previous high for steel to find some resistance.

Also price has been riding along the 200 day moving average which is acting as support. If price closes a couple of days below the 200 moving average I would consider this to be a bearish sign.

SLX

Steel Trading Conclusion:

In short, we are looking for the relative strength to start making new highs. Also we want to see a reversal bar on the SLX chart to the upside which we got on Tuesday. Or you can wait for a breakout and close above $47-48 area. Stop would be somewhere around the $45.75 area to start, then raise it as price rallies using intraday pivot lows on the 30 minute chart.

GET THESE REPORTS DELIVERED TO YOUR INBOX FREE: www.GoldAndOilGuy.com

Chris Vermeulen
Disclaimer: I do not own shares of TAN as this point, but may buy some in the near future.


During the past couple months several indexes, sectors and commodities have sold off more than 10 – 20%. But now some are looking like new buying opportunities. Over the next week I will bring a few of these trades to your attention as they start to unfold.

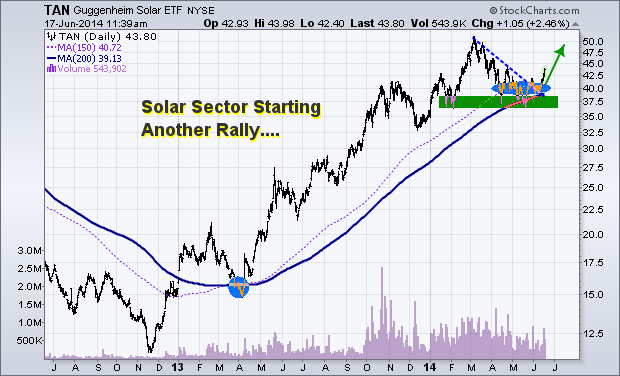
Today we are looking at the TAN solar ETF. This sector recently had a 23% hair cut in price. A 20-25% correction in price is a typical intermediate correction for a fast moving sector. The price correction has pulled the sector down to its 150 and 200 simple day moving averages. These levels tend to act as long term support for investors, a buying point.

Many of the individual stocks within this sector are starting to pop and breakout of bullish price patterns. These individual stock prices point to higher prices for TAN going forward.

Be aware of crude oil…. I do think that as long as the price of crude oil stays up solar stocks will continue to rise overall. But if oil starts to roll over and break down, TAN will struggle.

My Technical Take on The Chart:

Big picture analysis shows a powerful uptrend with bullish consolidation.

Intermediate analysis shows a falling bullish wedge, test of moving averages, and a reversal breakout pattern.

tan

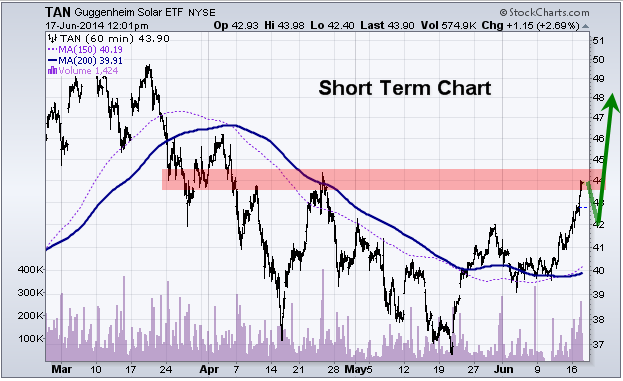
Short term analysis shows we are at a resistance level and we will likely see a pause of pullback over the next few days before it goes higher.

TANshortterm

TAN Trading Conclusion:

If price closed back below the $39.00 I would consider this bounce/rally failed.

Get My Trade Ideas Delivered To Your Inbox FREE: www.GoldAndOilGuy.com

Chris Vermeulen

Disclaimer: I do not own shares of TAN as this point, but may buy some in the near future.

It looks as though the Nasdaq is about ready for another leg lower. Watch these key resistance levels for a short trade this week.

Get These Trade Alerts Every Week with my ETF Trading Newsletter

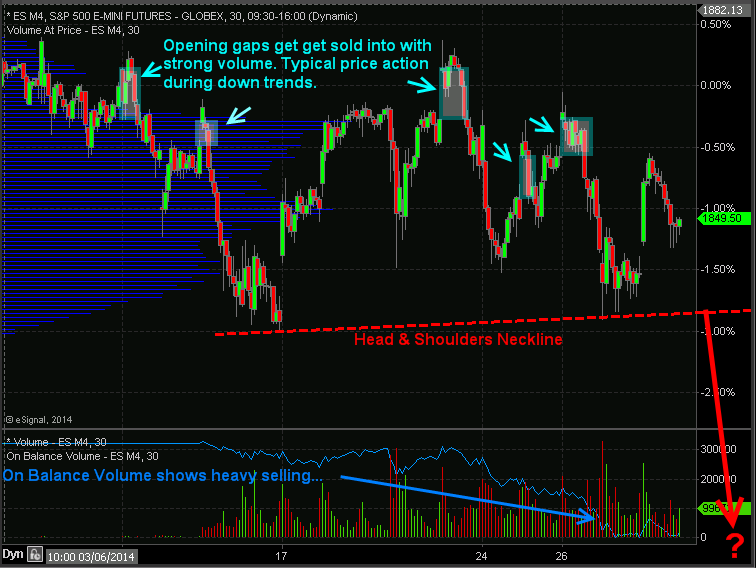
Index ETF Trading Strategies: Stocks have kick started this week with a 0.85% pop in price but the big question is if the market can hold up. Last week stocks repeatedly gap higher and sold off with strong volume telling us that institutions are slowing phasing out of stocks (distribution selling) unloading shares into strength and passing them onto the a average investor to be left holding bag.

I want to show you a couple charts which show the price action, volume and money flow of the SP500 so you have a visual of what I am talking about.

30 Minute Intraday SP500 Chart – ETF Trading Strategies

In the chart below you can see the price gaps followed by selling. Why is this important? It is important because during a down trend the market makers and big money plays who have the money and tools to manipulate the markets will allow the market drift higher or they will run price up in overnight or premarket trading when volume is light. Once the 9:30am ET opening bell rings volume and liquidity spike which allows the big money player to sell remaining long positions and or add to short positions they have.

If you look at the blue on balance volume line at the bottom of the chart you can clearly see that more contracts are being sold than bought which is typically an early warning sign that the market is about to fall farther.

ETF Trading Strategies


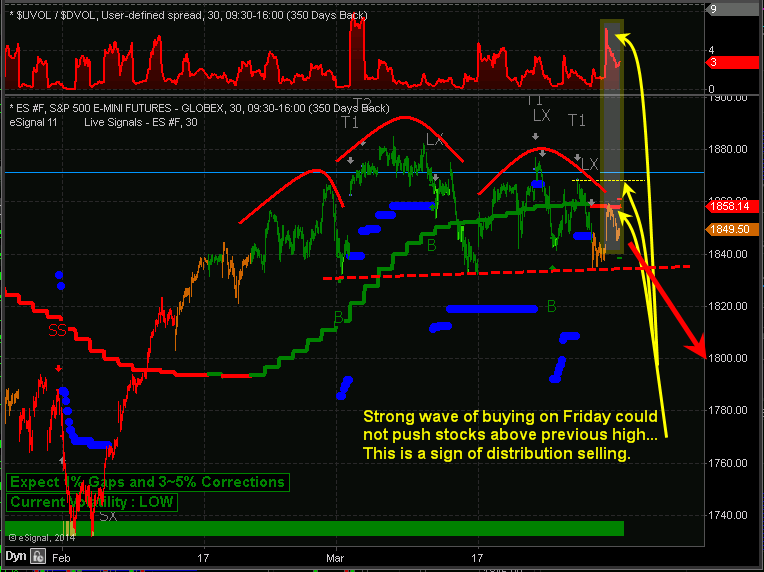
Automated Trading System – 30 Minute ES Futures Chart

Below is a marked up screen shot of my automated trading system which I use for timing both futures and ETF trading strategies. The color coded bars tell you the market trend along with the strength of buyers and sellers.

When you couple market cycles, trends, volume/money flow, along with chart patterns we can forecast and trade markets with a high degree of accuracy in terms of market direction and timing. Ross Clark & I talk about cycle analysis, market stages etc… which you can listen to live here: http://talkdigitalnetwork.com/2014/03/this-week-in-money-129/

Automated Trading Systems


My Index ETF Trading Strategies Conclusion:

My Personal Trading Strategies Book

Just to be clear on the current market trend and my overall outlook let me explain a little more. Overall, the broad stock market remains in an uptrend. Thursday and Friday of last week we started getting orange bars on the chart telling us that cycles, volume, and momentum are now neutral. It’s 50/50 on which way the market will go from here, so until the market internals (cycles, volume, breadth) push the odds in our favor enough for a short sell trade or a new long entry we will not add new positions to our portfolio.

It is important to understand that nearly 75% of stocks/investments move with the broad market. So we don’t want to add more long positions when the odds are not in favor of higher prices. Trading in general is not hard to do, but creating, following, executing properly money and position management is. If you have trouble with following or creating an ETF trading strategy you can have my ETF trading system for rising, falling and sideways markets traded automatically in your trading account.

Learn more here about my Automated Trading Systems

Chris Vermeulen
www.TheGoldAndOilGuy.com
www.AlgoTrades.net

Over the years working with professional traders I found it interesting how each individual has their bellwether stock they follow to gauge the stock markets trend and identify reversals before they take place.

About 10 years ago I traded with a floor trader who swore that whatever GS (Goldman Sachs) did the market followed. Another said he only used XOM (Exxon Mobile), while Stan Weinstein says GM (General Motors) was the stock to follow.

While each of these traders have been highly successful with their bellwether stock, I wanted to cover these in more detail and show you have to get the best of each of their strategies working for you. This will help you properly time the market, identify the overall market health and at which point you should be getting long or short stocks in your portfolio.

Watch this quick video below:

If you would like to successfully trade both bull and bear markets then join my trading and investing newsletter today and catch the next hot sectors for 2014 using my ETF Trading Strategies.

Chris Vermeulen
www.TheGoldAndOilGuy.com

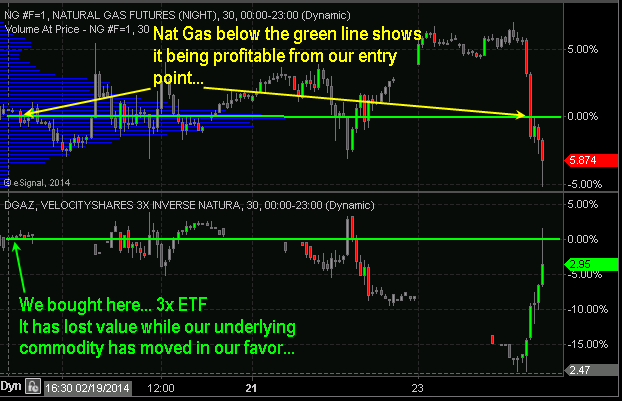
Here is a perfect example showing how 3x leveraged ETF funds can lose value over a short period of time while the underlying investment is deep in our favor by 5% and should have our ETF in our favor by 15%). But instead we are under water by a few percent still…


This is a prime example of why I don’t trade 3x ETFs that often. And when you actually run the numbers on how much leverage you actually get with 3x ETFs its actually the same or less than if you just bought a single ETF with the same amount of capital and margin… 3X ETFs require you to have 90% margin, while a single ETF only requires you 30%. It’s a little complicated to crunch the numbers and explain but know that 3x ETFs are nothing special when you do the math for both long term and short term trades.

For example, if you wanted to buy $1000 worth of a 3x ETF, the margin requirements on these fund are 90% meaning you must have $900 in your MARGIN account to trade this position. But if you wanted to trade say a single ETF where the margin is only say 30% for a non levegeage fund, you can technically trade the same position size with the same amount of money WITHOUT the 3x leveraged fund price decay we all know is terrible in these highly leveraged funds.

So if you wanted a position to match the power of the $1000 3x leveraged ETF position but using the single ETF, you would only need to buy $3000 worth of the single ETF, but because its only 30% margin requirement. This may be confusing, the only point im trying to make here is that you can get almost the same trade using a single ETF simply because of the margin requirements between the two types of ETF funds. Most individuals do not realize the crazy margin required for 3x ETFs and its likely the reason most traders get margin calls with trading these funds.

Long story short, if today’s price action is a reversal day it will only take another big down day for us to be deep in the money on our inverse ETFs.


The Next Trading Session Is another Big Sell Off in our Favor – Current Live Trade

This is a continuation of yesterday’s post talking about how we needed another big down day for the ETF catch up to the natural gas price action.

Today Nat Gas is down another 10% and has sent our 3x leveraged ETF fund deep in the money with subscribers traded up over 18% in only a couple trading sessions.

ng-3x 3x leveraged etf fund trading

​We continue to hold our remaining 1/3rd of our position in DGAZ with a stop 5% in the money in case price reverses hard today or this week.

Chris Vermeulen – www.TheGoldAndOilGuy.com


It was another wild session…

The SP500 continued to rally and is pushing extreme overbought conditions today. Our net short ETF trading strategy on the SP500 is close to getting stopped out as the trend is on the verge of turning back up if sellers do not step in tomorrow. We are under water on this trade and unfortunately we lose when trends reverse as that is just part of trading. The trend remains down and we could get a miracle tomorrow to save the day. only time will tell.

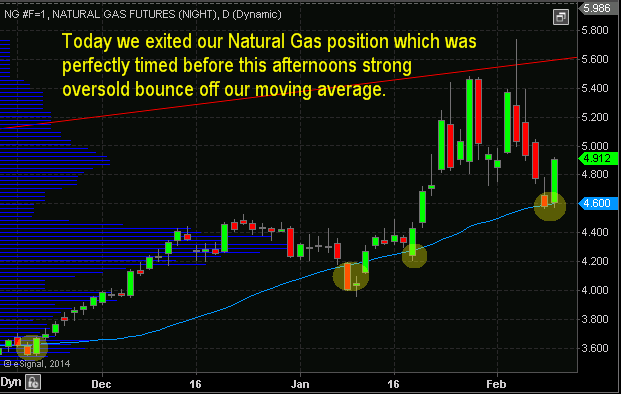
Natural Gas ETF Trading Strategies: This morning we closed out our natural gas trade for a big profit of roughly 18-20% depending where you entered and placed your stop. I have had a several emails from members wanting to add to their position yesterday, and another bunch today saying they still hold their position in natural gas cause they think price will continue to move in their favor. Technically, closing out our trade today was the proper thing to do. We followed our rules and the trade managed it’s self perfectly. While natural gas could continue to sell down in the long run, wanting to hold your position or add to a trade that is up 40% without any real pullbacks is the sign of a GREEDY trader.  General rule is, if you do not take profits on a trade, the market will simply take them back, its that simple.

ETF Trading Strategy for DGAZ Pays out 20% return!

ETF Trading Strategies

It looks as though precious metal miners and gold are having an impulse wave higher and have turned up. Silver remains in a down trend/basing pattern. I plan to get long this sector on the first pause or pullback. Though we could get long Silver tomorrow using one of our precious metals etf trading strategies.

Chris Vermeulen

I apologize now for the Christmas colored charts below… Its a lot of red and green but these are the most understood colors for knowing what ranges means (bullish or bearish).

This was a very emotion week for traders. The strong selling Thursday and Friday has traders and investors running for the door and panicking out of positions. While I did close out our long SP500 swing trading on Thursday to lock in a profitable trade, I do feel as though we can re-enter next week a better price.

The only ones feeling pain today are those who do not have enough self-discipline to create rules and trade by them. Again this is talked about in GREAT DETAIL in my new book. If this is you, I recommend buying my book and reading it this weekend as it’s a quick and simple read. There is a paperback version or instant PDF download available: Get Book.

Without self-discipline no amount of courses are trading services will make you a successful trader.

Let’s get technical and jump into the charts…


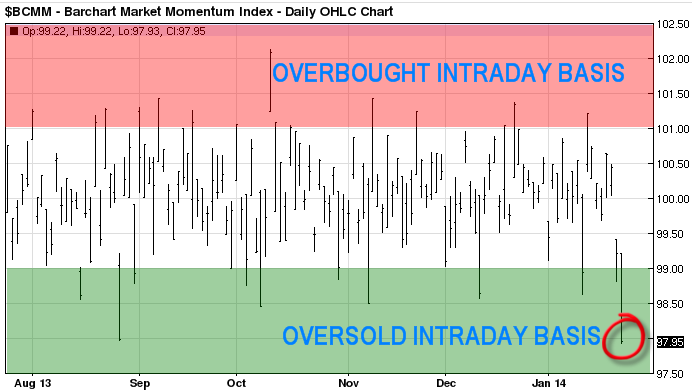
Momentum Index – The Intraday Extreme Overbought/sold indicator

This is an indicator I follow daily to understand how strong the selling is. If it is broad based or sector related. The last two sessions clearly shows is broad based and that the market has moved to quickly in one direction and is primed for a knee jerk reaction bounce.

oversold1


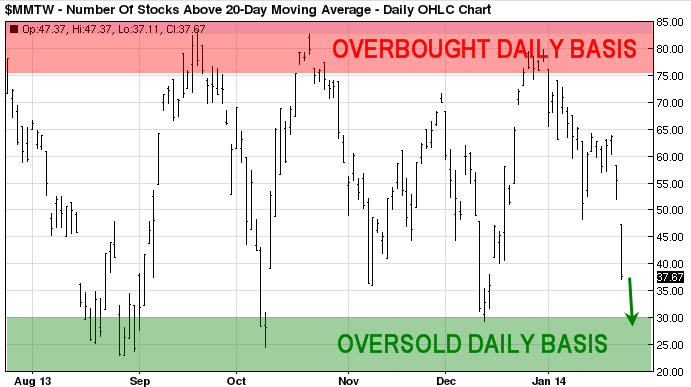
Swing Trading Cycles : 3-8 Weekly Overbought/Sold Market Cycles

This is a fantastic tool for timing key pivot lows and highs in the broad market. We are nearing another key pivot low but there is still room for more selling next week.

oversold2


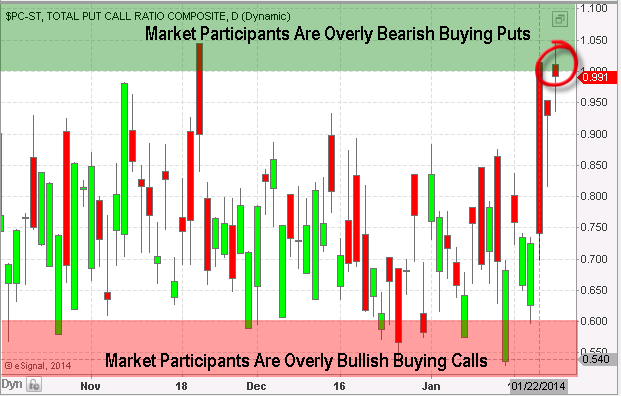
Options Traders Are Fearful of Continued Selling

If you don’t know what the put/call ratio is, in simple terms it tells us when the majority of traders are buying put options (expecting stocks to fall, ratio of 1.0+), and when they are overly bullish (expecting stocks to rise, ratio below 0.60).

The chart below shows everyone is leaning towards more selling in the stock market. I use this as a contrarian indicator.

PCRatio


The Fear Trade – Shorting Fear with an Instrument that Naturally Loses Value: VXX

There is a lot of interesting way to trade the stock market and once way it through shorting the VXX ETF during bull markets. Instead of buying a long position in stocks, you could simply short the VXX fund. This thing loses value over time because of the way it’s managed/constructed. So logic says, shorting it on bounces can be very rewarding during times when fear is high.

Keep in mind this fund and its underlying index moves FAST with 20-30% percent swings… Trade small position sizes if you ever touch this thing…


Weekly Technical Trading Report Conclusion:

In short, (pardon the pun) I feel the stock market is setting up for another big bounce. The technicals and longer term trend remains bullish. I trade with the trend until proven wrong. Only then will I change the direction and trade with the new trend.

Get These Reports Free Each Week: www.GoldAndOilGuy.com

Chris Vermeulen
Algorithmic Trader