It looks as though the Nasdaq is about ready for another leg lower. Watch these key resistance levels for a short trade this week.
Get These Trade Alerts Every Week with my ETF Trading Newsletter

It looks as though the Nasdaq is about ready for another leg lower. Watch these key resistance levels for a short trade this week.
Get These Trade Alerts Every Week with my ETF Trading Newsletter
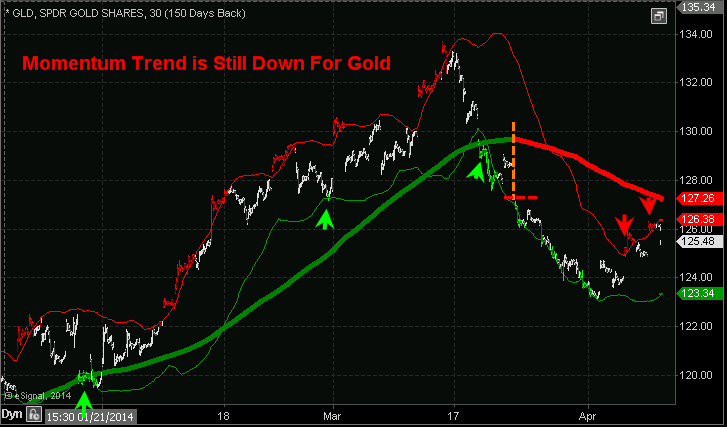
I did a short video a while back on momentum trading gold and wanted to share it and post it in the members area of the website for you to view. It’s short and basic, but useful.
Current snap shot of gold trend…
Chris Vermeulen
ETF Trading Newsletter: In early February I started watching the CORN ETF very closely for a possible new bull market starting and a long entry point. Many of the other commodities had already posted strong rallies while corn sat on the side lines.
The Corn ETF is designed to follow the price of the continuous corn futures contracts. This commodity looked as though it was forming a base (launch pad) for the new rally and possible major bull market to start.
This post walks you through each step of the way from entering the Corn ETF trade, adding to a winning position, tightening our stops, locking in partial profits at our first price target etc.. In fact myself and subscribers are still long the Corn ETF as of today with my ETF trading newsletter.
________________________________________
We have been watching the commodities index rally for a few weeks now with natural gas, coffee, sugar, gold, silver and several others jump in price. We have been watching the GCC ETF which is a basket of several commodities to get a feel for the commodities market as a whole.
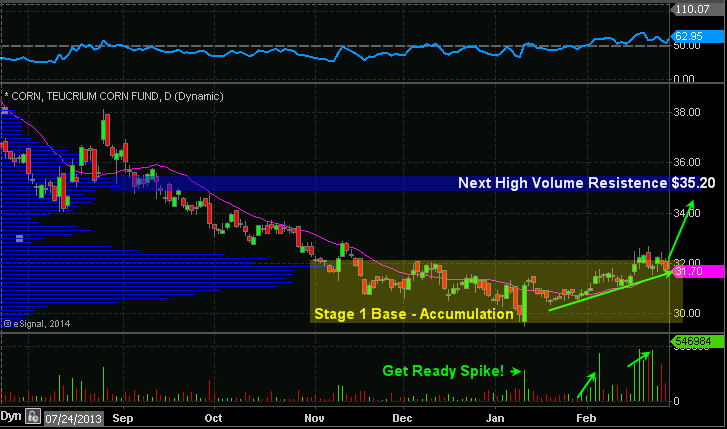
While most of the commodities have posted some solid gains, CORN has yet to pop in price. Corn looks to be forming a stage 1 basing pattern and the volume/money flowing into this fund suggest new money is moving into corn because it looks as though it will be the last to pop and rally in price.
This is similar to how we entered the silver trade a few weeks back. Everything else in the precious metals sector popped and silver lagged giving us a high probability setup.
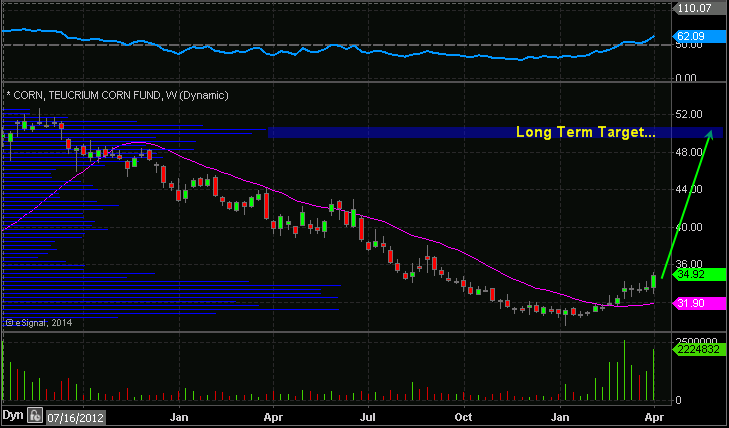
Both the short and long term the charts of corn look bullish. As usual I will lock in some gains if we get a pop in the commodity, then let the balance ride with a break even stop. If corn is entering a new bull market phase (Stage 2) I want to hold some long term. There is potential for a 19%-30% rise in value.
Corn Trade Information:
Buy CORN etf, Stop $29.90, Downside Risk 6%, Portfolio Size 6%
________________________________________
New CORN Trade Order Pending
During the past couple weeks we have seen the CORN ETF trade sideways with fading volume. Recently we have seen a couple strong buying days in CORN which I call GET-READY spikes. These typically indicate some big money (insiders) are accumulating a position ahead of good news.
We are currently long CORN already and in the money, which is why I like this second setup even more. Because we already have a profit buffer, making the risk here is lower than normal. If you have ready some of the market wizard books you will also pickup on how the most successful traders pyramid up (average up) in winning trades.
My Plan Of Attack: I only want to buy on strength here focusing on entering the trade once is breaks a previous pivot high which in this case is: $34.06
Trade Setup:
Place a Buy-Stop order at $34.06, GTC (Good Till Canceled), 8% of portfolio position size
This type of order will enter you into the trade if price rallies and breaks that price point so you do not need to sit around and watch the charts. If you do not know this type of order just Google it only or call your broker. It is a very simple and basic order type.
________________________________________
CORN Position Added
This afternoon our CORN trade order was executed. Yesterday we set a Buy-Stop order so we get entered the commodity if price starts to breakout to the upside. These types of order are just like a stop order in respect that you just enter it and the market and broker do all the work after that.
This is why trading with a plan/strategy is much easier and less stressful. If you have a plan, do the leg work and execute it, things do not seem difficult or stressful. Problem is most traders don’t have a plan and even if they do, most times they don’t follow it. The result is a confused, stressed out trader/investor second guessing their every move.
I have updated the portfolio in the member’s area so you can review positions and protective stops.
________________________________________
CORN Position Adjustment – Locking in Gains
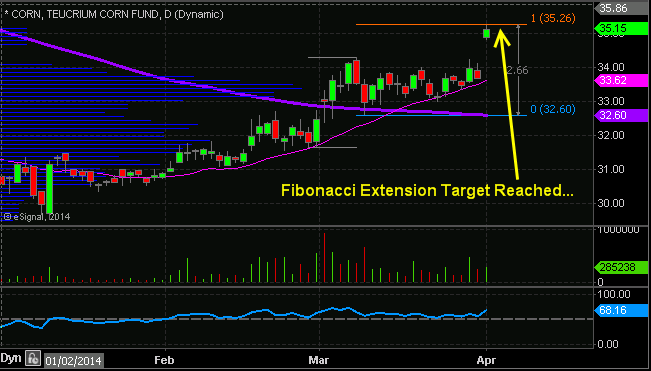
CORN has been moving in our favor for about a month now. Today’s pop in price has reached my short term measured move using fibonacci extensions and I feel it is time to lock in some gains and move our protective stop to breakeven.
We entered this position twice and your average price per share should be around $32.96.
I am moving my stop to breakeven and selling half of my position today. Current price is $35.10, as we are up 6.5%.
See chart below for a visual:
________________________________________
You know it and I know it, trading is extremely difficult, time consuming and can be expensive if not done properly. What I have shown you above is verbatim of what subscribers to my ETF Trading Newsletter received thus far for the corn trade.
I do updated and show the charts live each day in my daily video forecast which members have access to but that is just to keep everyone up to speed on the trade to help manage their emotions and prepare for what it to happen before it happens.
Consider joining my group of happy traders today at www.TheGoldAndOilGuy.com
Consider joining my group of happy traders today at www.TheGoldAndOilGuy.com
Chris Vermeulen

 Ross Clark has specialized in technical analysis of the markets since the 1970’s. As a charter member of CompuTrac and then user of TradeStation he has developed trading programs and proprietary indicators. It is his belief that market timing and shifts in asset allocation can add value to investment portfolios.
Ross and Chris talk about technical trading mastery and Vermeulen’s New Book that covers exciting topics like cycle analysis and automated trading systems in a live radio broadcast last week which is now available online.
LISTEN HERE: http://talkdigitalnetwork.com/2014/03/this-week-in-money-129/
Chris Vermeulen – ETF Trading Newsletter
The bitter truth about what may happen to gold is not all that exciting and likely don’t want to know, but you need to understand what is unfolding as we speak…
Long story short, the prices of bonds look as though they are about to rally once again. Mounting fears of a stock market correction has money flowing into bonds which in turn will drive interest yields lower yet gain. But the BIG PICTURE of what he FED said the other week about how they plan to raise rates in 2015 and cut QE down to $55 billion per month hurts the long term outlook for gold.
This news may not sound that important, it actually is and undermines the price of miners, silver and gold in a big way.
Find out why gold is falling and the threat that could trigger a much larger meltdown in the long run with my gold forecast video.

Chris Vermeulen
ETF Trading Newsletter
As we all know, there is always a bull market somewhere…
In this video report I will share with you the next three big investments for 2014 which are unfolding as we you read this. And Precious metals (gold, silver & miners) are only one of the bull markets…
You have not heard anything about these sectors on CNBC, radio, and no one is writing about them. Because of this, it has me really excited because the more people that are caught off guard with a move the bigger upside potential there is.
All you have to do is watch the video to find out…
Watch Video Now:
Get All My Trades and Investments with my ETF Trading Newsletter
Chris Vermeulen
www.TheGoldAndOilGuy.com
Over the years working with professional traders I found it interesting how each individual has their bellwether stock they follow to gauge the stock markets trend and identify reversals before they take place.
About 10 years ago I traded with a floor trader who swore that whatever GS (Goldman Sachs) did the market followed. Another said he only used XOM (Exxon Mobile), while Stan Weinstein says GM (General Motors) was the stock to follow.
While each of these traders have been highly successful with their bellwether stock, I wanted to cover these in more detail and show you have to get the best of each of their strategies working for you. This will help you properly time the market, identify the overall market health and at which point you should be getting long or short stocks in your portfolio.
Watch this quick video below:
If you would like to successfully trade both bull and bear markets then join my trading and investing newsletter today and catch the next hot sectors for 2014 using my ETF Trading Strategies.
Chris Vermeulen
www.TheGoldAndOilGuy.com
Here is a perfect example showing how 3x leveraged ETF funds can lose value over a short period of time while the underlying investment is deep in our favor by 5% and should have our ETF in our favor by 15%). But instead we are under water by a few percent still…
This is a prime example of why I don’t trade 3x ETFs that often. And when you actually run the numbers on how much leverage you actually get with 3x ETFs its actually the same or less than if you just bought a single ETF with the same amount of capital and margin… 3X ETFs require you to have 90% margin, while a single ETF only requires you 30%. It’s a little complicated to crunch the numbers and explain but know that 3x ETFs are nothing special when you do the math for both long term and short term trades.
For example, if you wanted to buy $1000 worth of a 3x ETF, the margin requirements on these fund are 90% meaning you must have $900 in your MARGIN account to trade this position. But if you wanted to trade say a single ETF where the margin is only say 30% for a non levegeage fund, you can technically trade the same position size with the same amount of money WITHOUT the 3x leveraged fund price decay we all know is terrible in these highly leveraged funds.
So if you wanted a position to match the power of the $1000 3x leveraged ETF position but using the single ETF, you would only need to buy $3000 worth of the single ETF, but because its only 30% margin requirement. This may be confusing, the only point im trying to make here is that you can get almost the same trade using a single ETF simply because of the margin requirements between the two types of ETF funds. Most individuals do not realize the crazy margin required for 3x ETFs and its likely the reason most traders get margin calls with trading these funds.
Long story short, if today’s price action is a reversal day it will only take another big down day for us to be deep in the money on our inverse ETFs.
This is a continuation of yesterday’s post talking about how we needed another big down day for the ETF catch up to the natural gas price action.
Today Nat Gas is down another 10% and has sent our 3x leveraged ETF fund deep in the money with subscribers traded up over 18% in only a couple trading sessions.
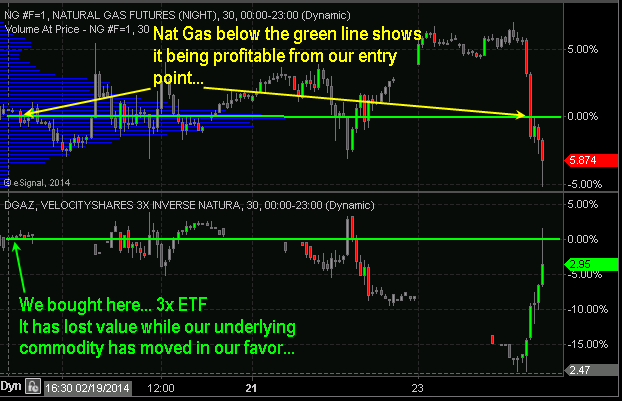
We continue to hold our remaining 1/3rd of our position in DGAZ with a stop 5% in the money in case price reverses hard today or this week.
Chris Vermeulen – www.TheGoldAndOilGuy.com
Stock market continue its momentum from yesterday but struggled to climb. More weak comments from Fed Chair nominee Janet Yellen suggested that she would likely see QE continue for a while to help the US economy get back up on its feet.
Last week on October 8th the financial market experienced a broad based sell off. Every sector was down with utilities being the only exception.
The individual leadership stocks, which are typically small to mid-cap companies (IWM – Russell 2K) that have a strong history and outlook of earnings growth, were hit hard as well.
Whenever the broad market experiences a price correction, one of the most important factors I analyze is how well leading stocks hold up and show relative strength to the broad market.
So, where does this leave us going forward?
When stocks that have been leading the market higher and only pausing during market corrections in the S&P500, Dow, and NASDAQ, it’s a positive sign. This tells us investors and big money continues to flow into the risk on assets (stocks).
Conversely, when these leading stocks/sectors begin succumbing to the selling pressure of the broad market, it quickly grabs my attention and tells us it’s time to be aware that a major top may be forming.
It looks as though the broad market rally is just barely hanging on. If the leading stocks and sectors begin breaking below their 50-day moving averages, my proprietary SP500 Market Timing & Trading System will shift to sell mode and things could get ugly for those who do not know how to trade a bear market.
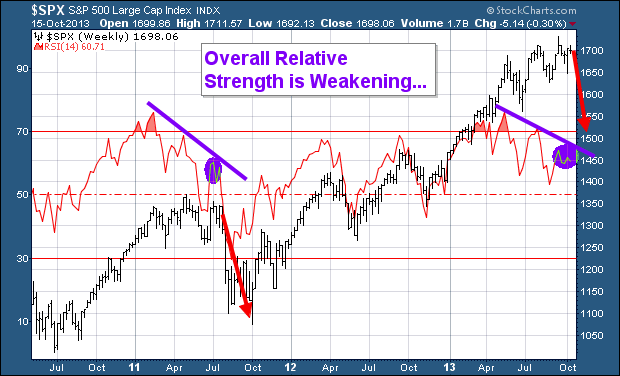
Weekly Relative Strength Showing Negative Divergence
This chart has two important things I would like to point out. First is the fact that the RSI has being overbought twice in the past three years with the most recent one taking place a few months ago. The last time this took place the SP500 had a very strong correction.
The second insight the RSI is providing us with is the diverging price and relative strength as shown with the purple lines on the chart below. This is telling us that the power/momentum behind the market is slowing.
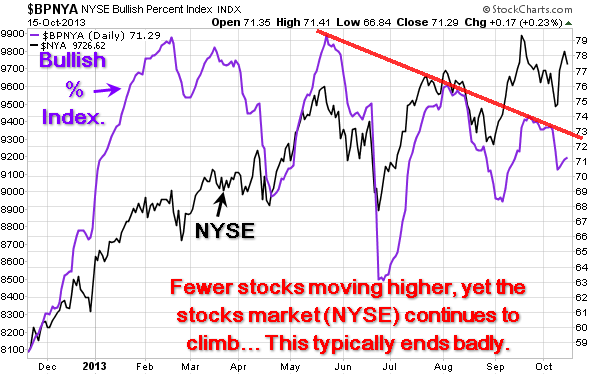
Daily Bullish Percent Index – Shows Negative Divergence
I always prefer to watch and analyze the NYSE as it’s the big board where all the HUGE money is flowing from traders and investors. The chart below clearly shows that less stocks are moving higher as seen with the purple bullish percent index line. With less stocks making new highs, yet the stock market continues to climb this is a warning sign that this bull market is slowly running out of steam.
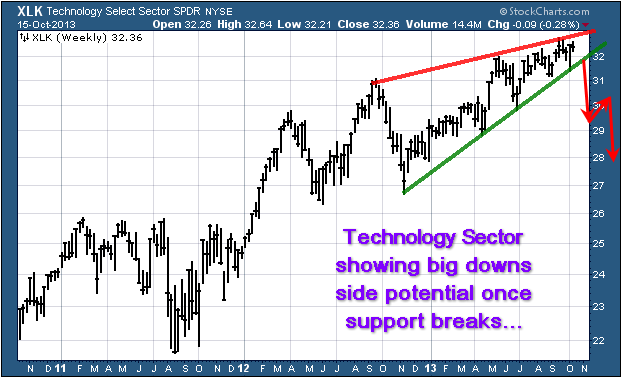
Technology & Financial Sector Are Rising But For How Long?
Two very powerful sectors are holding up well but once they start to breakdown from these chart patterns things could get ugly real quick. Our 3x ETF trading newsletter becomes very active in bear markets as the upside potential is much larger.
The XLK technology sector looks to be forming a bearish rising wedge. If/once it starts to slide it will have a strong impact on the broad market.
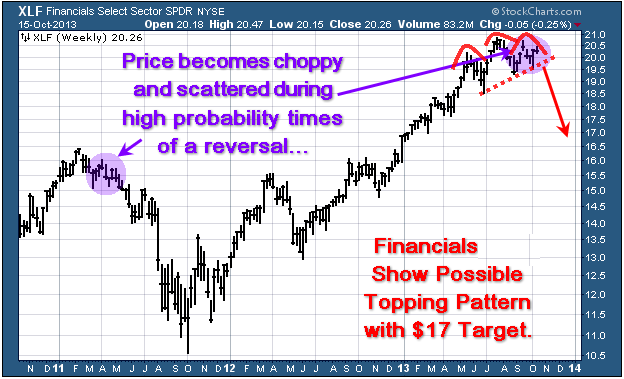
Financial Sector XLF
The recent price action of scattered trading ranges looks to be similar to the top we saw in 2011. If this is the case then we have bearish head & shoulders pattern with a rising neckline forming. Once price breaks through the neck line we should expect sharp drop in price.
This sector is heavily weighted in the SP500 so if it start to drop, expect the SP500 to fall with it.
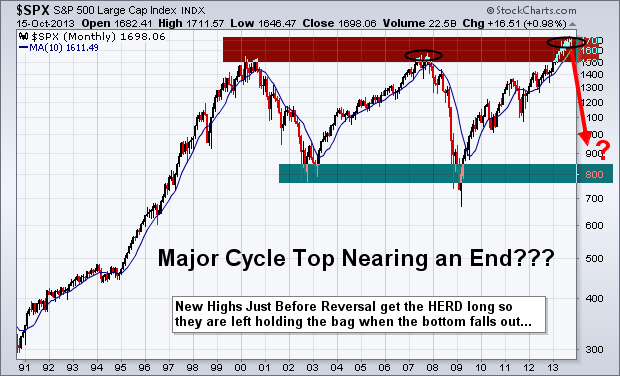
Major Market Top Lurking…
The chart below pointing out the next bear market likely to take place is a scary looking chart to most individuals. But if you know what you are doing, they can provide more profits in a shorter period of time than a four year bull market.
If this market is starting to stall out and is in the process of forming a top. Keep in mind that market tops are a process. They take typically 3-6 months to form before a true breakdown occurs and the bear market starts. And until then, price will be choppy and difficult to trade.
Cautious Trading Conclusion:
In short, this report shows you some major divergences in the financial market. Remember, you do not really trade off divergences, as they are not good at timing. They are simply a warning sign telling us that something large is brewing and that risk is higher than normal.
There are few ETFs I like on various sectors and commodities that show some oversized upside potential in the coming weeks/months. Depending on what takes place in Washington this week will move the market and likely trigger some sharp moves. Until then, sitting tight is the safe play.
Get my trading reports and my trade alerts at www.TheGoldAndOilGuy.com
Chris Vermeulen