Posts

Since July of 2014 the big cap stocks have continued to make new highs as investors dump more and more money into the stock market. Overall bullishness on the stock market is now at extremely high levels which typically happen before a major stock market correction and sometimes start a full blown bear market.

While the average investor continues to become more and more bullish, the market breadth/health has been rapidly deteriorating. Unless you are market savvy you would not know how weak the market actually is and this always leads to strong losses and drawdowns for the uninformed investor.

What we know and most do not about this rising market, is that the big cap stocks in the SP500 index appear to be holding the overall market up and masking the weakness. So as investors become more bullish at these lofty levels putting more money into generic funds that push the SP500 higher, we see strong selling and unwinding of the more leveraged position like small cap stocks.

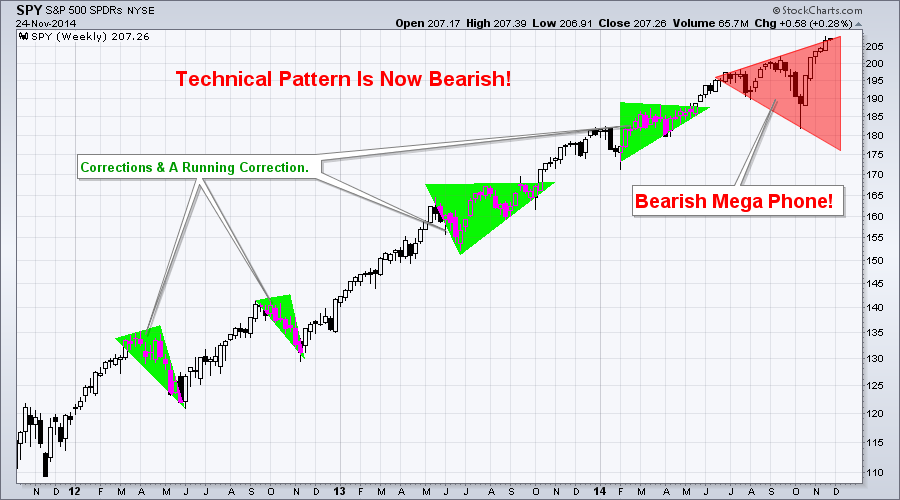
Over the past couple years the SP500 has formed a series of bullish corrections and running corrections. But the current formation is that of a bearish mega phone pattern and these typically point to lower prices.

SP500 BIG CAP STOCKS:
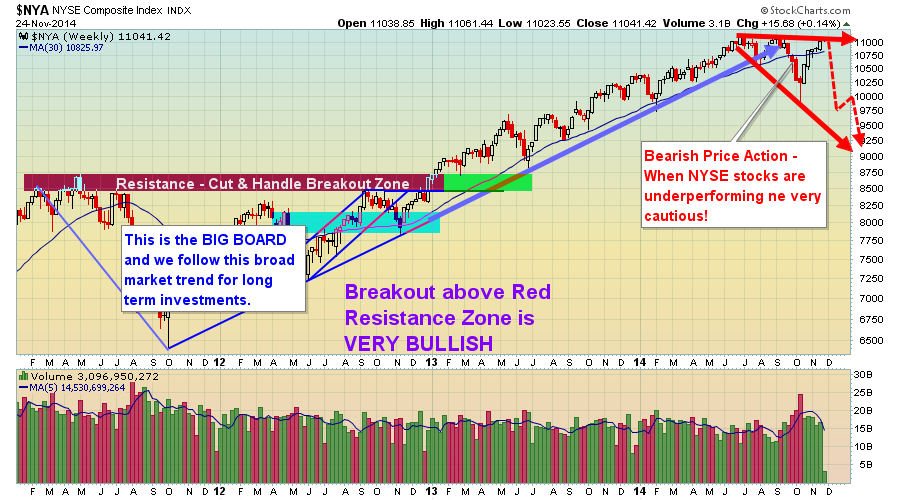
spy1


THE BOLD STOCKS:

I have always liked to follow the NYSE index because its a basket of 1900 stocks with 1500 of them being U.S companies. Its breadth/strength makes it a much better indicator of the market performance than the more narrow indexes with less stocks.

While this index remains in a bull market, it only looks as though it’s a few months away from a possible reversal and confirmation of a new bear market.

nyse


THE UGLY:

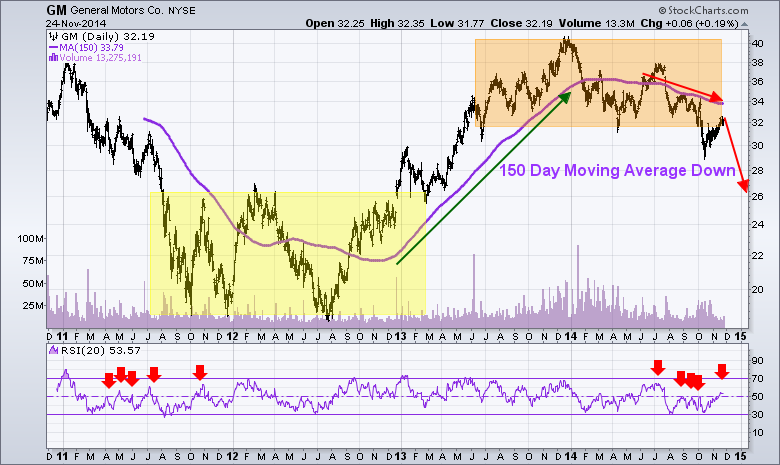
If you have ever read Stan Weinstein’s book then you know he followed GM share price closely. He believed that what GM did, the stock market would follow, to some extent. GM was/is an early leader of the US economy and stock prices in general.

The chart below paints a clear picture of the Stage 1 Accumulation in 2011- 2012, and also of the Stage 3 Distribution phase in 2013 – 2014. GM shares have traded down literally from the first week of the year and have now broken below critical support. Things could get interesting…

GM1


MY TRADING CONCLUSION:

In short, I remain bullish on the stock market with both my short term and investing outlook but I am very cautious and have closed out several large positions recently. Cash is king and I plan to protect, rather than invest my nest egg when risk is higher than normal.

Short term trading where trades only last 3-10 days is the way to go at this stage of the game. Some recent winning ETF trades with my ETF newsletter www.TheGoldAndOilGuy.com have been in SCO, a quick bounce trade in UCO, REM, and our current trade as of last week EEM.

The majority of my investment capital is traded with my automated trading system. It trades the S&P500 index directly in my brokerage account catching these 3-10 day swings in the market saving me time while reducing my emotional attachment to the market.

blackfriday1

Chris Vermeulen

It looks as though the Nasdaq is about ready for another leg lower. Watch these key resistance levels for a short trade this week.

Get These Trade Alerts Every Week with my ETF Trading Newsletter

Watch here to learn more about my improved gold forecast and etf newsletter…


Also You may want to see these three new long term investment plays:
http://www.thegoldandoilguy.com/next-three-bull-markets-starting/


And my unique way to gauge the market strength:
http://www.thegoldandoilguy.com/gm-gs-xom-broad-market-trading-strategy/


JOIN ME WHILE I TRADE FOR CONSISTENT LONG TERM GROWTH – Click Here

As we all know, there is always a bull market somewhere…

In this video report I will share with you the next three big investments for 2014 which are unfolding as we you read this. And Precious metals (gold, silver & miners) are only one of the bull markets…

You have not heard anything about these sectors on CNBC, radio, and no one is writing about them. Because of this, it has me really excited because the more people that are caught off guard with a move the bigger upside potential there is.

All you have to do is watch the video to find out…

Watch Video Now:

Get All My Trades and Investments with my ETF Trading Newsletter

Chris Vermeulen
www.TheGoldAndOilGuy.com

Over the past few weeks I have been watching the DOW and Transportation index closely because it looks and feels like the Dow Theory may play out this year and the stock market could take a 15% haircut.

But what if you skipped on the haircut and opted for a 40% refund?  What? Keep reading to find out how.

Keeping this post short and sweet, I think the US stock market is setting up for a sharp selloff. And it will look a lot like the July 2011 correction. If my calculations are correct this will happen in the next 3-9 weeks and we will see a 15% drop from our current levels. Only time will tell, but I have a way to hedge against this with very little downside risk to you ETF portfolio.


The Dow Theory Live Example for ETF Portfolio

The daily chart of the SP500 index below shows our current trend analysis with green bars signaling an uptrend, orange being neutral, and red signaling bearish price action. Currently the bars are green and we can expect prices to have an upward bias.

The Dow Theory could be  in play. When both the Transports (IYT) and the Dow Jones Industrial Average (DIA) cannot make higher highs and start making lower lows, according to the Dow Theory the broad stock market is topping.

We are watching the market closely because they have both made lower highs and lows.  This rally could stall in the next couple weeks and if so we expect a 15% correction.


Model ETF Portfolio


Take a look at the 2011 Stock Market Crash

Model ETF Portfolio Trading

The chart above shows how fearful traders have a delayed reaction to moving money from stocks to a mix of risk-off assets.

The choppy market condition during August and September clearly helped in frustrating investors and created more uncertainty. This helped prices of this ETF portfolio fund rally long after the initial selloff took place. This is something I feel will take place again in the near future and subscribers of my ETF newsletter will benefit from this move.

Because we have a Dow Theory setup, our risk levels are clearly defined as to when to exit the trade if it does not play out in our favor. But with the potential to make 40% and the downside risk only being 4%, it’s the perfect setup for a large portion of our ETF portfolio. And just so you know this is not a precious metals trade as we are already long that sector and up 10% in that position already.

Get My Daily Video Forecasts & ETF Trades Today – Get Off The Fence Make Your ETF Portfolio Perform

Chris Vermeulen
www.TheGoldAndOilGuy.com

The stock market is at a very critical pivot point which I feel will generate opportunities in December and for the first quarter of 2013.

Trading with the trend is not always an easy task. It is human nature to predict and jump to conclusions and usually it’s better to trade with the trend no matter what your emotions are telling you. The current trend is down and I stick with that until we are proven wrong.

If you carefully analyze the charts below you will understand where we are trading in the market and what the risks are at this point. The question is are in the middle of a trend reversal back up, or is this just a bounce within a down trend? Either way, any pullback this week should be aggressively managed to lock in gains and tighten stops because it could go either way and you do not want to be on the wrong side of the table.

The chart below shows the US dollar index 4 hour chart. It looks as though we should start to see a bounce this week and that should put pressure on stocks and commodities.

The SP500 (SPY etf) below that shows my analysis and key price levels. I took a short position on the SPY Friday afternoon as I feel a pullback is imminent. That being said, all I need is one big down day and I will be pulling money off the table to lock in gains and tighten my stop.

If a detailed educational lesson on stock market cycles read my mini course here: http://www.thegoldandoilguy.com/downloads/COAAROTB.pdf

Dollar Index and SPY ETF Trading

My trading charts make reading the market simple, quick and precise so if you want this type of analysis and trade ideas delivered to your inbox every day including my Pre-Market video analysis then join my newsletter here: www.TheGoldAndOilGuy.com

Chris Vermeulen

The past month has been a wild ride for both equity and commodity traders around the globe. Novice traders have had their heads handed to them and their investment accounts drained. When fear, uncertainty and volatility are running high, some of the best opportunities become available to those who know what to look for. These market conditions force you to focus and strive for perfection in finding low risk entry setups and to also actively managing positions with laser focus because within hours a winning trade can turn into a losing trade.

Looking back on the daily charts of the dollar, SP500, gold, and also the overseas markets it looks as though we are nearing a market bottom. I say NEARING because I think investments need more time for the current selling pressure and bearish sentiment to run its course, which could take another few weeks and possibly a few month before truly bottoming.

Let’s take a quick look at some charts…

SPY 30 Minute Chart Looking Back 2 Months

As you can see below price action has been wild. But for subscribers to my newsletter it has been a fun and exciting time having pocketed over 40% return from August 1st – up until today.

The point of this chart is to show you the basic market phases (Impulse, Uncertainty, and Corrective). Understanding how to identify each phase using momentum, price action, volume analysis and market sentiment is crucial for success in today’s volatile market. Once mastered you can trade virtually any investment with a high level of confidence, though I recommend mastering 3-4 investments at most and just trading those full time with pinpoint accuracy. Through my newsletter members learn exactly how to read the market and manage positions from my daily video market analysis, intraday updates, trade alerts and trading tips.

As you can see below I am anticipating weakness in the market over the next few days. Once those levels are reached or if the charts start hinting that a reversal back down is imminent I will be ready to take action using an inverse leveraged ETF.

Index ETF Trading Newsletter


Gold 30 Minutes Chart Looking Back 2 Months

This chart will piss some people off for sure… but the chart to me is still pointing to lower prices at this time. Until we get a breakout above the upper resistance level I am not bullish on gold. Keep in mind that during strong selloffs in the stock market almost all investment drop together (gold, silver, oil, stocks).

Gold ETF Trading Newsletter


German DAX Daily Chart Looking Back 3 years

This chart shows the long term chart of the DAX which I think is giving us some insight to a global market bottom in the coming months. You will notice I painted the phases over the chart and where I feel the market is trading and where it is headed looking forward.

Dax ETF Trading Newsletter


Dollar Index Daily Chart Looking Back 3 Years

The dollar also shows us three years for price action. If this strong rally continues in the dollar we will see lower stock and commodity prices for a few more months.

Dollar ETF Trading Newsletter

Trend Trading Idea Conclusion:

In short, I feel we have some very exciting times ahead along with huge potential trades starting to unfold. While I don’t want the market to collapse I will admit I prefer trading the short side of the market because fear is easier to trade than greed, not to mention prices drop much quicker than they rise… I’m sure you like making money fast also… J

I can email you my bi weekly reports and videos by joining my free newsletter here: www.GoldAndOilGuy.com

Chris Vermeulen

I was starting to put on my bullish hat on Friday morning when out of the blue an ugly close has forced me to rethink my position. After viewing a few hundred charts, I have determined that while I am still leaning into higher prices at this point in time, I will not totally rule out a rollover on the S&P 500. In coming days the news flow will be extreme and headline risk will be everywhere we look. The S&P 500 has been able to deflect worry for quite some time now and in every case the resiliency is unquestionable.

However, we are nearing the beginning of another earnings season which will start in just a few weeks’ time. First quarter earnings for 2011 are going to be quite interesting and most analysts’ estimates are relatively challenging. Will the rubber hit the road into earnings? Are we about to see a double top play out into earnings, or is there going to be a breakout which will take us to the SPX 1,400 – 1,415 price level?

I know, I ask a lot of questions but quite frankly that is what is running through my head. The SPX is not out of the woods yet, and the price action on Friday indicated that there is some serious supply overhead and two key resistance levels to break through before the SPX gets back to clear blue skies overhead. That being said Chris Vermeulen has caught a nice part of the recent bounce with his subscribers. He does feel the market is about to get choppy but his analysis is pointing to overall higher prices in the coming weeks.

SPX illustrates the two key price levels:
SP500 ETF Trader

In addition to the uncertainty that earnings season can bring, the primary reason why I am still leaning into a bullish move in the S&P 500 is the recent price action in the U.S. Dollar Index futures. The U.S. Dollar is scheduled to make its 3 year cycle low sometime this spring and the recent price action is indicative that the recent lows may not be the cycle lows. If the U.S. Dollar Index breaks down below recent lows, I would expect to see a nasty sell off.

The U.S. Dollar Index futures daily chart is shown below:
DX Dollar ETF Trader

Whether readers believe that we are going to be in an inflationary environment or a deflationary environment is a topic for a different time, but the chart above is undeniable that recently the U.S. Dollar has declined in value and is exhibiting weak price action. Friday morning it looked as though the U.S. Dollar was going to rip higher, but by the end of the day sellers had stepped in and forced the U.S. Dollar into the red for the session. The price action on Friday highlighted the weakness in the U.S. Dollar and the high levels of overhead supply.

If the U.S. Dollar continues to weaken, in the short run I would view this as a positive for the S&P 500, crude oil, and precious metals. If the dollar breaks down to new lows, it should help buoy the S&P 500 and gold prices. Gold has been consolidating for nearly 6 months and a breakout higher from current price levels would make a trip to $1,500 an ounce very likely. I would not be surprised to see gold work even higher than $1,500 an ounce depending on how violent the selloff in the U.S. Dollar might be.

The weekly chart of gold futures is listed below:
GC Gold ETF Trader

I would think that most investors are aware that crude oil futures have been trading higher recently. On Friday oil prices climbed above recent resistance around the $107/barrel price level and reached new recent highs. Members that belong to my paid service enjoyed a relatively low risk options trade that we put on several weeks ago which involved selling cash secured naked puts on $USO. The trade was closed on Friday for a total gain of 85% of the premium that was sold. For long time readers, my stance on energy has been pretty obvious. In the longer term, energy prices almost have to go up as the world’s demand for energy increases while supplies remain flat.

I will likely get involved in another oil trade at some point in the future, but for right now I’m going to wait for a more prudent entry. Based on current price action, it would not surprise me to see crude oil futures test the $110 – $112 per barrel price range in the near future. If the $112/barrel price level is breached to the upside, a test of the $120/barrel price level will be likely.

The weekly chart of oil futures is listed below:
CL Crude Oil ETF Trader

Weekend Trend Conclusion:
The S&P 500 is in an interesting place as far as the price action is concerned. With earnings season rapidly approaching and a possible break down in the U.S. Dollar Index likely, future price action is uncertain. I am leaning into the bullish camp at this point, but that could change rather quickly based on the price action later this week in both the S&P 500 and the U.S. Dollar Index. One thing worth mentioning is that if the U.S. Dollar Index were to bottom around these levels and a bounce higher transpired, it would put negative price pressure on most asset classes. The fact that price action in the U.S. Dollar Index has been weak lately makes me believe a break down is likely, but as most readers know Mr. Market offers few guarantees.

Assuming the U.S. Dollar breaks down, we should see the S&P 500, precious metals, and oil continue to work higher. My eyes are going to be watching the U.S. Dollar Index closely in coming days/weeks. If a breakdown transpires, the potential upside in precious metals and oil could be intense. Ultimately, I remain slightly bullish on stocks and extremely bullish on oil and precious metals. However, my entire thesis could change if the U.S. Dollar Index starts to firm up and begins to work higher. There are simply too many question marks surrounding price action to take on significant amounts of risk at this point in time.

Analysis & Opinions of:
J.W Jones – www.OptionsTradingSignals.com
Chris Vermeulen – www.TheGoldAndOilGuy.com

It has been a roller coaster week thus far as stocks and precious metals plunged on heavy selling volume on the back of a rising dollar, only to make a strong rebound Wednesday. While there has been significant intraday price movement, it was no surprise to us as we have been anticipating this pullback since discussing it in my Sunday Gold Newsletter.

Let’s take a quick look at the charts…

US Dollar Daily Trading Chart

The past couple weeks the dollar has traded in a choppy fashion, and last week I mentioned to subscribers to keep any new positions small. The dollar looked ready to make a bounce and if it reverses we will see stocks and commodities correct rather sharply.

Last week we trimmed some profits on our gold and SP500 trading positions in anticipation of a rising dollar/lower equity and metals prices. The dollar is currently in a down trend so we are still trading with the trend, but the next couple sessions could potentially change that.

As you can see on the chart a similar pattern to what we saw during the May/June top earlier this year has now formed in reverse this month. It’s a simple pattern I call a drop-n-wash. It is like dropping a knife – you panic, then take action (move foot, then wash the kife). That is typically how the market reacts to this type of price pattern after an extended trend has taking place for a long period of time.

The dollar made an obvious breakdown which the entire world witnessed, causing traders who recently went long to panic and sell their positions. Those who like to short the dollar would have taken a short position, only to see the market reverse and head straight back up again. This pattern has yet to confirm, but through the use of the shorter time frame charts (5 Min, 10 Min, 30 Min), I have a feeling the dollar may continue to rise. However, until the dollar shows considerable strength I am still playing the long equities / long gold side of the equation.

SPY – SP500 ETF Trading Fund

The SP500 made a nice move up last week and we trimmed our position back to lock in more gains as I anticipated this pullback and possible gap fill. As you can see on the chart the moving averages are all heading up and that’s the direction we are still focusing on playing (buying dips).

The morning dip on Wednesday the market sentiment started to shift to become extremely bearish on the short term time frame (10 minute charts). If the market drops down to fill the rest of that gap, I have a feeling the majority of traders will panic out of their position giving us an extreme sentiment buy signal. Also a gap fill will bring the price down to the key moving averages which will act as a support level. I will notify members to add more to my SP500 long position if that happens.

GLD – Gold ETF Trading Fund

Gold has much of the same story as the SP500 but with a couple twists. Gold has huge global demand from banks, investors and traders adding more buying power to this investment than stocks right now. We could see gold hold up above its gap that formed last week. That being said, a pullback to the key moving averages would not only act as a major support level but also fill the gap. We currently have our long positions, but trimmed some profits near the highs and are sitting tight letting the market work it’s self out.

My trading partner J.W. Jones posted a great gold play yesterday which had a nice payout already. Read about his gold options trade here.

Mid-Week ETF Trading Conclusion:

In short, the focus should be kept on trading with the underlying trends until a trend change has been confirmed. So that means short the dollar, long equities, metals and oil.

That being said, because things are starting to look unstable it is crucial to trade smaller position sizes during times of uncertainty like this. Anticipating major market tops is very difficult and generally costly play, just ask everyone who has been trying to pick a top for the past 2 months… Anticipate trend changes, but don’t trade them until the price/volume action confirms the new trend.

Get My Daily Pre-Market Trading Videos, Daily Updates & Trade Alerts Here: www.GoldAndOilGuy.com

Chris Vermeulen

Last week was volatile thanks to China raising their interest rates a quarter basis point. This rate hike caused the Dollar to spike in value which in turn forced equities and metals to sell off sharply. This one day event caused equities to break below a short term support level causing a large number of protective stops to be triggered. This added more selling pressure causing the market to be down nearly 2.5% at one point but a late day bounce recouped a good chunk of the drop.

Wednesday & Thursday the market had a nice rally making back all of losses and then some. But Thursday afternoon we saw the market slip below a key short term support level and triggered another wave of stops. The market continues to resilience because it recovered into the close saving the day.

After Thursday’s end of day rally, we had expected a typical light volume session which typically chops around in a sideways or slow grind higher.

SPY – SP500 ETF 10 Minute Intraday Chart

I have put together a short video covering last weeks price action along with that I feel is likely to unfold this week.

SPX, Dollar, Oil & Gold Analysis Video:
http://www.thetechnicaltraders.com/etftradingvideos/FTS149/MarketTrend.html

Chris Vermeulen
www.TheGoldAndOilGuy.com – ETF Swing Trading Signals