
Season of Falling Prices and Percent Index Proves It!
It’s a knows fact that Sept and October are typically weak times for US stocks. Going back 37 years shows us the tendency for investors to sell and rebalance their portfolios to try and perform better during the final quarter.
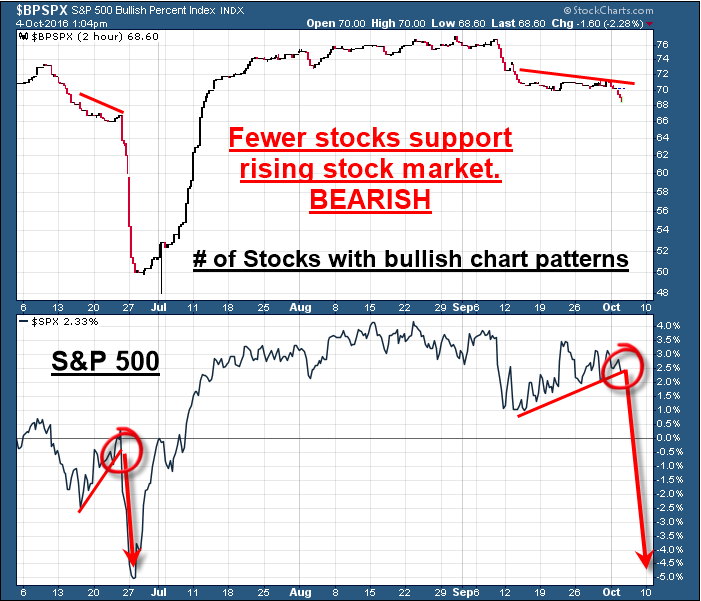
But that’s not really the point of this article. The chart below shows a comparison between the SP500 bullish percent index and the SP500 index.
What is a bullish percent index?
in short, it’s based on point-and-figure charts and is one of the oldest and simplest stock charting tools to help identify the overall market strength or weakness. This index shows us how many stocks have generated a buy signal within the group of stocks its tracks.
Bullish Percent Index Proves Market Is Weakening:
The chart below shows the bullish percent index at the top and the SP500 at the bottom. I think the charts paint a clear picture of what is taking place. Currently the BPI is trending lower and picking up speed, while the SP500 index has been rising. This means fewer and fewer stocks are holding the stock market up and this typically ends with a sharp market correction. The last time we saw this was in June.
In fact, the drop in gold miners of 10% on Tuesday and the pullback in the SP500 I talked about it happening the day prior in a conversation with Kerry Lutz and also shared what we should expect next.
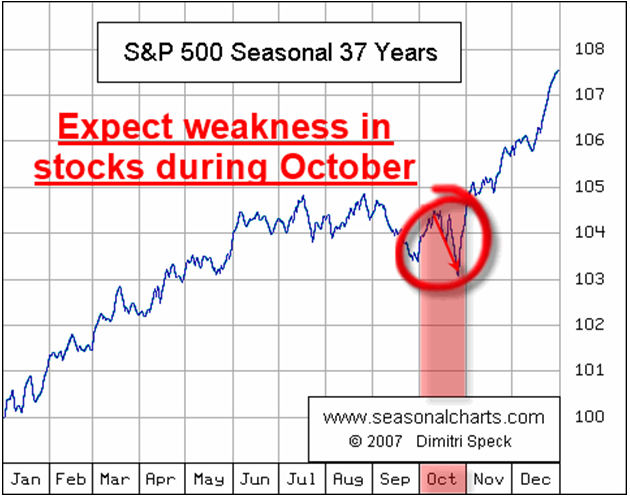
The Time of Year Stocks Correct:
Below is the seasonal chart of the SP500 taking into account all monthly price movements over a 37 year period. September is usually weak which it close lower for the month and so is October.
Concluding Thoughts:
In short, stocks are under pressure for the month of October. I expect increased volatility, and large intraday price swings to be more of the norm.
Stay tuned for my next update on the crashing metals and gold miners report next, and be sure to follow my trades at: www.TheGoldAndOilGuy.com
Chris Vermeulen

