
Energy Sector Set To Save the Stock Market

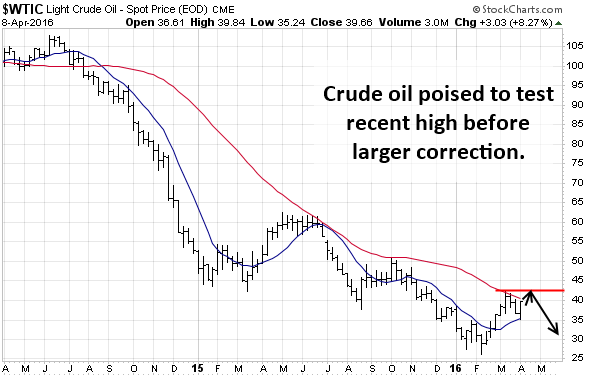
Over the past few week, we have seen the price of crude oil pullback from its recent high of $42 per barrel level. Last week April 4-8th the price of crude oil pulled back to a technical support zone and then posted a strong gain closing the weekly chart at the high.
Based on short-term technical indicators, along with the current momentum which crude oil has, I feel we will see the recent highs of $42 a barrel tested once again.
So what does this mean for energy stocks in the stock market as a whole? Well, if things unfold this week as I expect they will then we should see oil rise along with, energy stocks, and the S&P 500 index.
Take a look at the chart of crude oil below:
This weekly chart of oil shows what I expect will happen over the next one to three weeks, a bounce in price.
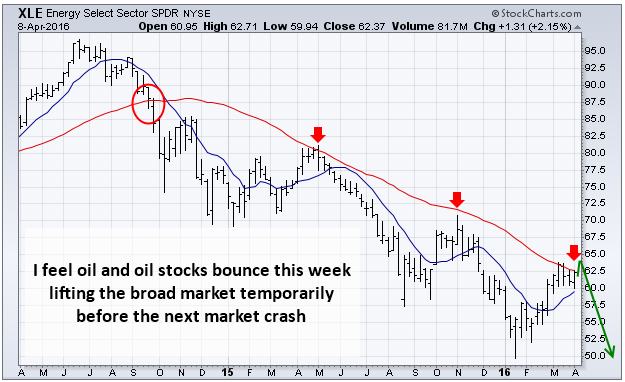
XLE Energy Sector Index Fund:
Energy stocks of had a strong rally since the lows earlier this year. But as you can see from the chart and basic technical analysis the price is now running into resistance at the moving average.
The moving average has acted as resistance for price and price is currently struggling at that level once again. I wouldn’t be surprised though to see the XLE fund push higher one last time testing the recent highs from last month before it tops and starting another large correction.
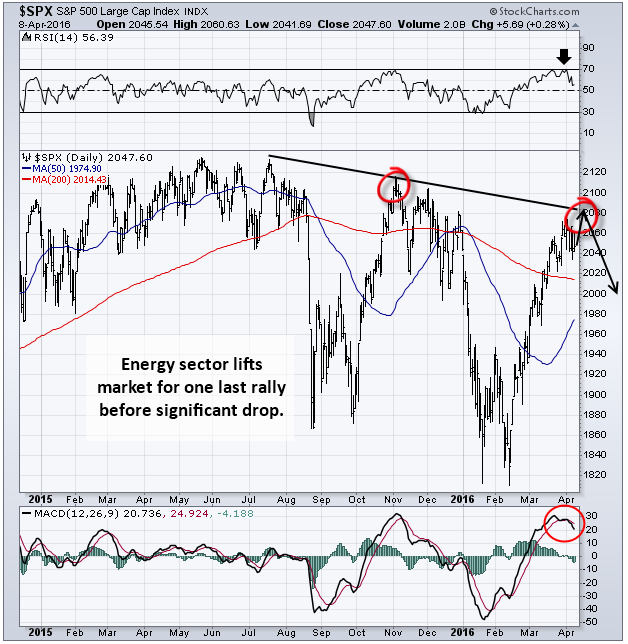
The US stock market:
While the US stock market has posted strong gains since the January low, I feel this rally is going to come to an abrupt stop this month or in May.
If oil and energy stocks continue to move higher than we should see the stock market follow suit and for the S&P 500 to rally one last time up into a resistance zone before the next big wave of sellers step back into the market.
Energy & Stock Market Conclusion:
In short, I feel the US large-cap stocks are setting up for an epic drop in price. My technical analysis and cycle analysis are lining up very similar to what I saw during the 2000-2001 market top and the 2007 – 2008 market top. Investors should expect a 35% to 50% market correction over the next 12+ months.
With that said, the next few weeks will become very difficult to trade simply because the market is starting to get choppy with wild intraday price swings. This is because the average market participants are becoming more bullish than ever on stocks again while the large institutions are starting to distribute huge amounts of shares to these undereducated investors who don’t know technical analysis and stock market cycles.
My current mindset has been to go into the markets for as little as 48 hours and then exit with a nice handsome profit using a strategy known as Price Spikes. This has worked out very well this year capturing very quick profits from these special “price spikes’. It’s a simple “Get-In & Get-Out” strategy for highly volatile markets.
Good times are coming for us active traders and investors so buckle up!
If you would like to know when to buy and sell as a short-term trader or long-term investor using ETF’s and join me at www.TheGoldAndOilGuy.com
Chris Vermeulen

