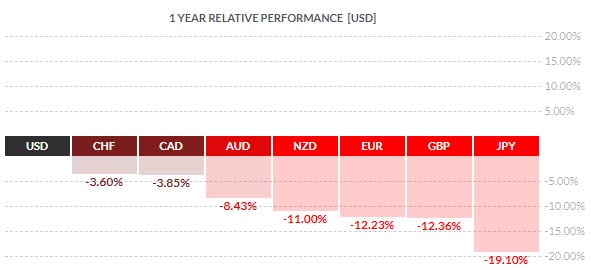
The U.S. Dollar is one market that continues to stand out as a stronghold for traders and investors. The world’s primary reserve currency, the USD, remains solidly above all other major global currencies.

As we move into the summer, the stock indices have not only been choppy but continue to trend lower.

Commodities, metals, and energy appear to be topping and experiencing distribution.

U.S. Dollar 1 year relative performance

 www.finviz.com

Cash is King as traders are now placing a value on liquidity. As losses mount and capital evaporates, traders are liquidating many different assets to meet margin calls and raise needed cash.

Going to cash and salvaging what is left is a survivalist strategy. It has many benefits providing peace of mind as well as the future potential to generate significant returns down the road. If a trader does nothing and their capital continues to evaporate, it can be fatal to a trader’s overall attitude and hinder their ability to generate future profits.

Markets go up, and markets go down. What makes the big difference is how we manage risk and how well we do in following the direction of price. Knowing and controlling one’s emotions dictates how long we can play the game or how successful we will be.

Now is not a good time for traders to become complacent or ignore their basic money management and risk principles.

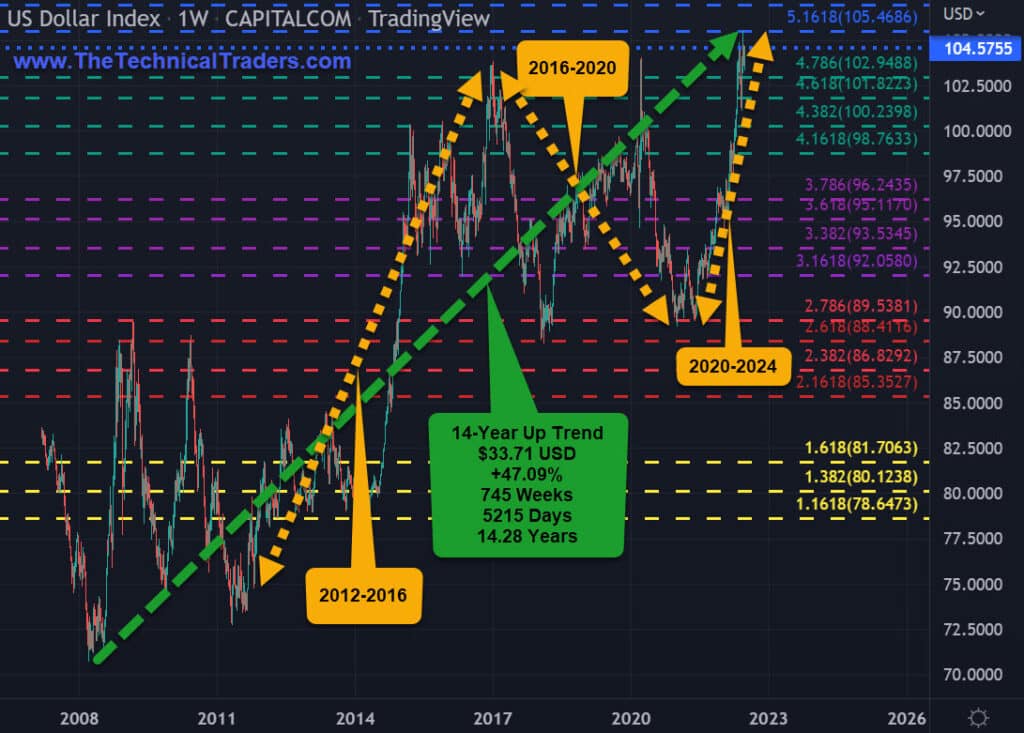
U.S. DOLLAR 14-YEAR UP TREND

  • U.S. Dollar has been up 14.28 years from 2008 to 2022.
  • 2012-2016 U.S. Presidential Cycle: USD appreciated +37.20%
  • 2016-2020 U.S. Presidential Cycle: USD depreciated – 12.80%
  • 2020-2022 U.S. Presidential Cycle: USD appreciated +17.35% to date
  • U.S. Dollar New 14-year high

US DOLLAR INDEX • DXY • CAPITALCOM • WEEKLY

U.S. Dollar 14 year chart

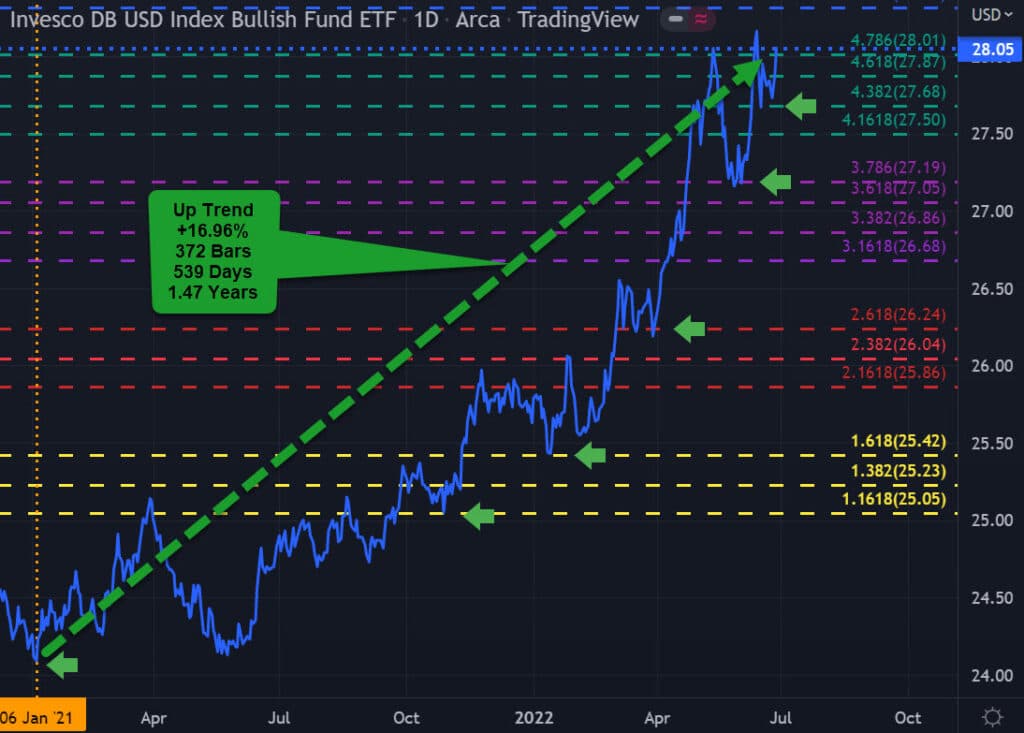
U.S. DOLLAR ‘UUP’ ETF +16.96%

  • January 6, 2021, to present USD ETF UUP + 16.96%
  • Pullbacks or corrections have typically been 3-4%
  • Pullbacks or corrections have typically lasted 20-50 days
  • Price target extensions for potential resistance are at $36, $42, & $48

INVESCO DB USD INDEX BULLISH FUND ETF • UUP • ARCA • DAILY

U.S. Dollar UUP chart

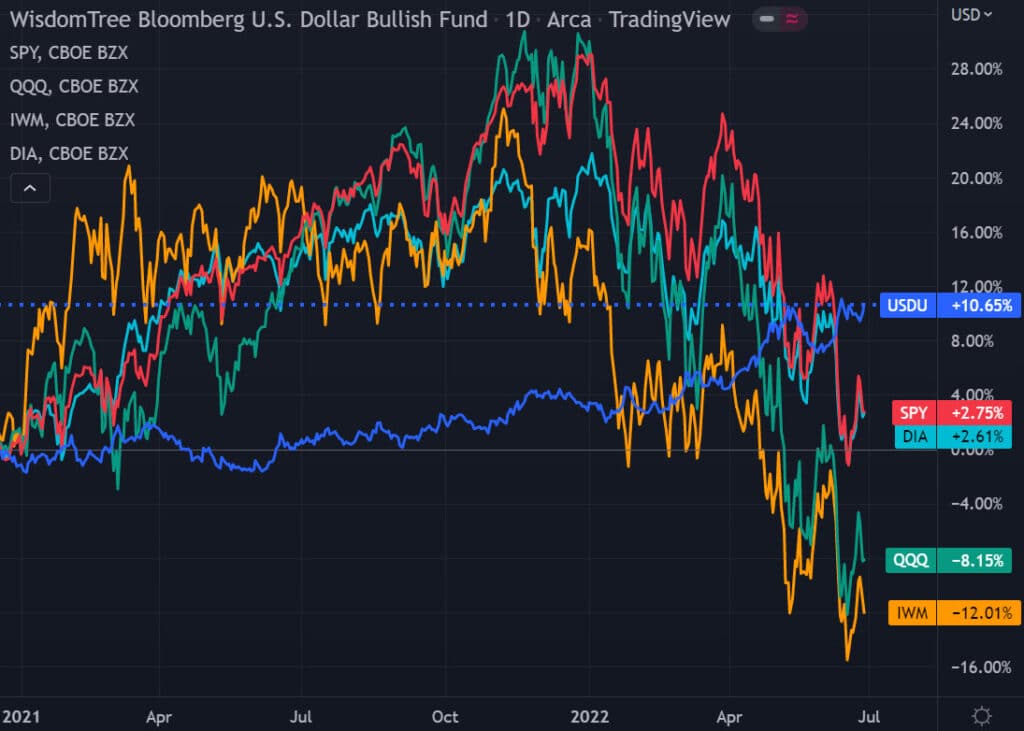
U.S. DOLLAR VS U.S. EQUITY INDICES

  • Comparative Percentage Chart: U.S. Dollar ETF VS U.S. Equity Indices ETFs
  • Timeframe: January 6, 2021, to present
  • 372 bars, 539 days, 77 weeks, 17.9 months, or 1.47 years
  • +10.65% USDU ETF: Wisdom Tree Bloomberg U.S. Dollar Bullish Fund
  • +2.75% SPY ETF: S&P 500
  • +2.61% DIA ETF: Dow Jones Industrial Average
  • -8.15% QQQ ETF: Nasdaq 100
  • -12.01% IWM ETF: Russell 2000
  • Maximum spread equals 22.66% (+10.65% USDU vs -12.01% IWM)
  • Forecast is that the spread will continue to expand

WISDOMTREE BLOOMBERG U.S. DOLLAR BULLISH FUND • USDU • ARCA • DAILY

U.S. Dollar vs Equity chart

VALUABLE INSIGHTS FROM SUCCESSFUL TRADERS

Market Wizards by Jack D Schwager (www.Amazon.com) is packed with insights from successful traders who have shared their wisdom based on firsthand trading experiences. Here are a few of our favorites:

Tom Baldwin:

  • “My secret to trading success is perseverance.”
  • “You have to love it to do it.”
  • “You cannot let ego get in the way of a trade that is a loser; you have to swallow your pride and get out.”

Tony Saliba:

  • “You can make money in any kind of market if you are using the right strategy.”
  • “I scale in and scale out of my positions so that I can spread out my risk.”
  • “I do not like to do all of my orders at any one price in or out.”

Dr. Van K Tharp:

  • “Good rules, cut your losses short and let your profits run.”
  • “Stress is not good as our brains have limited capacity in processing information and can shut down during periods of high stress.”
  • “You have to take some hits if you are going to be successful, just keep them small.”
  • “Many people allow their emotions to control their trading.”

LEARN FROM OUR TEAM OF SEASONED TRADERS

In today’s market environment, it’s imperative to assess our trading plans, portfolio holdings, and cash reserves. As professional technical traders, we always follow price. At first glance, this seems very straightforward and simple. But emotions can interfere with a trader’s success when they buck the trend (price). Remember, our ego aside protecting our hard-earned capital is essential to our survival and success.

Successfully managing our drawdowns ensures our trading success. The larger the loss, the more difficult it will be to make up. Consider the following:

  • A loss of 10% requires an 11% gain to recover.
  • A 50% loss requires a 100% gain to recover.
  • A 60% loss requires an even more daunting 150% gain to simply break even.

Recovery time also varies significantly depending upon the magnitude of the drawdown:

  • A 10% drawdown can typically be recovered in weeks to a few months.
  • A 50% drawdown may take many years to recover.

Depending on a trader’s age, they may not have the time to wait nor the patience for a market recovery. Successful traders know it’s critical to keep drawdowns with reason, as most have learned this principle the hard way.

Sign up for my free trading newsletter so you don’t miss the next opportunity!

We invite you to join our group of active traders who invest conservatively together. They learn and profit from our three ETF Technical Trading Strategies. We

In the trader tip video, Brian talks about the US Dollar UUP trade setup of the week. Unlike so many other stock charts that still have a lot of risk to the downside, the ETF UUP trade setup looks strong. UUP is an ETF on which you can trade options. This provides the opportunity to trade with leverage at a reasonable price.

As the US Fed continues its quantitative tightening program that reduces the supply of money, the US Dollar will likely continue to strengthen.

TO LEARN MORE ABOUT the UUP TRADE SETUP – WATCH THE VIDEO

Subscribers: Please let us know what you would like to learn and we will add it to the roster of our weekly Technical Trader Tips!

Non-subscribers: Please enjoy these micro-lessons as a way to further your education and understanding of how a technical trader…well…trades!

TO EXPLORE THE STRATEGIES THAT BRIAN USES, PLEASE VISIT THE TECHNICAL TRADERS. YOU’VE GOT MORE TO GAIN THAN TO LOSE WHEN SEEKING INFORMATION!

Disclaimer: None of this material is meant to be construed as investment advice. It is for education and entertainment purposes only. The video is accurate as of the posting date but may not be accurate in the future.

As the Fed continues to posture future rate increases to battle inflation, recent economic data shows Consumers are in a state of shock as price factors continue to skyrocket. Food, gas, materials, etc have shot up in price over the past 24 months – with no end in sight.

Consumers Are Recoiling Away From Traditional Spending Habits

The natural reactions of consumers fall into two categories: Grow or Survive. This is similar to how plants and trees operate. In healthy environments, plants and trees enter a growth phase – flowering and prospering. In an unhealthy environment, plants and trees enter a survival phase – directing resources toward anything essential for survival.

Global inflation is putting pressure on central banks to thwart excesses in the markets after 8+ years of easy money policies and nearly 2+ years of COVID stimulus. Consumers thus seemed to have switched into Survival mode very quickly over the last 6+ months. This reaction could have very telling outcomes for global GDP and regional economies over the next 24+ months.

In August 2021, we published an article highlighting the shift in consumer activity. It brings attention to how important Consumers are to the overall health of the global economy.

Consumer Confidence Dips Below 100

After the 2008-09 GFC, Consumer Confidence took more than 5 years to rally back above the 100 level (in 2015). The 2015-16 range was a US Presidential election year cycle – which usually disrupts US economic activities a bit.

In early 2017, Consumer Confidence started to rally higher – eventually reaching a peak in October 2018 near 137.90. Historically, the only other time Consumer Confidence reached higher levels was in 1998-99 (DOT COM Peak).

Consumer confidence chart

(Source: Investing.com)

IYC May Start A Wave-5 Downtrend – Targeting $45-47 As A Base

Traders should consider the broader scope of the market trends while attempting to understand the opportunities that will come by waiting out the risks of trying to buy into a falling market. The Fed has clearly stated they intend to continue raising rates to break the inflationary cycle. Consumers will reflect these new risks by moving further away from traditional spending habits (Survival Mode) while attempting to wait out the risks to the environment.

It appears IYC has formed a moderate Wave-4 peak, which is below the Wave-1 bottom. From a technical perspective, it appears IYC will attempt to move below the $47 level over the next few weeks – attempting to establish a new base/bottom.

IYC price formation chart

US Real Estate Showing Signs Of A Top

No matter how you slice the data, more homes are flooding the US markets right now. Sellers are trying to “cash-out” at sky-high prices. Yet, buyers are staying very cautious because of rising interest rates and borrowing costs. Price Reductions on listed homes have risen to the highest levels over the past 8+ years. Sellers with homes on the market longer are aiming to tempt buyers with a discount. The race to the bottom has started. The Fed is going to add more fuel to the declines with another rate increase.

Recent Mortgage Refinance Index data shows the current 726.1 print is the lowest level since July 2000. This means the purchase and refinance are the most unfavorable for buyers over the past 22+ years (not since the peak of the DOT COM bubble).

Mortgage refinance index chart

(Source: Investing.com)

A reversion of home prices is almost a certainty at this point. I suspect a surge of new foreclosures and slowing sales will compound with layoffs and other economic contraction trends to present a “perfect storm” type of reversion event.

IYR Targeting $70 to $75 As Assets Unwind

IYR is likely to continue trending lower, targeting $70 to $75, before finding any real support. The reversion of asset valuation levels is still very early in the process of the Fed attempting to battle inflation. Depending on how the global markets react to the overall economic environmental change, we could see an extended contraction in assets lasting well into 2023 – possibly into 2024.

Traders should stay cautious of trying to chase the falling market trends. Real opportunity for profits exits when the reversion event is complete and when opportunities for less volatile extended trends resume.

IYR real estate weekly chart

Protective Patience May Be The Best Trader/Investor Attitude Right Now

The US markets are already down by more than -25% overall. Any extended decline from current levels could push many traders/investors into a crisis. When the bottom sets up and is confirmed, we’ll begin to allocate capital back into sector trends. In the meantime, we avoid this massive drawdown event by waiting on the sidelines and being ready to deploy capital.

My strategies pulled capital out of the markets very early in 2022. Since then we have been sitting in CASH as a protective market stance while the global markets continued to decline. Protecting capital is the first rule for any trader/investor. Learning when to trade and when to be patient should be rule #2.

As Consumer Confidence continues to decline, Consumers have moved into a protective/patient (Survival) mode. Traders and Investors should consider the longer-term risks of not adopting a similar stance right now.

WHAT STRATEGIES CAN HELP YOU NAVIGATE THE CURRENT MARKET TRENDS?

Learn how we use specific tools to help us understand price cycles, set-ups, and price target levels in various sectors. Also, learn how we identify strategic entry and exit points for trades. Over the next 12 to 24+ months, we expect very large price swings in the US stock market. The markets have begun to transition away from the continued central bank support rally phase. A revaluation phase has started as global traders attempt to identify the next big trends. Precious Metals may start to act as a proper hedge as caution and concern begin to drive traders/investors into safe-havens.

Historically, bonds have served as one of these safe-havens. This is not proving to be the case this time around. So if bonds are off the table, what bond alternatives are there? How can they be deployed in a bond replacement strategy?

HOW WE CAN HELP YOU LEARN TO INVEST CONSERVATIVELY

At TheTechnicalTraders.com, my team and I can do these things:

  • Safely navigate the commodity and crude oil trend.
  • Reduce your FOMO and manage your emotions.
  • Have proven trading strategies for bull and bear markets.
  • Provide quality trades for investing conservatively.
  • Tell you when to take profits and exit trades.
  • Save you time with our research.
  • Proved above-average returns/growth over the long run.
  • Have consistent growth with low volatility/risks.
  • Make trading and investing safer, more profitable, and educational.

Sign up for my free trading newsletter so you don’t miss the next opportunity!

We invite you to join our group of active traders who invest conservatively together. They learn and profit from our three ETF Technical Trading Strategies. We can help you protect and grow your wealth in any type of market condition. Click on the following link: www.TheTechnicalTraders.com to learn how.

Chris Vermeulen
Chief Market Strategist

In the trader tip video, Brian talks about the Tesla TSLA trade setup of the week. Looking at the TSLA chart, we can see a downdraft and it’s about 40% or so off of its all-time highs. TSLA has also been consolidating, going sideways, and finding its own support over the last month or so. We can even see a double bottom now.

With that being said, that is an opportunity to do a put vertical credit spread. This trade structure gives us a little bit of room to be wrong. We can be out of the trade before the next earnings report.

TO LEARN MORE ABOUT TSLA trade setup – WATCH THE VIDEO

Subscribers: Please let us know what you would like to learn and we will add it to the roster of our weekly Technical Trader Tips!

Non-subscribers: Please enjoy these micro-lessons as a way to further your education and understanding of how a technical trader…well…trades!

TO EXPLORE THE Strategies That Brian Uses, PLEASE VISIT The technical traders. You’vE GOT MORE TO GAIN THAN TO LOSE WHEN SEEKING INFORMATION!

Disclaimer: None of this material is meant to be construed as investment advice. It is for education and entertainment purposes only. The video is accurate as of the posting date but may not be accurate in the future.

In the trader tip video, Chris talks about the solar sector ETF TANs trade setup. TAN was one of the strongest sectors back in 2020 after the covid crash. We saw almost a 500% rally in this sector and since then it has sold off and a very big way.

Recently, TAN has been forming what looks to be a bottoming formation known as a double bottom. Based on this pattern, there are a lot of upside targets. One of the reasons why we are seeing the TAN sector do well is that it is clean energy and alternative energy to the high crude oil prices. As people continue to worry about high fuel costs, they begin to explore other energy and income solutions.

TO LEARN MORE ABOUT TAN trade setup – WATCH THE VIDEO

Subscribers: Please let us know what you would like to learn and we will add it to the roster of our weekly Technical Trader Tips!

Non-subscribers: Please enjoy these micro-lessons as a way to further your education and understanding of how a technical trader…well…trades!

TO EXPLORE THE Total ETF Portfolio, PLEASE VISIT US AT The technical traders. You’vE GOT MORE TO GAIN THAN TO LOSE WHEN SEEKING INFORMATION!

Disclaimer: None of this material is meant to be construed as investment advice. It is for education and entertainment purposes only. The video is accurate as of the posting date but may not be accurate in the future.

Chris Vermeulen of TheTechnicalTraders sits down with David Lin, Anchor for Kitco News to discuss gold and gold miners’. Precious metals, gold, and gold miners have all been out of favor this year. We saw panic selling hit the stock market and massive liquidation which pulled them down.

This time around, we are seeing record amounts of cash being stock-pilled. The big money just wants to sit in cash for the time being. That is because the general investors and the masses are getting really nervous. Overall, volatility continues to expand for gold. As a trade, it could be really good in about a month or two.

Chris and David also discuss:

  • Asset Allocation
  • Shorting the market
  • Bear markets and how to trade during one
  • The four stages of markets
  • The outlook for the stock market

TO LEARN MORE ABOUT GOLD AND GOLD MINERS, Bear Markets & market stages WATCH THE VIDEO

TO EXPLORE THE Total ETF Portfolio, PLEASE VISIT US AT The technical traders. You’vE GOT MORE TO GAIN THAN TO LOSE WHEN SEEKING INFORMATION!

Disclaimer: None of this material is meant to be construed as investment advice. It is for education and entertainment purposes only. The video is accurate as of the posting date but may not be accurate in the future.

We are only 6-months into the year, and it seems like the inflation boom is quickly going bust.

The last few months have been very interesting as we see traders (rotating) moving out of one investment or market and into another. But as losses mount and capital diminishes, traders are eventually forced to liquidate even their favorite holdings to meet margin calls and raise needed cash.

As followers of pricing, our opinions or forecasts are not of much value. What is important is price, as price directly determines our trading profits or losses.

When market conditions change or at times when our trading begins to rack up losses, the best thing we can do as a professional is to go to cash. Going to cash allows us to get our perspective back. It allows us the possibility to enter the markets once more and provides the potential to make a lot of money.

Markets go up, and markets go down. What makes the big difference is how we manage risk and how well we do in following the direction of price. Knowing and controlling one’s emotions dictates how long we can play the game or how successful we will be at it.

As we review a few interesting and relevant long-term weekly charts, we realize that for many of us, the best option is simply to go to cash, watch, and wait.

FOOD: WHEAT -23.74%

  • Wheat had a 5-year run gaining more than $8 a bushel.
  • From December 2021 to March 2022, it gained more than $4 a bushel.
  • In March 2022, it made a 14-year double top at $12.
  • From its peak, it has now been trending lower for 31 weeks.
  • Wheat is a good indicator of the level of consumer food inflation.

WHEAT CFD • WHEATUSD • OANDA • WEEKLY

Wheat CFD weekly chart

HOUSING: LUMBER -67.14%

  • Random length lumber futures experienced a 14-month exponential rally.
  • From its March 2020 Covid low it has rallied $1403 for a 500%+ gain.
  • It is now down $1125 or -67.14% from its May 2022 peak.
  • Lumber is a good indicator of the health of the new housing construction market.

RANDOM LENGTH LUMBER FUTURES • CONTINUOUS • LBS1! • WEEKLY

Random Length Lumber Futures Chart

AUTOS: PLATINUM -29.15%

  • Platinum experienced an 11-month rally that now has fizzled rather quickly.
  • From its Covid 2020 low its price had more than doubled.
  • It is now down -$376 per ounce or -29.15% from its February 2021 peak.
  • Platinum is a good indicator of the health of the new automotive sales market where most auto manufacturer stocks have also lost more than -30% from their price peaks.

PLATINUM USD • XPTUSD • OANDA • WEEKLY

Platinum USD Weekly Chart

VALUABLE INSIGHTS FROM SUCCESSFUL TRADERS

Market Wizards by Jack D Schwager (www.Amazon.com) is packed with insights from successful traders who have shared their wisdom based on firsthand trading experiences. Here are a few of our favorites:

Jim Rogers:

  • “There is no such thing as a paper loss.” “A paper loss is a very real loss.”
  • “When government measures are implemented to counteract a trend, you should sell the rally after the government action.”
  • “The markets are the same, they go up and down.”

Mark Weinstein:

  • “Knowing when to stay out of the markets is as important as knowing when to be in them.”
  • “Limit losses quickly.”
  • “When institutions and specialists sell out, they don’t sell out at one price level, they scale out as the markets go up.”

Brian Gelber:

  • “It doesn’t matter if my opinion is right or wrong.”
  • “All that matters is whether I make money.”
  • “It is a good habit to wipe the slate clean and start fresh.”

WHAT STRATEGIES CAN HELP YOU NAVIGATE THE CURRENT MARKET TRENDS?

Learn how we use specific tools to help us understand price cycles, set-ups, and price target levels in various sectors. Also, learn how we identify strategic entry and exit points for trades. Over the next 12 to 24+ months, we expect very large price swings in the US stock market. The markets have begun to transition away from the continued central bank support rally phase and have started a revaluation phase as global traders attempt to identify the next big trends. Precious Metals will likely start to act as a proper hedge as caution and concern begin to drive traders/investors into Metals and other safe-havens.

Historically, bonds have served as one of these safe-havens. This is not proving to be the case this time around. So if bonds are off the table, what bond alternatives are there? How can they be deployed in a bond replacement strategy?

HOW WE CAN HELP YOU LEARN TO INVEST CONSERVATIVELY

At TheTechnicalTraders.com, my team and I can do these things:

  • Safely navigate the commodity and crude oil trend.
  • Reduce your FOMO and manage your emotions.
  • Have proven trading strategies for bull and bear markets.
  • Provide quality trades for investing conservatively.
  • Tell you when to take profits and exit trades.
  • Save you time with our research.
  • Proved above-average returns/growth over the long run.
  • Have consistent growth with low volatility/risks.
  • Make trading and investing safer, more profitable, and educational.

Sign up for my free trading newsletter so you don’t miss the next opportunity!

We invite you to join our group of active traders who invest conservatively together. They learn and profit from our three ETF Technical Trading Strategies. We can help you protect and grow your wealth in any type of market condition by clicking on the following link: www.TheTechnicalTraders.com

Chris Vermeulen
Chief Market Strategist
Founder of TheTechnicalTraders.com

The recent downward Crude Oil trend may have caught many traders by surprise. Just before the US Fed raised interest rates on June 15, 2022, Crude oil was trading above $120ppb. Less than 5 days later, it collapsed -12% and has continued to trend lower. Currently, Crude Oil is near -17% lower than recent highs.

It appears Crude Oil has confirmed resistance near $120 and is devaluing as consumers pull away from traditional driving/spending habits while the Fed aggressively attempts to burst the inflation bubble. This type of contraction in Crude Oil is very similar to what happened in 2008-09 when the Global Financial Crisis (GFC) hit – Crude Oil collapsed more than -70% after IYC started trending lower in 2007.

Consumer Discretionary Spending May Be Leading Crude Oil Downward

On June 9, 2022, I published a research article (CRUDE OIL PRICE AND CONSUMER SPENDING – HOW THEY ARE RELATED) highlighting the correlation between Crude Oil and the Consumer Discretionary ETF (IYC). In this article, I suggested any breakdown in IYC, below $60, may prompt a broad downward price trend in Crude Oil – possibly targeting the $75 to $85 price level.

Looking at this chart from our June 9, 2022 article, we can see IYC has already fallen more than -34% from recent highs. In 2007, peak oil prices were reached well before IYC declined more than -22%. So, in this case, the recent decline in IYC may already be predicting a downward price trend in Crude Oil – possibly targeting levels below $80 eventually.

Crude Oil and IYC Chart

(Our Crude Oil/IYC Chart from the June 9, 2022 article)

Aggressive Fed Action May Prompt Extreme Consumer Actions

In an oddly similar way, the 2008-09 GFC represented an extreme excess/speculative phase in the US Credit/Housing markets. Today, we see many similar facets after the COVID-19 event – where house prices skyrocketed from +25% to +45% in some areas. Additionally, prior to 2007-08, we saw moderately high inflation levels, Crude Oil was trading above $100 ppb, certain commodities were in very high demand, and consumers were spending aggressively on almost everything.

Today, we see a combination of some factors from the GFC as well as the DOT COM bubbles. Not only have house prices and raw commodities seen incredible rallies over the past 5+ years, but the Technology and Innovation sectors have also been leading market gains as well. Bitcoin rallied from under $1000 to a high of nearly $70,000 over the past 5+ years. The excessive speculation in the global markets recently is clearly evident in many various sectors and assets.

Global Central Banks Are Running The Show (Again)

I believe the US Federal Reserve will continue to raise rates aggressively in an attempt to tame inflationary trends. At the same time, we are likely to see many Global Central banks attempt to follow the US Fed in raising rates. This creates an economic environment many traders are unprepared for – an extended stagflation/recession period.

The downward trend in Crude Oil and IYC may be the “canary” for the global economy and what to expect going forward. When consumers pull away from traditional pending habits, we are likely to see a broad contraction in global GDP and other economic factors.

Traders and investors need to stay cautious of various global market trends and move back towards a more traditional method of managing their capital. The global markets are still 3x to 5x more volatile than at any time in recent history. Any aggressive trading style could lead to massive losses – as we are likely to see in many global Hedge Funds and managed accounts.

LEARN FROM OUR TEAM OF SEASONED TRADERS

With the market environment and crude oil trend, it’s imperative to assess our trading plans, portfolio holdings, and cash reserves. As professional technical traders, we always follow price. At first glance, this seems very straightforward and simple. But emotions can interfere with a trader’s success when they buck the trend (price). Remember, our ego aside, protecting our hard-earned capital is essential to our survival and success.

Successfully managing our drawdowns ensures our trading success. The larger the loss, the more difficult it will be to make up. Consider the following:

  • A loss of 10% requires an 11% gain to recover.
  • A 50% loss requires a 100% gain to recover.
  • A 60% loss requires an even more daunting 150% gain to simply break even.

Recovery time also varies significantly depending upon the magnitude of the drawdown:

  • A 10% drawdown can typically be recovered in weeks to a few months.
  • A 50% drawdown may take many years to recover.

Depending on a trader’s age, they may not have the time to wait nor the patience for a market recovery. Successful traders know it’s critical to keep drawdowns with reason, as most have learned this principle the hard way.

HOW WE CAN HELP YOU LEARN TO INVEST CONSERVATIVELY

At TheTechnicalTraders.com, my team and I can do these things:

  • Safely navigate the commodity and crude oil trend.
  • Reduce your FOMO and manage your emotions.
  • Have proven trading strategies for bull and bear markets.
  • Provide quality trades for investing conservatively.
  • Tell you when to take profits and exit trades.
  • Save you time with our research.
  • Proved above-average returns/growth over the long run.
  • Have consistent growth with low volatility/risks.
  • Make trading and investing safer, more profitable, and educational.

Sign up for my free trading newsletter so you don’t miss the next opportunity!

We invite you to join our group of active traders who invest conservatively together. They learn and profit from our three ETF Technical Trading Strategies. We can help you protect and grow your wealth in any type of market condition by clicking on the following link: www.TheTechnicalTraders.com

Chris Vermeulen
Chief Market Strategist
Founder of TheTechnicalTraders.com

Market trends continue to drop due to investor concerns about geopolitical events, record inflation, rising interest rates, slowing housing, plummeting auto sales, increasing retail inventories, expanding consumer credit, and pending layoffs.

Even stocks that had previously held up or remained strong now seem to be showing signs of topping and breaking down. This is normal behavior for a bear market trend where the initial wave of vulnerable markets takes a hit which then causes traders to shelter their remaining cash in more robust markets. But as losses mount and their capital diminishes, traders eventually are forced to liquidate even their strong market assets to meet margin calls and raise needed cash.

As we review the following market trends, we quickly realize that the best option for most traders is to simply go to cash, watch, and wait.

BERKSHIRE HATHAWAY -25.34%

  • BRK was one of the few companies in the early part of Q1 2022 that bucked the downtrend and had remained strong. 
  • By the end of Q1 2022, BRK had put in a top that was greater than 200% of its Covid 2020 low. 
  • Now, as we approach the end of Q2 2022, BRK has lost -25.34% and is down -10.34% year-to-date.

BERKSHIRE HATHAWAY INC • BRK.A • NYSE • DAILY

Berkshire Hathaway Trend Chart

QQQ NASDAQ 100 ETF -33.16%

  • QQQ put in its top at the very end of Q4 2021 primarily due to rising inflation and the strong US dollar. 
  • After its initial Q1 2022 drop of -21.6%, QQQ had a rally back up, which was a 61.8% correction to put in a lower top. 
  • Now, as we approach the end of Q2 2022, QQQ has lost -33.16% and is down -30.98% year-to-date.

INVESCO QQQ TRUST SERIES 1 ETF • TBF • ARCA • DAILY

QQQ Nasdaq Trend Chart

RUSSELL 2000 INDEX -32.23%

  • The Russell 2000 index (comprised of 2,000 small-cap companies) put in its top at the very end of Q4 2021 due to rising inflation and the strong US dollar. 
  • After its initial Q1 2022 drop of -20.93%, the Russell had a rally back up, which was a 38.2% correction to put in a lower secondary top. 
  • Now, as we approach the end of Q2 2022, the Russell has lost -32.23% and is down -25.81% year-to-date.

US RUSSELL 2000 STOCK INDEX • OANDA • DAILY

Russell 2000 Index Trend Chart

BITCOIN -71-87%

  • Bitcoin put in its final top at the very end of Q4 2021. 
  • Bitcoin had a 68-day rally back up, which only corrected about 35% of its initial down move to put in a lower secondary top. 
  • Now, as we approach the end of Q2 2022, Bitcoin has lost -71.87%.

BITCOIN / US DOLLAR • BTCUSD • BITFINEX • DAILY

Bitcoin Trend Chart

VALUABLE INSIGHTS FROM SUCCESSFUL TRADERS

Market Wizards by Jack D Schwager (www.Amazon.com) is packed with insights from successful traders who have shared their wisdom based on firsthand trading experiences. Here are a few of our favorites:

Willian O’Neil:

  • “You have to cut your losses fast.”
  • “You should be able to win even if you are right only half the time.”
  • “The key is to lose the least amount of money possible when you are wrong.”

David Ryan:

  • “A rigid stop-loss rule is an essential ingredient to the trading approach of many successful traders.”

Marty Schwartz:

  • “One of the tactics in the Marine Corps officer’s manual is either go forward or backward.”
  • “Don’t just sit there if you are getting the hell beat out of you.”
  • “Even retreating is offensive, because you are still doing something.”
  • “As a trader, you a forced to confront your mistakes because the numbers don’t lie.”
  • “The most important thing is money management, money management, money management.”
  • “I try not to go against the moving averages; it is self-destructive.” “Is the price above or below the moving average?” “That works better than any tool I have.”

LEARN FROM OUR TEAM OF SEASONED TRADERS

In today’s market trend environment, it’s imperative to assess our trading plans, portfolio holdings, and cash reserves. As professional technical traders, we always follow price. At first glance, this seems very straightforward and simple. But emotions can interfere with a trader’s success when they buck the trend (price). Remember, our ego aside, protecting our hard-earned capital is essential to our survival and success.

Successfully managing our drawdowns ensures our trading success. The larger the loss, the more difficult it will be to make up. Consider the following:

  • A loss of 10% requires an 11% gain to recover.
  • A 50% loss requires a 100% gain to recover.
  • A 60% loss requires an even more daunting 150% gain to simply break even.

Recovery time also varies significantly depending upon the magnitude of the drawdown:

  • A 10% drawdown can typically be recovered in weeks to a few months.
  • A 50% drawdown may take many years to recover.

Depending on a trader’s age, they may not have the time to wait nor the patience for a market recovery. Successful traders know it’s critical to keep drawdowns with reason, as most have learned this principle the hard way.

HOW WE CAN HELP YOU LEARN TO INVEST CONSERVATIVELY

At TheTechnicalTraders.com, my team and I can do these things:

  • Reduce your FOMO and manage your emotions.
  • Have proven trading strategies for bull and bear markets.
  • Provide quality trades for investing conservatively.
  • Tell you when to take profits and exit trades.
  • Save you time with our research.
  • Proved above-average returns/growth over the long run.
  • Have consistent growth with low volatility/risks.
  • Make trading and investing safer, more profitable, and educational.

Sign up for my free trading newsletter so you don’t miss the next opportunity!

We invite you to join our group of active traders who invest conservatively together. They learn and profit from our three ETF Technical Trading Strategies. We can help you protect and grow your wealth in any type of market condition by clicking on the following link: www.TheTechnicalTraders.com

Chris Vermeulen
Chief Market Strategist
Founder of TheTechnicalTraders.com

US and Global markets recoiled from the higher inflation/CPI data last week. The US Fed raised interest rates by 75pb on June 15. The Fed also warned that other, more aggressive rate increases might be necessary later this year. Before the Fed decision, global markets opened on Sunday, June 12, and quickly started selling downward. US Indexes sold off on Monday, June 13, by more than 2.5% almost across the board. A brief rally after the Fed decision seems to have evaporated in early trading on Thursday, June 16.

It is clear that global markets expected inflation to stay elevated but were hoping for some moderately lower data showing the recent Fed moves had already dented some inflation concerns. Now, it appears the US Fed has its backs against a wall and moved rates aggressively higher to stall inflation (and possibly destroy global asset values). From my perspective, this is unknown territory for the US Fed and Global Central banks. That means traders should expect increased volatility and the possibility of a very determined reversion of price over time.

Another Global Financial Crisis May Be Unfolding

The research conducted by my team and I shows some interesting new data. In particular that the US Current Account data is very near to the levels reached just before the Global Financial Crisis (GFC) in 2006 (near -$218B). I consider this a very clear sign that the US economy, inflation, consumer engagement, and asset values have continued to hyper-inflate since the COVID-19 virus event.

The chart below highlights the US Current Account data and the Dow Jones Industrial (DJI) Average price data. Notice how the lowest level of the US Current Account data reached a deep trough (September 2006) about 12 months before the absolute peak in the DJI (September 2007). This time, the US Current Account trough formed in September 2021, and the peak in the DJI happened in December 2021 – only 3~4 months later.

US current account data and Dow Jones Daily chart

The global markets have continued to consume cheap US Dollar liabilities over the past 10+ years as the US Fed kept interest rates very low for an extended period. Not only did this feed an extreme global speculative phase, but it also created an extreme credit/debt liability issue throughout the globe as rates increased. Debt holders are forced to roll debt forward at higher rates if they cannot pay off these liabilities completely – being over-leveraged. This same scenario is very similar to how the GFC started. Over-leveraged speculative trading in Mortgage-Backed Securities and other global assets.

Skilled Traders Saw This Problem Many Years In Advance

I’ve been informing my subscribers that an event like this was starting to take place throughout 2020 and 2021. Below, are some of the articles posted in our blog warning traders that the global markets were transitioning away from the endless bullish price trends from 2011 through 2021.

NASDAQ May Fall To $9,750 Before Attempting To Find Any Support

The Technology Sector is leading the downward price trend in the US major indexes. The NASDAQ could fall to levels close to $9,750~10,750 before attempting to find any real support.

Ultimately, the NASDAQ may fall to levels near the COVID-19 lows, near $6,500. But right now, the most logical support level exists just above the COVID-19 2020 highs.

NASDAQ E-Mini Futures Weekly Chart

I expect this new global price revaluation may last throughout the rest of 2022 and possibly carry into early 2023. It depends on what the US Fed does and how this event unfolds. If there is an orderly unwinding of excesses in the markets, we may see an extended decline as global expectations transition to new normal economic expectations. If a new crisis event blows a massive hole in the global economy, like in 2008-09, a very sudden decline may occur – shocking the global markets.

My research suggests the US Fed is far behind the curve and has allowed the excess speculative rally to carry on for too long. Global Central Banks should have been raising rates to moderate levels near the end of 2020 and in early 2021. Now, we have an excess phase bubble similar to the DOT COM and GFC events merged. We have an extreme Technology Bubble and an excess global credit/liability bubble.

If you have not already adjusted your assets to protect from downside risks, it’s time. When doing so, please consider the long-term risks of trying to ride out any extended downtrend in price. Are you willing to risk another -25% to -40% of your assets, hoping the global markets find a bottom soon?

WHAT STRATEGIES CAN HELP YOU NAVIGATE THE CURRENT MARKET TRENDS?

Learn how we use specific tools to help us understand price cycles, set-ups, and price target levels in various sectors. Also, learn how we identify strategic entry and exit points for trades. Over the next 12 to 24+ months, we expect very large price swings in the US stock market. The markets have begun to transition away from the continued central bank support rally phase and have started a revaluation phase as global traders attempt to identify the next big trends. Precious Metals will likely start to act as a proper hedge as caution and concern begin to drive traders/investors into Metals and other safe-havens.

Historically, bonds have served as one of these safe-havens. This is not proving to be the case this time around. So if bonds are off the table, what bond alternatives are there? How can they be deployed in a bond replacement strategy?

Sign up for my free trading newsletter so you don’t miss the next opportunity!

We invite you to join our group of active traders who invest conservatively together. They learn and profit from our three ETF Technical Trading Strategies which include a real estate ETF. We can help you protect and grow your wealth in any type of market condition. Click the following link to learn more: www.TheTechnicalTraders.com

Chris Vermeulen
Chief Market Strategist
Founder of TheTechnicalTraders.com