In recent weeks we have seen TSLA and NVDA make parabolic moves and are crashing to the upside. With the incredible market run we have had since 2008, many, including me, did not see this coming. The big question looms here: What is fueling these markets higher now after such a significant bull run?
The answer is that we are being squeezed up. As an options trader, I pay close attention to the options markets and how they affect the broader markets. Every time an options contract is bought, there is a series of events that occur. So let’s go through that real quick.
Options Contract Process
If we bought one at the money call of, let’s say TSLA, we procure that from a market maker. That market maker is not in the business of taking a massive risk, so they will buy 100 shares of TSLA and profit on the difference in the price of the options to the stock. So when we see TSLA or NVDA stock price making a 5-6 sigma move and wonder who is buying the top, indirectly it is retail traders who are buying call options in TSLA and NVDA. We have so many new traders in the markets who are jumping in and buying a TSLA call because it always goes up!
Think about this; we have had one of the most significant pandemics ever with substantial economic impacts, people not working, less economic activity, and yet the markets are continually reaching all-time highs. So what do we do here? Do we do the traditional buy-and-hold strategy buying at record highs? Do we start shorting the markets because they are at all-time highs and watch them continue to defy logic and continue their ascent as we lose?
The answer to all this is we trade the markets – like TSLA and NVDA. We trade by getting in and getting out and limiting our market exposure until this corrects. We can get the same return as the traditional buy and hold with WAY less risk by trading, and we can do that using options and option strategies.
TSLA & NVDA – Learn Before You Earn
Every day on Options Trading Signals, we do defined risk trades that protect us from black swan events 24/7. Many may think that is what stop losses are for. Well, remember the markets are only open about 1/3 of the hours in a day. Therefore, a stop loss only protects you for 1/3 of each day. Stocks can gap up or down. With options, you are always protected because we do defined risk in a spread. We cover with multiple legs, which are always on once you own.
If you are new to trading or have been trading stock but are interested in options, you can find more information at The Technical Traders – Options Trading Signals Service. The head option’s trading specialist Neil Szczepanski, who has been trading options for almost 20 years, sends out real live trade alerts on actual trades, such as TSLA and NVDA, with real money. Come check it out here: TheTechnicalTraders.com.
Enjoy your day!
Chris Vermeulen Founder & Chief Market Strategist TheTechnicalTraders.com
https://thegoldandoilguy.com/wp-content/uploads/2021/11/options-e1636471121734.jpg265400adminhttp://www.thegoldandoilguy.com/wp-content/uploads/2014/11/tgaoglogo.pngadmin2021-11-09 17:26:452021-11-09 17:26:52What Keeps Driving These Markets Up
On Wednesday, January 28, 2015 it was early afternoon during the trading day and I arose from my screens to go grab a drink out of my refrigerator. In the process of grabbing a drink, I went out to see what came in the mail and to get a few moments of fresh air before the final hours of a fairly quiet trading day were through.
Upon reentering my office, I noted that my screens were flashing red and the S&P 500 was under assault from the sell side. I scanned several independent blogs I follow for a headline and came across nothing. It was at this moment that I did the unthinkable and I turned on CNBC. I am embarrassed to even admit it frankly, because the drivel CNBC and most of the financial media spew out might as well be sales material for the sell side and their “long-term investment view that is always bullish”.
I saw the S&P 500 under pressure and then a subsequent bounce occurred. Nothing major, not even what I would call a major retracement, just some short sellers locking in a few profits I presumed. To my absolute horror, seconds later I recall seeing the headline at the bottom of the television screen on CNBC dictating that “stocks were off their lows”. It is no wonder CNBC’s ratings are absolutely terrible.
While I am picking on CNBC, the mainstream financial media is just awful. In fact, I do everything in my power to ignore all sources from televised media such as CNBC and Fox Business to written media like the Wall Street Journal. In every case, every day stocks are going higher and they can never go down. Certainly with central bank omnipotence and sorcery, it will not be long before no one has to work and we will just own long only stock portfolios. [Sarc :)]
Regardless, I am an options trader who has weathered the storm fairly well. I sell premium, focus on implied volatility, and I use probability to build my trades. My style is similar to Tom Sosnoff’s for those following him on TastyTrade or Dough, but I mix in a few twists. Regardless of my trading style, I have a strong historical track record that I am proud of which has handily beaten the markets for several years, although 2014 was one of my worst year in recent memory.
The reason I mention this is simply to state that I am a trader first, and newsletter operator second. I am getting rich with my newsletter at $20 per month let me tell you. Honestly, I just send out trades. No fluff, no nonsense. I tell it like I see it and I admit when I am wrong. My trades typically have a 60% – 70% probability of success at the time of entry based on implied volatility calculations involving probabilities. At the end of the day, I trade options because I am a junkie . . . I absolutely love derivatives and trading them.
As such, some of my recent research at various independent blogs paired with what I can see in the options marketplace has led me to believe that the S&P 500 Index (SPX) is going lower in the next 6 – 12 months. I want to be clear that I am not calling for a crash nor am I saying that the S&P 500 Index will remain under pressure, I am just simply calling for a correction in the very near future, although the situation could deteriorate into something much worse potentially.
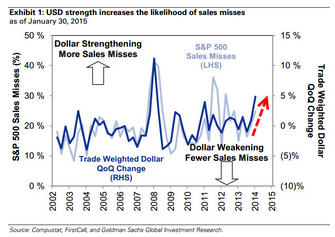
However, here are a few data points worth considering which were originally posted by Tyler Durden at www.zerohedge.com:
“Revenue results are correlated to dollar strengthening, which has led to weaker revenue results and lower forward guidance that incorporates the FX headwind.”
“Anecdotally, management commentary implies the dollar strengthening will lower revenue growth by 300-500 basis points. Foreign sales accounted for 33% of aggregate revenue for the S&P 500 in 2013. Based on our earnings model, a 10% strengthening of the trade-weighted dollar lowers S&P 500 2015 EPS by about $3.” To dig deeper into this, click HERE to view the entire article.
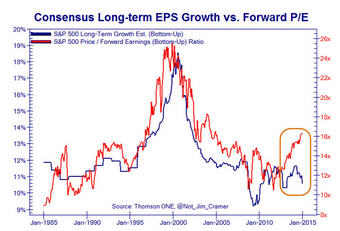
Obviously a strengthening U.S. Dollar is likely to push stocks lower based purely on earnings. However, valuations also matter and according to the same zerohedge.com article, “Consensus long-term growth estimates are slumping… which means multiple expansion is the only way to keep the dream of wealth creation alive.”
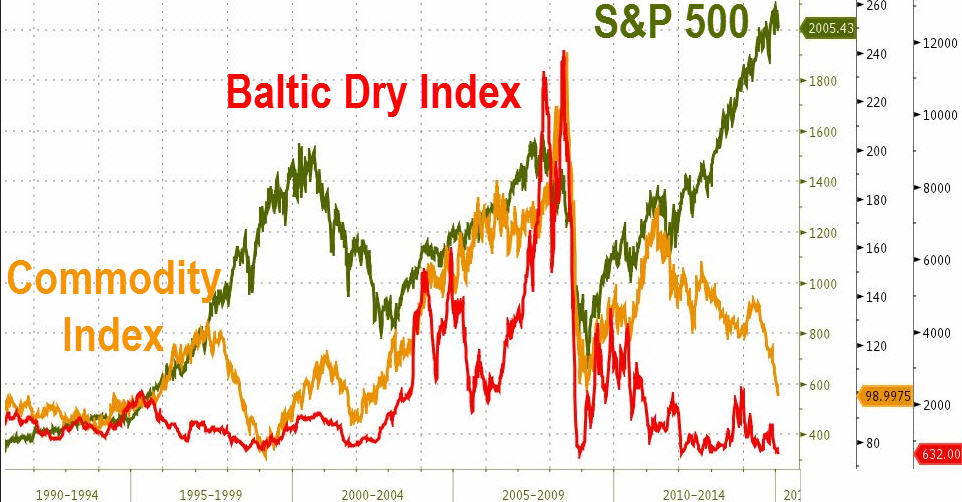
I have to say that I get a great deal of sound, independent information from zerohedge.com which I find to be very useful for formulating trades. One more interesting chart I found over the weekend in a totally different post on their blog is shown below:
So according to more than one article on zerohedge.com, the fundamental picture for earnings is being weighed down by a strong U.S. dollar. The earnings and valuation backdrop in the same article is also concerning in the intermediate to longer-term. Lastly, when looking at the correlation between the Commodity Index and the Baltic Dry Index, we see a sudden shift that places the S&P 500 Index in a major divergence compared to historic norms. Now that I have leaned heavily on zerohedge.com to handle the fundamental side of my research, it is time to dig into the derivatives side of the trade equation.
When looking at the S&P 500 Cash Index Options (SPX), another interesting observation is notable. When looking out to the June monthly expiration and Friday’s closing price in the S&P 500 Cash Index of 1,995, an interesting standard deviation skew appears. The June 1,525 Put is exactly 2 standard deviations from the current price on the downside. The June 2,200 Call is also 2 standard deviations from the current price.
This means that the market is pricing in about 205 points of upside or about 10.27% potential upside. Conversely, the two standard deviation move to the downside is roughly 400 points or about or roughly 20.04% potential downside. I would point out that the marketplace is pricing in a move of almost 2 times the severity on the downside in the S&P 500 Cash Index options. Pair this market expectation with the fundamental data discussed above, and the potential for serious downside does exist.
I want to be clear that I am already leaning short the S&P 500 Cash Index (SPX) in my portfolio as my beta weighted Delta against the S&P 500 Cash Index (SPX) is negative overall. However, I have not taken an actual short position in the S&P 500 Cash Index (SPX) or its cousin, SPY . . . at least not yet.
However, after seeing the U.S. Dollar strengthen recently I was able to enter a February call credit spread in EEM (Positive Time Decay / Profitable if EEM moves lower) for the members only portfolio. That trade will likely be closed for some strong profits in a short period of time. The option trade was taken on January 23rd for a credit of 0.37 per spread.
Members of our ETF trading newsletter also has a position in an emerging market fund that is setting up for potential 60% move!
The trade could have been closed on Friday for 0.06 debit per spread. The difference, representing the profit on the trade is 0.31 or $31 per spread. The maximum risk per spread was $113, so the actual return based on maximum risk was 27.43% based on Friday’s closing prices. While this is a great return, not every trade works this well and produces profit this quickly.
While I will be locking in profits in the EEM February Call Credit Spread early this coming week, I intend to take a similarly bearish trade in the S&P 500 in the near future. I may look to go out as far as March expiration to take in additional premium and to buy myself a little more room on my upside breakeven price. However, I will likely move the overall portfolio to a slightly more negative bias in the near future.
Going forward, when I highlight trades I intend on discussing the trade structure used in the future as well as an ongoing account as to which trades were profitable and which trades did not work. I am excited about the service I am offering and the new, no-nonsense pricing model. I realize newsletters are really a dying business model, but I simply have too much fun writing about my trades and running the service. Granted a little extra spending money never hurt anyone, but I am having too much fun to quit!
https://thegoldandoilguy.com/wp-content/uploads/2015/02/Chart1.jpg237335adminhttp://www.thegoldandoilguy.com/wp-content/uploads/2014/11/tgaoglogo.pngadmin2015-02-06 14:33:292015-02-19 18:24:26The S&P 500 Is Going Lower . . . Sooner Rather than Later
By now it is no secret that equity markets continue to deliver solid gains for 2014. In fact, all of the major U.S. domestic stock market indexes are higher for the year. U.S. equities have benefited from an accommodating Federal Reserve, massive corporate stock buy-back plans, and solid earnings growth. The bullish trend which began in early 2009 has pushed equity indexes to several all-time highs.
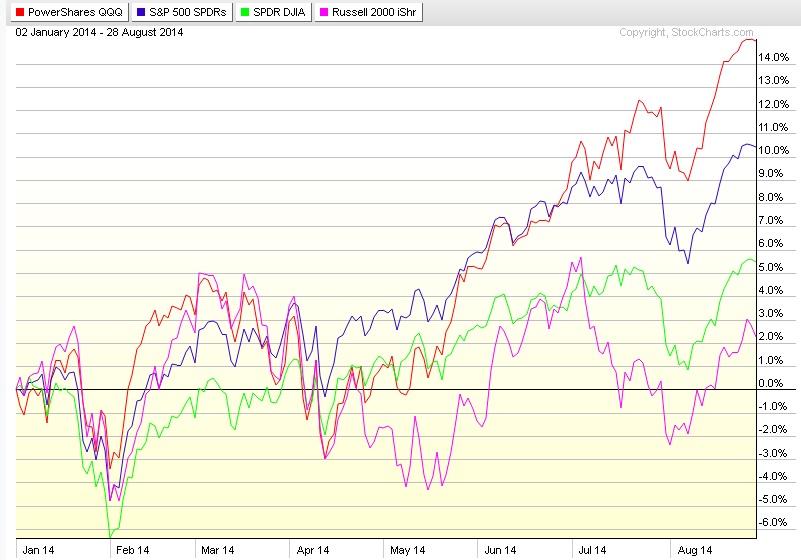
However, when we focus our attention on 2014 one index is showing major relative out performance. The Nasdaq Composite and the Nasdaq 100 indexes have blown away every other major index in terms of overall returns in 2014. The chart shown below illustrates the returns of each major U.S. equity index year-to-date.
As can be seen above, when looking at the corresponding ETF for each major index, the Nasdaq 100 (QQQ) is running away from every other major index in terms of performance. As a contrarian trader, I am of the opinion that now may be an excellent time to consider looking for a possible short position to hedge against the bullish trend.
The equity markets in the United States are becoming frothy and prices are at the very least fair valued if not overvalued depending on which methods are used to calculate current prices. When we consider the major out performance in the Nasdaq 100 Index, it would only make sense that if we see downside in the future we could capture some big potential profits.
As an option trader who focuses primarily on probabilities for trade executions using a variety of implied volatility calculations and Delta assumptions, the following observations regarding the Nasdaq 100 Cash Index (NDX) were derived based on data points on Friday, August 29th.
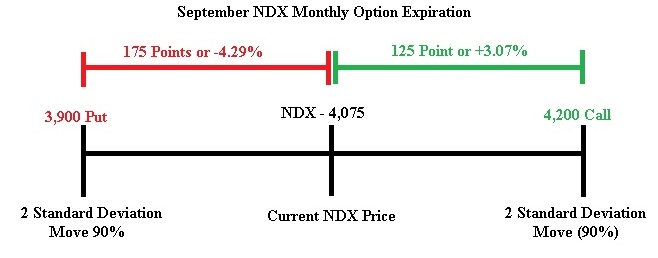
Based on the September NDX option expiration date, the current skew in the NDX option data is to the downside. In fact, as I am typing this NDX is trading around 4,075. A 2 standard deviation move to the upside (90%) is around the 4,200 call strike and the same measurement to the downside is around the 3,900 put strike.
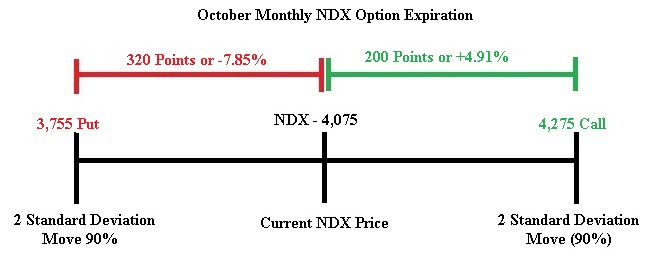
When looking at the same data based on the October NDX option expiration date, the current skew in the NDX option data demonstrates more aggressive downside Skew in October versus September. A 2 standard deviation move in the October series to the upside (90%) is around the 4,275 call strike and the same measurement to the downside is around the 3,755 put strike.
While I realize this is somewhat technical, the main premise is that the option market in the Nasdaq 100 Cash Index (NDX) is skewed toward more potential downside risk. This data lead me to place a new trade earlier this week which was next short the Nasdaq 100 Cash Index (NDX) using an October Call Credit Spread as a trade structure.
Recent results for the service have been very strong for the options alert service. The last 4 trades have produced a 13.95% winner in Matador Resources (MTDR), a 17.05% winner in the S&P 500 Cash Index (SPX), a small 1% loss in the Nasdaq 100 (QQQ), and a 21.95% in the Russell 2000 Cash Index (RUT). The options newsletter service is priced super affordable at just $29.99 per month with new trade alerts sent out almost daily.
Ultimately time will tell if the skew in the NDX proves to work. For now, I like the near 75% probability of success that the NDX Call Credit Spread is offering with a nearly 20% potential return. In the future readers can expect a recap of this trade. Happy Trading!
https://thegoldandoilguy.com/wp-content/uploads/2014/09/options.png151256adminhttp://www.thegoldandoilguy.com/wp-content/uploads/2014/11/tgaoglogo.pngadmin2014-09-02 12:56:112014-09-02 12:56:11Option Skew Points to More Downside Potential in the Nasdaq
Most traders follow the S&P 500 Index closely, but few equity or futures traders are able to structure trades that are profitable based solely on the passage of time. Option traders use a variety of trade structures, called credit spreads to actually make the passage of time a profitable endeavor. Unfortunately there is one catch . . . the price of the underlying asset has to cooperate.
What many readers may find interesting is that I structure my option portfolio around being positive Theta. This essentially means that the portfolio collects option premium as time passes which will be converted into profits if prices cooperate. I attempt to consistently capture close to 1% of my account value per day in positive time decay.
Inquiring minds might ask how I accomplish this task.
The answer: multiple iron condor spreads. An iron condor spread is a credit spread where a trader takes a call credit spread and a put credit spread simultaneously. In many cases, the trader expects the underlying asset to consolidate or trade in a specific range.
I have several high probability iron condor spreads in my portfolio all the time. I trade the same trade structure using the same underlying assets over and over again. In many cases, I will have more than one iron condor spread on the same underlying asset on my books at the same time. The underlying assets that I focus my iron condor strategy around are primarily index options and index etf’s.
I trade the S&P 500 cash index (SPX), the Russell 2000 cash index (RUT), the Nasdaq 100 ETF QQQ, and the Dow Jones Industrial Average ETF which is DIA. These are just a few of the underlying assets that I trade using the iron condor strategy. I traditionally enter the trades at about 50 days to expiration using a probability of success of around 80%. Most of the time, the broader index would have to move roughly 2 standard deviations from the current price at entry to create losses in my portfolio.
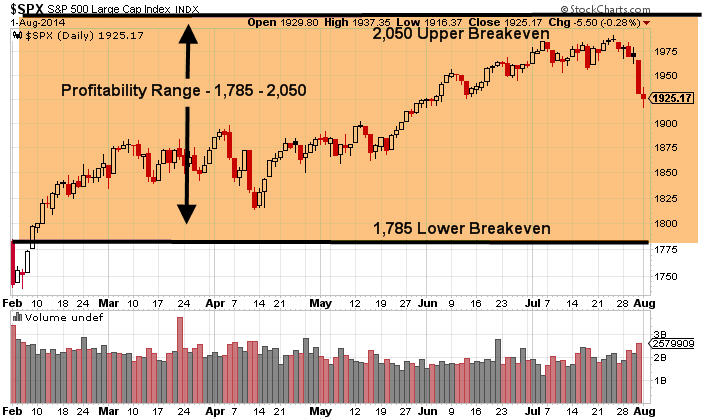
Back in early July I entered an August SPX Iron Condor Spread which presently is boasting profits of around 10% on maximum potential risk. However, I wanted to show readers that recently I entered a September SPX Iron Condor Spread with about 50 days to expiration. The probability of success was around 80% for the trade to be profitable. The following chart of the S&P 500 demonstrates the price range where the new September SPX Iron Condor Spread will be profitable if held to expiration.
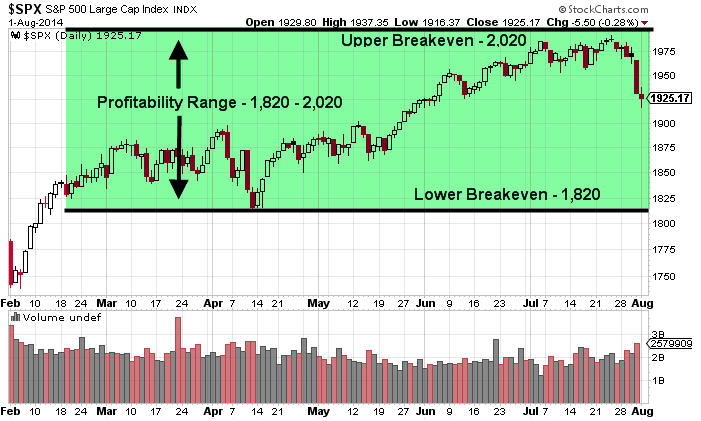
As can be seen above, the new September SPX Iron Condor Spread is profitable as long as the SPX price stays between 1,785 – 2,050. The trade was entered on July 22nd in addition to the August SPX Iron Condor Spread that I was holding at the time. The chart below shows the price range in the S&P 500 Cash Index (SPX) which will be profitable if both SPX iron condor spreads are held to expiration.
If both SPX spreads are held to expiration, the profitability range for both trades held simultaneously is 1,820 – 2,020. The probabilities are quite favorable that one if not both trades will be profitable at the August and September expirations.
The combined strategy offers a probability of close to 80% to make a positive return. Based on maximum possible risk, the typical return is between 10% – 15% depending on implied volatility changes during the holding period of the trade. At first glance, many traders write this strategy off as a poor strategy based on risk / reward. However, what other strategy offers nearly a 10% – 15% return on maximum risk with a near 80% probability of success at the time of entry?
When paired with other directional trades, having multiple, high-probability iron condor spreads on the books at the same time builds a high level of positive theta that helps support consistent portfolio profits. So far, the recently launched Technical Traders’ option service is boasting two closed trades thus far. Both trades that have been closed were quite profitable.
The first winning trade was in Facebook which was directional biased to the upside and a call diagonal spread was the trade structure chosen to use. The trade had a maximum risk of $493 per spread and produced a gross gain of $111, or 22.51% per spread. The other big winner was a FXE Put Butterfly Spread which was designed to profit partially from the passage of time and from lower FXE prices. The trade was entered with a maximum risk of $141 per spread and produced a gross gain of $53, or 37.59% per spread.
Overall, the new option service is off to a great start and currently has several additional trades which are profitable at this time. For more information, click the following link to check out the new cheaper, upgraded options service at: www.TheTechnicalTraders.com/options/
Chris Vermeulen
http://www.thegoldandoilguy.com/wp-content/uploads/2014/11/tgaoglogo.png00adminhttp://www.thegoldandoilguy.com/wp-content/uploads/2014/11/tgaoglogo.pngadmin2014-08-04 12:58:042014-08-04 12:58:04Using the S&P 500 to Profit from the Passage of Time
US Equities opened higher this morning and are setting up for a sharp pullback based on technical analysis using trends, cycles, momentum, volume, market breadth and key resistance zones.
Take a look at the charts below for a quick flash of what I think.
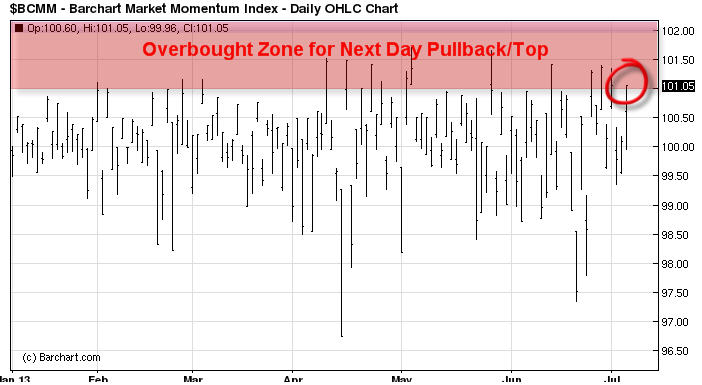
Barchart Market Momentum Index
This chart I look at daily. In short if its price is at 101 or higher I expect the broad market to pause or pullback within the next day. It tells me if stocks have moved to far in one direction on a daily basis and if so sellers (big money players) are likely to re-align stocks by taking profits or shorting during these times.
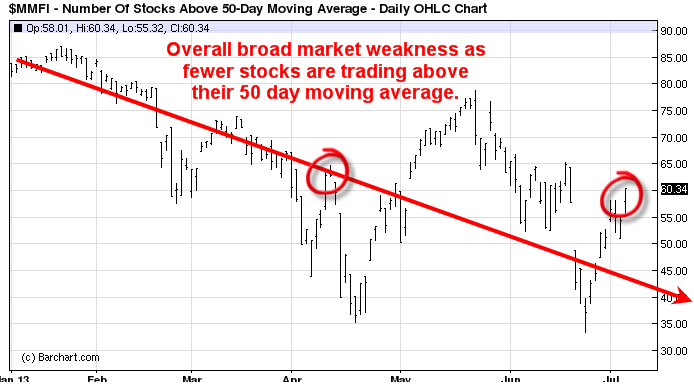
Stock Trading Above the 50 Day Moving Average
Here we can see that while the SP500 has been rising over the past 6 months less stocks are trading above their 50 day moving average. This means a smaller group of stocks is holding the market up and it’s just a matter of time before those stocks burn out and roll over also.
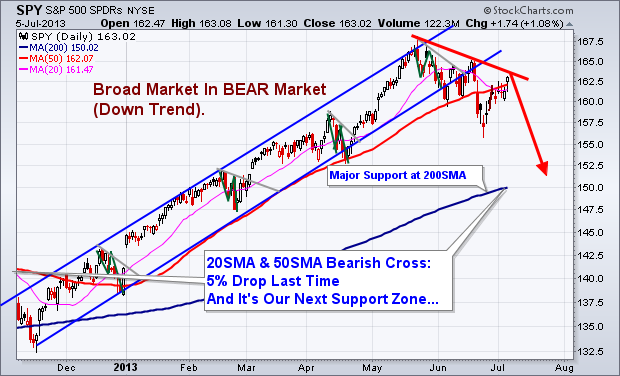
SPY Swing Trading Analysis – Daily Chart
With the SP500 breaking down from its trend channel and testing a short term resistance trend line. Odds favor sellers should become more active and pull the market down as they unload any remaining long positions and possibly get short the market. Both of these actions will put pressure on US Stocks.
Big Picture Outlook – Don’t Get Me Wrong!
This chart is just to show you what is possible. I am not a perma-bear nor do I want another bear market like this to happen. But knowing what is possible still has to be known. Major market tops are a lengthy process and tends to take several months. If this is the case then it could be a wild and choppy market for the rest of 2013 and a great way to play this is through writing options. Do not expect price to just collapse and free fall for 18 months… Dreams like that do not happen. Bear markets must be actively traded as they carry a lot of risk.
Flash Chart Analysis Conclusion:
This week is do or die for US stocks. We need sellers to step in here and pull stocks down. With the SP500 trading at resistance, stocks being overbought on a short term basis and the holiday week behind us which typically favors higher prices it is now time for sellers to become active once again.
http://www.thegoldandoilguy.com/wp-content/uploads/2014/11/tgaoglogo.png00adminhttp://www.thegoldandoilguy.com/wp-content/uploads/2014/11/tgaoglogo.pngadmin2013-07-08 10:47:442014-03-05 13:05:22The 30 Second Technical Flash Chart Report on US Equities
“You can’t feel the heat until you hold your hand over the flame.
You have to cross the line just to remember where it lays.”
~ Rise Against. “Satellite” Lyrics ~
Friday morning traders and market participants awaited the key January employment report from the U.S. Bureau of Labor Statistics. The reaction to the supposedly wonderful report was a surge in the S&P 500 E-Mini futures contracts as well as several other key equity index futures.
The overall tenor among the financial punditry was predictable as wildly bullish predictions permeated the morning session on CNBC and in the financial blogosphere. However, after the report had been out for several hours notable independent voices such as Lee Adler of the Wall Street Examiner came out with information that suggested the numbers were an apparition of manipulated statistics.
I am not going to spend a great deal of time discussing the report, but the reaction to the news was decisively bullish on Friday. The question I want to know is whether Friday was a blow off top? In the recent past the S&P 500 has seen several key inflection points and intermediate-term tops form on non-farm payroll monthly announcements.
I follow a variety of indicators to help me decipher more accurately when the market is getting overbought or oversold. For nearly two weeks the market has been extremely overbought, but now we are reaching truly astonishing levels. The following charts represent just a few signals that the market is due for a pullback and a top is likely approaching.
Percentage of NYSE Stocks Trading Above Their 50 Period Moving Average
The chart above clearly illustrates that as of Friday’s closing bell (02/03) over 89% of stocks were trading above their 50 period moving averages. Consequently that reading is one of the highest levels that we have seen in the past 3 years. In addition, over 73% of stocks that trade on the NYSE are currently priced above their longer-term 200 period moving averages. Another extremely overbought signal.
S&P 500 Bullish Percent Index Weekly Chart
The S&P 500 Bullish Percent Index is another great tool for measuring the overall position of the S&P 500. It is without question that the longer term time frame is reaching the highest level of overbought conditions in the past 3 years.
McClellan Oscillator Divergence with S&P 500 Price Action
The two charts shown above present an interesting situation regarding the divergence in the McClellan Oscillator and the price action in the S&P 500. The most recent example of this type of divergence occurred in October of 2011 and prices immediately reversed to the upside after several months of selling pressure. In fact, this correlation between reversals in the S&P 500 and divergences in the McClellan Oscillator works relatively well historically.
Clearly there are bullish voices arguing for the 2011 S&P 500 Index high of 1,370.58 to be taken out to the upside in the near future. Additionally, several market technicians in the blogospere have been pointing to the key resistance range between 1,350 and 1,370 on the S&P 500 as a likely price target. Obviously if those price levels are met strong resistance is likely to present itself. However, as a contrarian trader I have found that the more obvious price levels are the more likely it is that they either will not be tested or they will not offer significant resistance.
It is obvious that Chairman Bernanke and the Federal Reserve have embarked on a massive fiat currency printing campaign which has helped buoy risk assets to the upside. Through a combination of reducing interest rates on safety haven investments like Treasury’s and CD’s, the Federal Reserve has forced conservative investors and those living on a fixed income into riskier assets in search of yield.
This process helps elevate stock prices and creates the desired outcome for the Federal Reserve which involves the perception by average individuals that they are wealthier. The Fed calls this the “wealth effect” and they seem poised to insure that U.S. financial markets continue to ride upon a see of cheap money and liquidity.
Ultimately the Federal Reserve’s most recent announcements have served to help flatten the short end of the yield curve further while providing a launching pad for equities and precious metals. However, issues persisting in Europe could have an adverse impact on the short to intermediate term price action of the U.S. Dollar.
Right now everywhere I look I hear market prognosticators commenting on how hated the U.S. Dollar is and how Chairman Bernanke will not allow the Dollar to appreciate markedly in order to protect U.S. exports and financial markets. I think that the Dollar has the potential to rally in the short to intermediate term. Right now the U.S. Dollar Index appears to be trying to form a bottom.
U.S. Dollar Index Daily Chart
Obviously there is good reason to believe that the U.S. Dollar Index could reverse to the upside here. Whether it would have the strength to take out recent highs is unclear, but a correction to the upside not only seems unexpected by most market participants, but it seems plausible based on the weekend news coming out of Greece.
Monday morning the Greek government is set to determine if they will agree to the demands of the Troika in exchange for the next tranche of bailout funds. If the Greek government and the Troika do not come to an agreement, the Euro could sell-off violently.
Additionally there are already concerns about the next LTRO offering from the European Central Bank. The measure is to help provide European banks with additional liquidity, but there are growing concerns that the size and scope of the LTRO could have a dramatic impact on the Euro’s valuation against other currencies. Time will tell, but there are certainly catalysts which could help drive the U.S. Dollar higher.
Another potential indicator that the Dollar could see higher prices in coming days was the largely unnoticed bearish price action on Friday of precious metals. Both gold and silver have been on a tear higher over the past several weeks. Both precious metals have surged since the Federal Reserve announced that interest rates would remain near zero on the short end of the curve through 2014.
However, on Friday gold and silver were both under extreme selling pressure. The move did not get much attention by the financial media. The price action in gold and silver on Friday could be another indication that the U.S. Dollar is set to rally. The daily chart of gold is shown below.
Gold Futures Daily Chart
Obviously the reversal on Friday in gold futures was sharp. The move represented nearly a 2% decline for the session on the price of gold. However, as long term readers know I am a gold bull. I just do not see how gold and silver do not rally in the intermediate to longer term based on the insane levels of fiat currency printing going on at all of the major central banks around the world. The macro case for gold is very strong, but the short term time frame could reveal a brief pullback.
At this point, I suspect a pullback will present a good buying opportunity for those that are patient. However, I think it is critical to point out that this move in gold on Friday could be a signal that the U.S. Dollar is going to find some short to intermediate term strength. If the Dollar does start to push higher, it will likely put downward pressure on risk assets like equities and oil
While Friday’s price action may not mark a top, nearly every indicator that I follow is screaming that stocks are overbought across all time frames. Pair that with the Greece uncertainty and LTRO considerations and suddenly the Dollar starts to look a bit more attractive. Ultimately I am not going to try to pick a top, but the evidence suggests that it might not be too many days/weeks away.
This material should not be considered investment advice. J.W. Jones is not a registered investment advisor. Under no circumstances should any content from this article or the OptionsTradingSignals.com website be used or interpreted as a recommendation to buy or sell any type of security or commodity contract. This material is not a solicitation for a trading approach to financial markets. Any investment decisions must in all cases be made by the reader or by his or her registered investment advisor. This information is for educational purposes only.
http://www.thegoldandoilguy.com/wp-content/uploads/2014/11/tgaoglogo.png00adminhttp://www.thegoldandoilguy.com/wp-content/uploads/2014/11/tgaoglogo.pngadmin2012-02-06 08:52:352014-03-06 12:20:09Was Friday’s Price Action in Gold Signaling a Top in the S&P 500?
With all eyes on the unemployment report and Europe, the CME Group’s PR Department nearly created an all out panic with their announcement after the market close on Friday relating to futures maintenance margin. The original statement was vague and I was quite concerned until I checked out the CME Group’s web-page and the PR Department sent an update clarifying their position. At this point I think the crisis has been averted, but this is just another reminder that we live in “interesting times.”
Keep in mind that if the CME starts raising margin rates across the board for futures contracts in order to protect themselves stocks and commodities could collapse. Silver recently has is margin rates increased and silver since then dropped 25% in value. So imagine if they raised the rates for more commodities…
The current price action in the marketplace pales in comparison to the world’s geopolitical tensions and deteriorating social mood. In my trading career, I have never seen the price action in the indices react so violently to intraday headlines and rumors. Risk is high and the types of traders profiting from this market are day traders and very short term traders with trades lasting just a couple hours to 24 hours in length. Aggressive trading which small position sizes is all that can be done right now. This is not meant to be investment advice, but more as a function of the market environment in which we find ourselves currently trading within.
Right now it is hard to say where price action in the broader indices heads in the short-run. One headline out of Greece or Italy could dramatically alter economic history. In the intermediate term I remain neutral to bearish for a number of reasons. One indicator I follow is the bullish percent index on the S&P 500 which at this point is arguing for lower prices.
The chart below illustrates the S&P 500 Bullish Percent Index:
As can be seen above, the S&P 500 Bullish Percent Index is presently at an overbought status. When looking at the relative strength and full stochastics indicators one would argue that a pullback is warranted. Historically when the S&P 500 Bullish Percent Index is this overbought, a pullback ensues which ultimately sees the S&P 500 Index selloff. The more arduous task is trying to determine just how deep the pullback on the S&P 500 Index might be.
It is critical to point out that while I do believe a pullback is likely, I will not rule out a rally into the holiday season. Much of the near-term price action is going to be dictated by headlines coming out of Greece and the rest of Europe. In addition to Greece, Italy is also starting to see increased concern regarding an unsustainable fiscal condition. Depending on how the European Union handles the varying degrees of risk in the near term, we could see price action react violently in either direction.
With the market capable of moving in either direction, I wanted to point out some key price levels which should act as clues regarding potential future price action in the S&P 500. The two key support levels to monitor on the S&P 500 Index are the 1,240 and 1,220 price levels.
The daily chart of the S&P 500 Index below illustrates the price levels:
For bullish traders and investors the key price level to monitor is the recent highs on the S&P 500 around the 1,290 area. The weekly chart below demonstrates why this price level is critical and which overhead levels will offer additional resistance should the recent highs be taken out to the upside.
SP500 Weekly Chart Analysis:
While I am neutral in the intermediate to longer term presently, in the short run I have to lean slightly bearish simply because of the future headline risk and also because a major head and shoulders pattern has been carved out on the hourly chart of the S&P 500 Index. This type of chart pattern is synonymous with bearish price action.
The hourly chart of the S&P 500 Index is shown below:
Right now I remain slightly bearish, but should the head and shoulders pattern fail and/or we begin to see multiple positive reactions to news coming out of Europe a strong rally into the holiday season is likely. Unfortunately all we can do is monitor the key price levels and wait patiently for Mr. Market to tip his hand.
Until we see a breakout in either direction, we could see price action inhabit the 1,220 – 1,290 price range for several weeks before we get any more clarity of future direction. Until I see a breakout, I will remain relatively neutral with a slight short term bias to the downside based on price patterns in the shorter term time frames. This is a tough market to trade in, and I don’t want to get chopped around or do any heavy lifting. I’m going to focus my attention on high probability, low risk trade setups until directional biased trades make more sense.
In closing, I will leave you with the thoughtful muse of the late Texas Congresswoman Barbara Jordan,
“For all of its uncertainty, we cannot flee the future.”
This material should not be considered investment advice. Under no circumstances should any content from this article be used or interpreted as a recommendation to buy or sell any type of security or commodity contract. This material is not a solicitation for a trading approach to financial markets. Any investment decisions must in all cases be made by the reader or by his or her registered investment advisor. This information is for educational purposes only.
http://www.thegoldandoilguy.com/wp-content/uploads/2014/11/tgaoglogo.png00adminhttp://www.thegoldandoilguy.com/wp-content/uploads/2014/11/tgaoglogo.pngadmin2011-11-06 19:34:492014-03-06 12:49:08How to Trade This Headline Driven Stock Market
I am not one to discuss fundamentals or macro views, but this situation in Europe is beginning to morph into a media frenzy. Price action in the marketplace is changing rapidly in short periods of time based on the latest press releases coming from the Eurozone summit.
I cannot help but comment on the seemingly arbitrary actions coming from this high profile meeting. Nothing has happened that market participants were not already privy too. The European Union is going to strengthen their EFSF fund by levering it up roughly 4 : 1. I have yet to hear how exactly they plan on doing this, but this action was no surprise to anyone that has read an article about the sovereign debt crisis in the past month.
There was also discussion about backstopping European banks’ capital position. Since European banks are holding billions (Euros) of risky sovereign debt instruments, it would make sense that their capitalization is a primary concern of Eurozone leaders based on current fiscal conditions. I would argue that the banks should be well capitalized regardless of economic or fiscal conditions in order for a nation to have a strong, vibrant economy that has the potential to grow organically.
The final piece of this week’s political nonsense involves write-downs on Greek debt in the neighborhood of 50% – 60% in order to stabilize Greece’s debt to GDP ratio. Apparently Eurozone leaders want to structure the write down so as to avoid payouts by credit default swaps which act as insurance against default. How does a bond take a 50% – 60% valuation mark down without a creating an event that would trigger the payout of CDS swaps?
If a write down of that magnitude does not trigger the CDS swaps, then I would argue they are useless as a tool to hedge against the default risk carried by sovereign debt instruments. If the CDS swaps do not payout as projected by European politicians, the risk assumed by those purchasing government debt obligations around the world would be altered immediately.
The impact this might have on the future pricing of risk for government debt instruments could be extremely detrimental to their ability to raise funds in the private market. Additionally, the write downs would hurt European banks’ capital positions immediately. If the CDS swaps were to pay out, bank capital ratios would suffer as those who took on counter party risk would be forced to cover their obligations thereby straining capital positions even further potentially.
Price action today suggested that the equity markets approved of the package that European leaders were working on. However, the biggest push higher came when news was released that China was interested in purchasing high quality debt instruments as a means to help prop up poorly capitalized banks and sovereign nations in the Eurozone through an IMF facility.
The market did an immediate about-face which saw the Dollar selloff while the S&P 500 rallied higher into the close reversing a great deal of Tuesday’s losses. Inquiring minds wish to know where we go from here? I would be lying if I said I knew for sure which direction Mr. Market favored, however that did not stop me from looking for possible clues.
It has been a while since I checked out the short-term momentum charts that are focused on the number of stocks in U.S. domestic equity markets that are trading above their 20 & 50 period moving averages. The charts below illustrate the current market momentum:
Equities Trading Above the 20 Period Moving Average
It is rather obvious that when we look at the number of stocks trading above their 20 period moving average that momentum is running quite high presently. This chart would indicate that in the short-term time frames equities are currently overbought.
Equities Trading Above the 50 Period Moving Average
A similar conclusion can be drawn when we look at the number of stocks trading above their 50 period moving averages. It is rather obvious at this point in time that in the short to intermediate term time frames, stocks are currently at overbought levels. This is not to say that stocks will not continue to work higher, but a pullback is becoming more and more likely.
Additional evidence that would support the possibility that a pullback is likely would be the recent bottom being carved out in the price action of the U.S. Dollar Index. The U.S. Dollar has been under selling pressure since the beginning of October, but has recently started to show signs that it could be stabilizing and setting up to rally higher.
The daily chart of the U.S. Dollar Index is shown below:
The U.S. Dollar Index is sitting right at major support and is oversold based on historical price action. If the Dollar begins to push higher in coming days and weeks it is going to push equity prices considerably lower. Other risk assets such as gold, silver, and oil would also be negatively impacted by higher Dollar prices.
Members of my service know that I focus on several sectors to help give me a better idea about the broader equity markets. I regularly look at the financial sector (XLF), the Dow Jones Transportation Index (IYT), emerging markets (EEM), and the Russell 2000 Index (IWM) for clues about future price action in the S&P 500.
During my regular evening scan I noticed that all 4 sector/index ETF’s are trading at or near major overhead resistance. With the exception of the Dow Jones Transportation Index (IYT), the other 3 underlying assets have yet to breakout over their August 31st highs. The significance of August 31st is that is the date when the S&P 500 Index put in a major reversal right at the 1,230 price level before turning lower. It took nearly two months to regain the 1,230 level and its significance continues to hold sway.
The daily chart of IWM is shown below illustrating its failure to breakout over the August 31st highs:
The chart above illustrates clearly that IWM has failed to breakout above the August 31st highs. I am going to be watching IWM, XLF, & EEM closely in coming days to see if they are able to breakout similarly to the S&P 500. If they start to rollover, it will not be long before the S&P 500 likely follows suit.
Currently the underlying signals are arguing for lower prices in the short to intermediate term. While it is entirely possible that the S&P 500 rallies higher from here, it is without question that current market conditions are overbought in the short to intermediate terms.
Key sectors and indices are not showing follow through to the upside to help solidify the S&P 500’s recent break above the key 1,230 price level. Additionally, the U.S. Dollar Index is currently trading right at key support in addition to being oversold. At this time I am not playing the S&P 500 in either direction, but I will be watching the underlying price action in the U.S. Dollar Index closely. I will be watching for additional clues in the days ahead.
Market and headline risk is high presently.
Subscribers of OTS have pocketed more than 150% return in the past two months. If you’d like to stay ahead of the market using My Low Risk Option Strategies and Trades check out OTS at http://www.optionstradingsignals.com/specials/index.php and take advantage of our free occasional trade ideas or a 66% coupon to sign up for daily market analysis, videos and Option Trades each week.
By: Chris Vermeulen & JW Jones
This material should not be considered investment advice. J.W. Jones is not a registered investment advisor. Under no circumstances should any content from this article or the OptionsTradingSignals.com website be used or interpreted as a recommendation to buy or sell any type of security or commodity contract. This material is not a solicitation for a trading approach to financial markets. Any investment decisions must in all cases be made by the reader or by his or her registered investment advisor. This information is for educational purposes only.
http://www.thegoldandoilguy.com/wp-content/uploads/2014/11/tgaoglogo.png00adminhttp://www.thegoldandoilguy.com/wp-content/uploads/2014/11/tgaoglogo.pngadmin2011-10-27 00:28:452014-03-06 13:04:32Eurozone on the verge of triggering a shift in trends
Silver and copper have recently been going through their own private bear markets. Since the open on September 1st, silver futures have sold off by more than 25%. During the same time frame, copper futures sold off by around 24%. Both metals are extremely oversold, but lower prices are still possible.
Are the bear markets in copper and silver an attempt to warn market participants that slower economic condition are ahead? Are equities going to take a huge hit on slower future growth?
The notion that lower copper prices will precede a stock market selloff is generally an unfounded allegation. Recently Jason Goepfert of SentimentTrader.com produced the follow table illustrating the returns of the S&P 500 immediately following a bear market in copper over the past 25 years:
The chart above is additional proof that a massive selloff in copper does not necessarily have a major impact on the returns for the S&P 500. However, I would remind readers that volatility in commodities generally precedes volatility in equities.
Precious metals may be getting close to a possible intermediate term bottom. Silver and copper futures are extremely oversold based on a variety of indicators. However, the key to future price action likely will revolve around the price action in the U.S. Dollar Index.
The U.S. Dollar Index has been ripping higher throughout most of September. The rally in the Dollar is placing pressure on risk assets such as equities, precious metals, and oil. The daily chart of the U.S. Dollar Index is shown below:
So far the U.S. Dollar Index has been held back by the $79 price level which has been acting as resistance, but if prices can breakout above recent highs it would not be shocking to see the U.S. Dollar Index test the 80 – 82 price range in the near future. A breakout would likely put additional pressure on silver and copper prices. The two charts below illustrate the recent correlation between silver and copper prices and price action in the U.S. Dollar Index:
Silver : Dollar Correlation
Copper : Dollar Correlation
Additionally the S&P 500 could break below the August lows and oil could follow suit if the Dollar continues to work higher above recent resistance. If October turns out to be an ugly month for risk assets as pundits have predicted, then the U.S. Dollar will likely perform relatively well in the intermediate future.
Clearly there is political risk coming from Europe which could alter price action in risk assets in a variety of ways. Financial markets are volatile across the board and large intraday price swings are becoming common place.
In many cases the headlines will have more impact than the fundamentals or the technicals in this type of trading environment. However, the longer term support and resistance levels should hold sway even during times of exacerbated volatility. The weekly charts of silver and copper futures are shown below:
Silver Weekly Chart
Copper Weekly Chart
Clearly the price action in silver and copper in late August and throughout September has been ugly. Both metals are oversold in nearly every time frame, however if the Dollar continues to strengthen we could see deeper declines in both silver and copper prices as illustrated in the charts above.
Currently fundamentals and technical analysis cannot be relied upon solely when making trading decisions. However, the longer term support and resistance levels derived from the charts above give informed traders areas that offer solid risk / reward exits for profit taking and entries for those looking to get long silver and copper.
Trading Conclusion:
The data provided above regarding equity returns after a bear market in copper are sufficient enough to state that lower copper prices do not necessarily project lower domestic equity prices in the United States. With that said, the correlation between the price of copper and the IShares FTSE China 25 Index Fund (FXI) is irrefutable. Lower prices recently in copper are directly correlated in the price action of the FXI China Index fund as shown below:
FXI China Index Fund : Copper
The recent price action in the FXI China Index fund is ugly to say the least. As shown above, if the U.S. Dollar continues to strengthen copper, silver, and the FXI will likely continue to trade lower. Clearly the recent price action in Chinese markets is concerning for domestic equity investors, but an economic statement released earlier today is an ominous signal in the immediate future for U.S. equity investors.
On Friday the ECRI (Economic Cycle Research Institute) came out with a statement that the U.S. economy is headed for a new recession that the U.S. federal government cannot prevent. Data is starting to show signs that a new recession is not only possible, but quite likely in the near future. One of the key underlying assets to monitor for future clues about price action in risk assets is the U.S. Dollar. In coming weeks and months, I will be monitoring the U.S. Dollar closely. I think it would be wise if you did as well. Headline risk is increasingly high!
Subscribers of OTS have pocketed more than 150% return in the past two months. If you’d like to stay ahead of the market using My Low Risk Option Strategies and Trades check out OTS at www.OptionsTradingSignals.com and take advantage of our free occasional trade ideas or a 66% coupon to sign up for daily market analysis, videos and Option Trades each week.
This material should not be considered investment advice. J.W. Jones is not a registered investment advisor. Under no circumstances should any content from this article or the OptionsTradingSignals.com website be used or interpreted as a recommendation to buy or sell any type of security or commodity contract. This material is not a solicitation for a trading approach to financial markets. Any investment decisions must in all cases be made by the reader or by his or her registered investment advisor. This information is for educational purposes only.
http://www.thegoldandoilguy.com/wp-content/uploads/2014/11/tgaoglogo.png00adminhttp://www.thegoldandoilguy.com/wp-content/uploads/2014/11/tgaoglogo.pngadmin2011-09-30 16:10:402014-03-06 13:14:58Are Silver & Copper Prices Predicting a Global Recession?
Now that Mr. Bernanke’s speech is old news, what was the financial media thinking exactly? A significant number of financial writers have been anticipating discussion of QE III or QE III Lite which clearly were never even on the Fed Chief’s radar this week. The focus of the Jackson Hole Summit was how to achieve long-run growth, not conduct discussion of monetary policy.
QE III will not be discussed openly until the next FOMC meeting in September, which noticeably was extended to two days. Besides the extension and the Fed Chairman’s prediction of growth in the back half of the year, the remainder of Mr. Bernanke’s speech was nothing more than a brief synopsis of what he has already said in the recent past.
While Chairman Bernanke focuses on the U.S. economy, I have been more inclined to monitor the action across the pond. Price action in Europe is having a major impact on financial markets here in the United States. Traders are monitoring credit default swap (CDS) spreads on European sovereign debt as well as on domestic and European banks.
Recently U.S. banks have seen the CDS swaps on their debt rising indicating that the marketplace believes their debt is a greater risk to investors. While the price action is nowhere near the 2008 & 2009 levels, current prices are relatively consistent with what was seen during the correction in the late spring of 2010. While there is no reason to panic at this point, this is a trend that I will be monitoring closely going forward.
For now, I continue to believe that equity markets will rally in coming weeks as conditions are extremely oversold. The price action so far today makes sense as the wild price swings helped flush out weak hands that were long. Consequently, the snap back rally pushed shorts into stop levels as well.
A significant move lower does not seem likely at this point, but a retest of the recent lows is possible, if not probable. I would remind readers that stock market crashes generally happen within the context of an oversold market. While the likelihood of a crash is remote, it is still possible and tight risk definition in this environment is warranted regardless of which side of the tape a trader is playing.
One price chart that I have been watching closely is the German DAX. The German DAX is presently a thermometer for traders to monitor the situation in Europe. The reason the German stock market index is so important is due to the financial strength of Germany within the Eurozone. Without Germany, the Eurozone would crumble in on itself and the Euro currency would be in trouble. Recently Germany’s equity markets have been crushed and the daily chart below illustrates the recent carnage:
Another metric I monitor regularly is market momentum. The chart below illustrates the number of domestic stocks trading above their 200 period moving averages. As can be seen below, the U.S. equity market has not been this “oversold” since back in 2009. Chart courtesy of Barchart.com.
In my previous article posted back on August 18th, I discussed the likelihood for stocks to pullback and put in some form of a basing pattern. I wrote the following statement in that article:
“It is entirely plausible that Mr. Market thrusts lower from here to shake out longs. If that scenario plays out it could potentially carve out a double bottom or another basing pattern which would give active traders another entry point to get long.”
Since August 18th, we have seen the S&P 500 push lower and there is a double bottom on the daily chart which is capturing quite a bit of attention in the trading community. I would also draw your attention to the wedge pattern that is also present. A breakout higher or lower out of this wedge pattern will be the clue that will indicate Mr. Market’s short term price direction. I continue to believe we will see a breakout higher, but a retest of the lows is always a possibility. The daily chart of the S&P 500 Index is shown below:
In the short to intermediate term, I believe we will see higher prices and a test of the key S&P 1,220 area or possibly a re-test of the key S&P 1,250 price level which corresponds with the March 2011 pivot lows. Additional resistance would come in around the 1,260 – 1.270 area which marks the neckline of the recent head and shoulders pattern which triggered the selloff in the S&P 500. The daily chart of the SPX below illustrates the key resistance areas:
Gold Analysis
My most recent article argued that gold prices were going parabolic and that a pullback was likely. We have seen a major pullback in gold prices. Admittedly, I was about $200 an ounce early on my call, but members of my service were able to capitalize on an option trade that captured 32% based on maximum risk through the use of a double calendar spread. While my timing was not precise, the juiced volatility in the GLD options allowed me to roll contracts forward and make additional adjustments to produce a strong gain for the service.
Some traders argue that gold prices are going to rally back sharply in short order, which I find hard to believe. Instead, I am of the opinion that we could see additional downside in the weeks/months ahead in gold prices. There is an ominous pattern starting to form on the gold daily chart which if it is carved out and triggered, it could produce the next leg of this selloff. The daily chart of gold is shown below:
While it is far too early to determine if a head and shoulders pattern will be carved out or if lower prices take place, I am of the opinion that this selloff will offer an attractive entry point for longer term investors. At this point it is a bit too early to get involved, but if my analysis is accurate the next leg of the gold bull market will be potentially extreme.
While I believe stocks will rally in the short to intermediate term, I am of the opinion that we have officially entered the next phase of the bear market. The next wave lower in stocks is going to be just as severe as the likely rally in gold.
The reason I believe gold will rally is primarily due to future weakness in Europe. If European banks have a credit crisis, a sovereign nation unexpectedly defaults, Germany leaves the Eurozone, or a currency crisis transpires gold prices should soar while U.S. equity prices tank.
While it is far too early to make that determination, if the S&P 500 puts in a lower high on this next advance higher and consequently takes out the recent lows on a selloff, the bear will be in full swing and gold prices should take off. The chart below illustrates my expectations for the S&P 500 in the future:
The next few weeks are going to be very telling about the future in domestic markets. Is this just a correction that pushes stocks higher by the end of the year, or is this the beginning of something far worse?
For now I am going with the latter, but price action in coming weeks will offer clues about what lies ahead for U.S. equity markets. Right now this is nothing more than speculation, but the next few months should be very interesting. Risk remains exceedingly high.
This material should not be considered investment advice. J.W. Jones is not a registered investment advisor. Under no circumstances should any content from this article or the OptionsTradingSignals.com website be used or interpreted as a recommendation to buy or sell any type of security or commodity contract. This material is not a solicitation for a trading approach to financial markets. Any investment decisions must in all cases be made by the reader or by his or her registered investment advisor. This information is for educational purposes only.
http://www.thegoldandoilguy.com/wp-content/uploads/2014/11/tgaoglogo.png00adminhttp://www.thegoldandoilguy.com/wp-content/uploads/2014/11/tgaoglogo.pngadmin2011-08-28 22:39:452014-03-07 11:52:30What Could Lie Ahead for the S&P 500 & Gold