Protecting Yourself with GOLD, Oil and Index ETF’s
In 2009 I shared my big picture analysis, investment forecast and strategy in a book called “NEW WORLD ORDER ECONOMICS – What you can do to protect yourself”. In January 2009 I forecasted that the Dow Jones Industrial Average was going to make a bottom within a couple months which it did. I also predicted the price of gold to start another major rally, and for crude oil to bottom and rally for years, which were also correct.
You can call it luck, skill or a mix of both… but the truth is that the markets cannot be predicted with 100% certainty. With that said, the US stock market, gold and oil look to be setting up for their NEXT BIG multiyear moves.
GOLD BEAR MARKET IS ABOUT TO END
Gold and silver have a little trickier of a situation to navigate and invest for maximum returns over the next 2+ years.
The most important thing to realize is that when a full blown bear market starts virtually all stocks and commodities drop including gold, silver and oil. Knowing that, investors must be aware that when the stock market starts its bear market the fear will rise and investors will inevitably sell their holdings and this means we could see gold and oil continue to fall much further from these levels before a true bottom is in place.
Is this time different than the 2008/09 bear market? Yes, this time we have possible wars starting, oil pipelines overseas being cut off, counties and currencies failing and even negative bond yields in some parts of the world – it’s a mess to say the least. There are a lot of things unfolding, most seem to be negative for the economy.
The currency problems and possible war breakout will be bullish for gold and oil. So if a bear market starts in equities, and a war or currency fails gold and oil should rally while stocks fall.
But if we don’t have those sever crisis’ then if gold and oil break below their critical support level which is the red line on the charts and a bear market in stocks start you do not want to be long stocks or commodities.
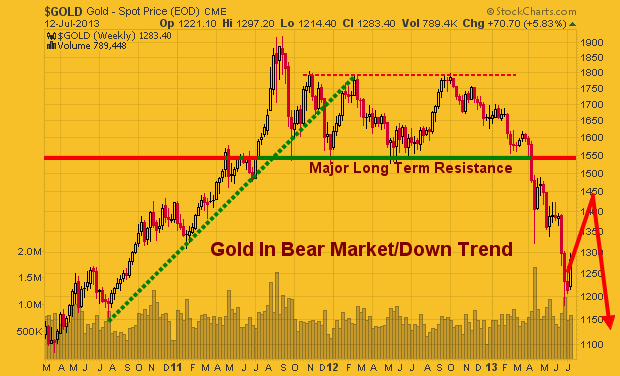
I have drawn a line in the sand for gold at $1050. If this level is broken then $815 per/ounce is not out of the question. It seems everyone is bullish on precious metals and have been buying like crazy. But as I wrote in 2009 this bullish sentiment actually pointing to much lower prices if support is broken.
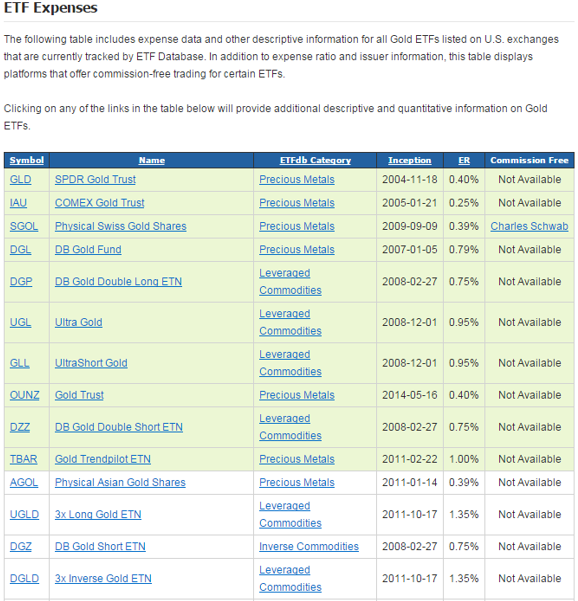
Below are some ETFs that can be used to take advantage of rising gold prices. While there are other funds that cover gold miners I feel they may not perform well during the equities bear market. Investing in physical gold is the best play at this stage of the game but when the equities bear market looks to be nearing an end, gold mining stocks will be the best place to be.
PART 2 CONCLUSION:
In this article we talked about gold and gold stocks which are showing signs of a major bottom being put in place this year. And in the next article PART 3 I will who you what to expect long term for crude oil, how we are up 28% in our short oil trade, and how you can play this multi-year cycle bottom when the time is right.
In the meantime, be sure to join my Free Newsletter so that you receive PART 3 along with more trade ideas: www.GoldAndOilGuy.com
Chris Vermeulen
https://thegoldandoilguy.com/wp-content/uploads/2014/05/gold-predictions.png141171adminhttp://www.thegoldandoilguy.com/wp-content/uploads/2014/11/tgaoglogo.pngadmin2015-03-18 13:31:342015-03-18 13:40:02THE NEXT FINANCIAL CRISIS – Part II
Seasoned investors understand that investments which are rocketing to new highs and all over the news will eventually fall out of favor and become a the poor performer, unwanted by market participants.
So it only makes sense that the underperforming investments will some day come back to life and provide opportunity once again. I covered this unique stage analysis in great detail in another report linked below.
If you want to see my forecast and charts I did on June 26th, 2013 pointing to the key investment levels for precious metals and miners which by the way have been dead READ HERE.
Current Stock Market & Commodity Investment Analysis
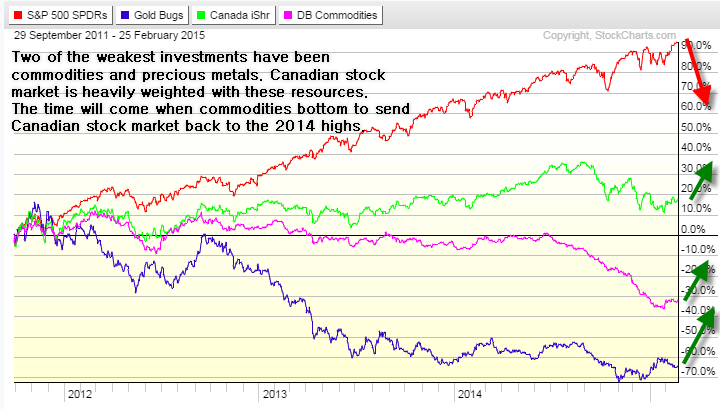
Two of the weakest investments have been commodities and precious metals since 2011. The Canadian stock market is heavily weighted with these resource stocks and is the reason for its under performance when compared to the SP500.
The time will come when commodities bottom and this will send the Canadian stock market back to the 2014 highs or better.
Take a look at the chart below. You will see the SP500, gold miner index, Canadian market, and the commodity index. What you notice see is that the US stock market has been the hot investment of choice, while commodities and precious metals have been falling for years.
No one is excited about investing in commodities or precious metals, and it makes sense. Anyone holding these investments has had a terrible couple of years and lost most of their capital. The last thing they want to do is buy more.
The good news is that this mind set eventually creates huge opportunities for the savvy, patient, investor like you and I. The hardest part is waiting for the psychology of investors to be completely out of favor, and only then can an investment bottom. This often takes years, and it has been for resources.
The 2007-2008 Resource Double Top and Drop & Gold Forecast
Bull market tops take months 6-12 months to form before price truly rolls over and starts a bear market. Most traders and investor try to pick tops but because this process is so painfully long, most get shaken out or give up well before the top has completed it’s topping phase.
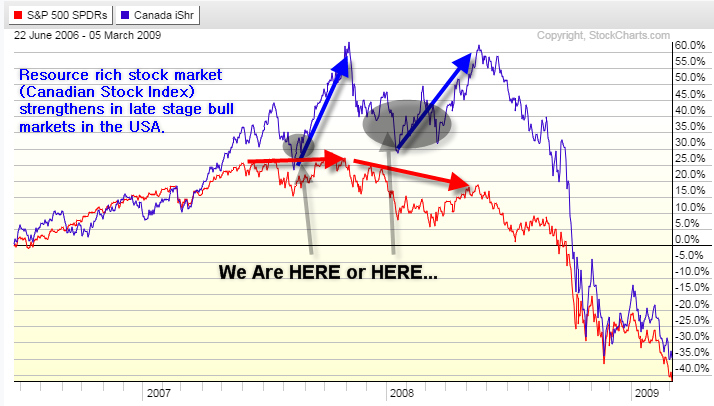
What I am interested in is the Canadian index and resource type plays. The US stock market looks and feels as though it’s trying to form a topping phase but it is at best 6-12 months away from being a confirmed bear market.
Until then, I feel the US stock market will struggle and the focus should be put on investments that come to life during this stage of the stock market and economic life cycle.
The Dead Always Come Back To Life for One More Rally
In short, I feel resources and the Canadian stock market will become strong areas of the market going forward several months. There are a few ways to play this, and timing will be crucial. My gold forecast I gave to subscribers today for short term trading looks like it could be a 25% mover.
https://thegoldandoilguy.com/wp-content/uploads/2014/03/bullmarket.jpg194259adminhttp://www.thegoldandoilguy.com/wp-content/uploads/2014/11/tgaoglogo.pngadmin2015-02-26 03:03:072015-02-26 03:04:14Money Will Rotate Into These Dead Investments
Here is my gold prediction (silver and gold mining stocks, should be the same) looking forward 24 months.
Since the top in gold in 2011 gold has selling off. Depending on how you analyze the market, this 3 year sell off could be seen as consolidation within a major cyclical bull market or that it’s in a bear market. But know this, either way, the outlook is bullish, and all gold has to do is find a bottom here and rally above the $1400 per ounce level. This would kick start a major feeding frenzy of gold buying.
Gold bear market in the past have on average corrected 33% and lasted a total of 550 days. So if we look at the stats of the current pullback in gold it has dropped 38% and about 700 days long. Time for a bottom and bull market? It sure seems like it.
You can see my recent report on the US Dollar and gold forecast.
Gold Prediction Technical Outlook:
Gold remains in a down trend, but looks to be starting a possible stage 1 basing pattern. Technical analysis is pointing to strength as the MACD moving higher, relative strength, and the down trendline show price and momentum being bullish.
A few weeks ago the chart completed a Golden Cross. This is not shown on the chart, but it is when the 50 SMA crosses above the 200 SMA. Investors tend to look at this as a major long term buy signal, although I do not use it for any of my analysis or timing of the market.
If historical data, statistics, and technical analysis prove to be correct we can expect gold to rise. My gold prediction is for price to reach $2300 – $2500 per ounce within 24 months.
Gold Prediction Conclusion:
The average gold bull market last roughly 450 days and posts a gain of 95%. So with the current correction which is beyond these levels already, expect price to firm up this year and complete the stage 1 base.
Note that until gold breaks out of its Stage 1 Basing pattern, I will remain bearish/neutral on the metal. There is a huge opportunities else where unfolding…
Join my email list FREE and get my next article which I will show you about a major opportunity in bonds and a rate spike – www.GoldAndOilGuy.com
Chris Vermeulen
https://thegoldandoilguy.com/wp-content/uploads/2014/05/gold-predictions.png141171adminhttp://www.thegoldandoilguy.com/wp-content/uploads/2014/11/tgaoglogo.pngadmin2014-05-14 18:18:282014-05-14 18:18:28Gold Prediction using Statistics & Technical Analysis
Gold Forecast: During the past year there has been very little talk about gold, silver or gold stocks in the media. Yet the year before it was all the media could talk about and they even had the price of gold streaming live all day in the corner of the tv monitor.
I am always amazed how the masses and media can be so off in their timing of the stock market and commodities in general. For example when Greece was having issues in 2012 and everyone was avoiding investments in that country like it was the plague. Looking back now, Greece is up huge and only recently investors are confident enough to put money into the Greek stock market again.
But the truth is that big move has already happend, and the US and global markets are in rotation (changing trends). Money is slowly shifting from what has been hot during the past year or two, to new investments which have a lot more room to rise in value. And this is leads us back to my gold forecast.
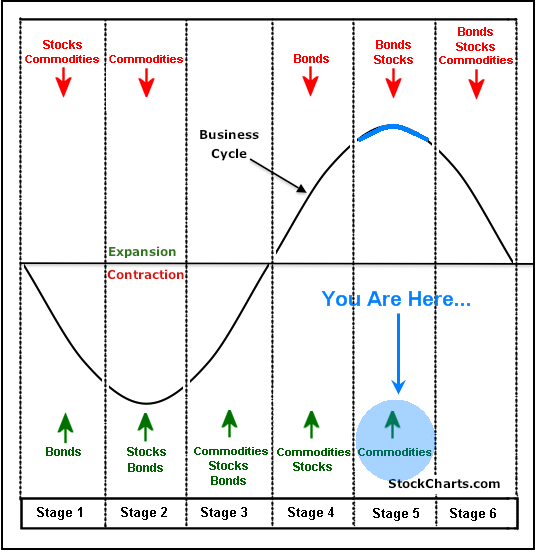
If you are at all familiar with Stan Weinstein’s work, then you understand the four market stages. If not, you can learn these four stages on my Stan Weinstein page. Through stage analysis we can predict the type of price action we should expected and have a rough idea just how long a move (new trend) is likely to last. It is important to know that Stan Weinstein’s stage analysis works on any time frame from a one minute chart to a monthly chart. If you do not know this then you are trading almost blind without a doubt.
Current stage analysis looks as though the US stock market may be starting to form a stage three top. There are several indicators and market behaviors which are screaming, telling us to trade with caution to the long side. But the masses do not see this or hear what is unfolding in front of their very own eyes, and that I fine. It actually reminds me of a funny old movie called “hear no evil, see no evil”.
In short, the market is showing some signs of distribution selling in stocks, and the once market leaders are now getting completely crushed with heavy selling volume like the biotech stocks, social media stocks and other momentum stocks and this is bad.
Gold on the other had has been forming a stage one basing pattern. This provides a very bullish long term gold forecast that investors could ride for several years.
———————–
Q: Where Will Investment Capital Go During The Next Bear Market In stocks?
A: One of the places will be precious metals. Click here for my gold forecast which shows the main reason why
———————–
Gold Forecast Coles Notes:
1. The US dollar index has setup a massive stage 3 topping pattern on the weekly chart. A falling dollar will send the price of gold higher naturally.
2. Bullish gold forecasts by the media have dropped substantially, meaning everyone is bearish on gold.
3. Gold stocks are already showing signs of massive accumulation. I always use the price and volume action of gold stocks to help create and time my gold forecasts which it starting to look bullish.
Gold Forecast Conclusion:
Gold market traders should understand that precious metals in general are still months away from breaking out to the upside and starting a new bull market. Do not be in a rush to buy gold or gold stocks yet. There will be plenty of time folks.
https://thegoldandoilguy.com/wp-content/uploads/2014/04/gold-forecast-gold-eagle.jpg225224adminhttp://www.thegoldandoilguy.com/wp-content/uploads/2014/11/tgaoglogo.pngadmin2014-04-17 02:30:592014-04-17 02:30:59Gold Forecast – This Is Going To Be Exciting
I have had a few emails asking about our silver position and why we are not moving our protective stops and taking more profits similar to how we are trading Natural Gas.
These are great questions and here are my thoughts:
Depending on your outlook and trading/investing type you will either be looking at silver as a quick trade to lock in gains, or as a early entry point into silver as precious metals start to form a basing pattern. What you do is up to you as I cannot give individual investment advice.
We/I did take some profits off the table and move our stop up last week for a portion of this position (1/3rd) and we moved our stops to breakeven. As shown in this morning video gold, silver and miners still have a LOT of work to do to build this basing pattern and it may take a few months yet. If you did not watch today’s video then do so for a visual.
I am more of a short term trader which is why I sold 1/3rd of our position last week. My brain/emotions demand I lock in profits when the market gives us a quick move in our favor. That being said, I really like the precious metals sector and feel we are getting in early and at a great price. If this basing pattern holds up and price continues to rally in our favor this year, it means we will be deep in the money on this position and can add a lot more money upon the next setup in gold, silver or miners with less risk because of our profit cushion on this first silver trade.
So I am holding the balance of my silver position with a breakeven stop looking for the longer term trend to pick up speed in the coming months.
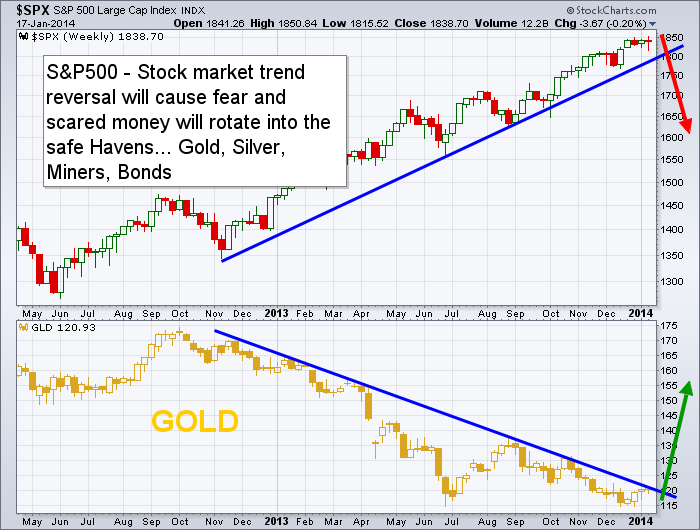
The two trend reversals everyone has been waiting a year for are about to take place, but they have not yet started.
While I do think 2014 is the year we see gold, silver, miners and many other commodities rally, it is important to follow the trend and wait for a reversal to form before getting overly excited and long commodities.
Each time we see the daily charts form some type of bullish pattern gold market traders become instantly bullish. And each time this happens they get another reality check about their trading technique of trying to pick a bottom.
I just published a book in December which teaches readers how to identify trends and stages in the market – “Technical Trading Mastery – 7 Steps to Win With Logic”. Buying into a bear market rally is not a high probability winning position. Odds favor that sellers will pull the price down and likely to new lows.
This January is one of these times and gold market traders are getting excited and long positions. While the bottom may in for precious metals, buying a bounce in a bear market is tricky and you better have some trading discipline to exit if price starts to sell back down.
Eventually we will see the stock market rollover and breakdown below its support trendline and gold will rally. But keep in mind, some of the largest percentage based moves take place just before a reversal. What does this mean? It means that the stock market could easily go parabolic and rally for a few more weeks, then reverse down sharply. And precious metals would do the opposite, sell off, make new lows, then reverse back up and start a new bull market.
Stock Market VS. Gold – Gold Market Traders Be Aware!
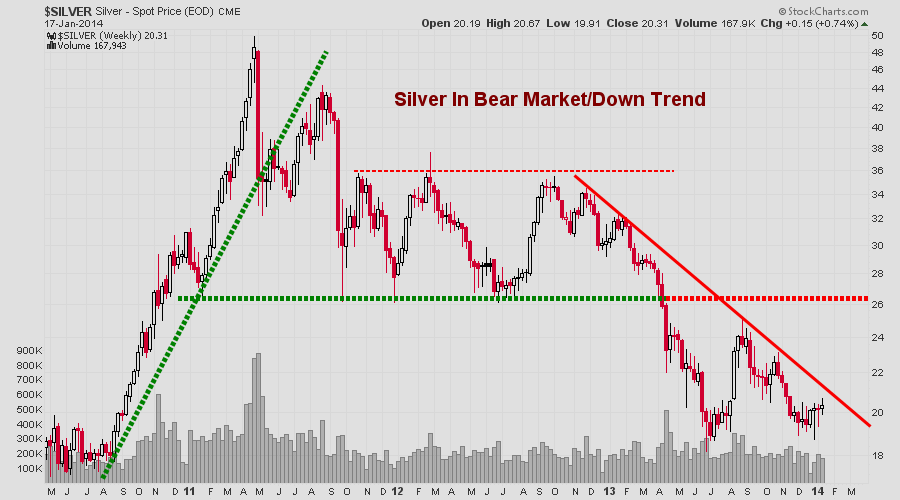
Below are a few more charts showing my big picture trend analysis for silver and gold miners.
Gold Market Traders Conclusion:
In short, the precious metals sector is still in a bear market and has not yet reversed to the upside. As you know I don’t pick bottoms or tops which go against the longer term trend. In this case the trend is down for precious metals so I am not trying to pick a bottom.
While I am starting to get excited about the eventual bottom in gold, I am still sitting on the fence with my cash.
If you would like to get my analysis every day and my gold trades be sure to join me at www.TheGoldAndOilGuy.com
Chris Vermeulen
http://www.thegoldandoilguy.com/wp-content/uploads/2014/11/tgaoglogo.png00adminhttp://www.thegoldandoilguy.com/wp-content/uploads/2014/11/tgaoglogo.pngadmin2014-01-20 10:59:282014-03-03 12:09:49Gold Market Traders: Metals And Stock Market will Swap Trends – Part II
My trading partner JW and I had a great talk the other day which spurred to the creation of this interesting and educational gold futures trading article we wanted to share with you.
Throughout most of 2013, gold futures have been under major selling pressure. Gold opened the year trading around $1,675 per ounce. As of the 12/02/13 close, gold futures were trading around $1,220 per ounce which would mean that thus far in 2013, gold futures have lost more than 27% of their value.
Looking back to September of 2011, gold’s all time high came in around $1,923 per ounce. In a little more than 2 years, gold prices have dropped around $700 per ounce representing a total loss of more than 36% based on the 12/02/13 closing price. I would say most analysts would agree that gold has been in a bear market over the past two years.
Before we begin looking at a few ways to use the gold etf GLD option structures to take advantage of higher future prices in the yellow metal, I thought I would focus readers’ attention on some bullish fundamental data for gold. Let us begin with a chart of the Federal Reserve’s Total Assets which is shown below.
The data shown above comes directly from the Federal Reserve’s public database itself. Essentially, this is the Fed’s balance sheet and its obvious that the money printing has gone parabolic. The Federal Reserve prints money to purchase Treasuries and mortgage backed securities which end up on the Federal Reserve’s balance sheet.
Interestingly enough, the chart above illustrates the amount of money the Federal Reserve has been printing since the beginning of 2011. The chart below illustrates the price of gold futures during the same period.
Gold futures have moved lower in price while the Federal Reserve has printed an unprecedented amount of money through the quantitative easing program. It has been pointed out that the flow of liquidity is more important than the total money stock, but these two charts when viewed together are rather odd at the very least. However, we must all continue to remind ourselves that there is no manipulation of any kind going on . . .
Another odd situation has developed regarding the gold miners and the price of gold relative to production costs. The gold spot price has essentially moved down below the average 2013 cash cost of $1,250 – $1,300 per ounce. Price action in gold futures is rapidly approaching the marginal cost to produce gold which is around $1,125. The chart of the various gold production costs is shown below.
Chart Courtesy of zerohedge.com
Gold prices closed on 12/02/2013 at $1,218 per ounce. Based on the closing price, gold futures are less than $100 per ounce away from the marginal cost to produce gold. If the yellow metal’s price moves below the cash and marginal cost of production gold mining volumes world wide will begin to decline.
The gold miners have likely already started lowering their production levels at current prices. The production slow down would only accelerate should prices move down below the marginal cost of production. I believe that these production costs will help put a floor underneath gold prices in the longer-term.
It is widely known that there is strong current demand for physical gold coming from Russia, India, and China. If the gold miners began to slow production levels considerably it is likely that physical gold prices could explode to the upside.
Should production levels decline while demand remains at the same level all of the manipulation in the world could not stop gold prices from arriving at their natural market based price. I think most readers and analysts would agree that the natural market based price is higher, not lower from the marginal and cash costs of production.
As many readers know, my primary focus as a trader is in the world of options where I focus primarily on implied volatility and probabilities to formulate new positions. Unfortunately options on gold futures are fairly limited and are not actively traded. However, the options on the gold ETF GLD are very liquid.
With the longer term fundamentals intact, I thought I would post a few possible trading ideas using GLD options to get long GLD while giving the trader some duration to allow for the time needed for the trade to work.
A fairly cheap way to construct a longer-term bullish position in GLD would be to look at a June 2014 Call Debit Spread or a June 2014 Broken-Wing Call Butterfly Spread.
These trade structures use multi-legged constructions and would essentially allow traders to get long GLD.
Due to the inherent leverage built into options, these positions would not require near as much capital as buying an equity stake in GLD or being long gold futures. The trade structures mentioned above would also mitigate Theta risk, also known as time decay so the passage of time would not have a significant impact on the trade’s overall profitability.
In fact, both of these trade structures would actually benefit from the passage of time in terms of profitability down the road. There are a variety of other trade structures that could be used to benefit from higher prices in GLD while simultaneously capitalizing on the passage of time as a profitability engine. Each trade construction carries a variety of different potential risks as well as required capital outlay or margin encumbrance.
I want to be clear in stating that these trade structures are purely for educational purposes and should not be considered a solicitation or investment advice. Whether we are discussing gold futures, GLD, or GLD options these are all paper investments and they should not be viewed as a substitute for physical gold holdings. Physical gold would likely benefit the most from any supply shock in the future.
In closing, I believe that the fundamental picture for gold is improving by the day. While more downside is likely in the near-term, the longer-term picture for higher gold prices in 2014 and beyond seems quite likely.
In a world where central banks are printing fiat currency at record rates, at some point in the future physical gold prices will no longer be able to be held back from true price discovery.
To learn more about probability based option trading, consider becoming a member of www.OptionsTradingSignals.com for a totally different view of the markets and how to trade options for consistent profitability over the longer-term.
By: JW Jones & Chris Vermeulen
This material should not be considered investment advice. J.W. Jones is not a registered investment advisor. Under no circumstances should any content from this article or the OptionsTradingSignals.com website be used or interpreted as a recommendation to buy or sell any type of security or commodity contract. This material is not a solicitation for a trading approach to financial markets. Any investment decisions must in all cases be made by the reader or by his or her registered investment advisor. This information is for educational purposes only.
http://www.thegoldandoilguy.com/wp-content/uploads/2014/11/tgaoglogo.png00adminhttp://www.thegoldandoilguy.com/wp-content/uploads/2014/11/tgaoglogo.pngadmin2013-12-04 15:58:262013-12-04 15:58:26Using Options to Capitalize on Strong Fundamentals for Gold
The precious metal market has been stuck in a strong down trend since 2012. But the recent chart, volume and technical analysis is starting to show some signs that a bottom may have already taken place.
This report focused on the weekly and monthly charts which allow us to see the bigger picture of where the precious metals sector stands in terms of its trend.
This chart clearly shows the trends which gold has gone through in the last three years. With simple technical analysis trend lines, clearly price is nearing a significant apex which will result in a strong breakout in either direction.
Remember, this is the weekly chart, so we could still have another month or three of sideways chatter to work through. But a breakout in either direction will trigger a large move.
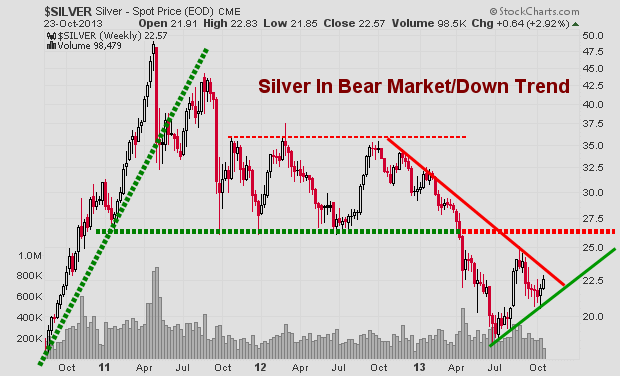
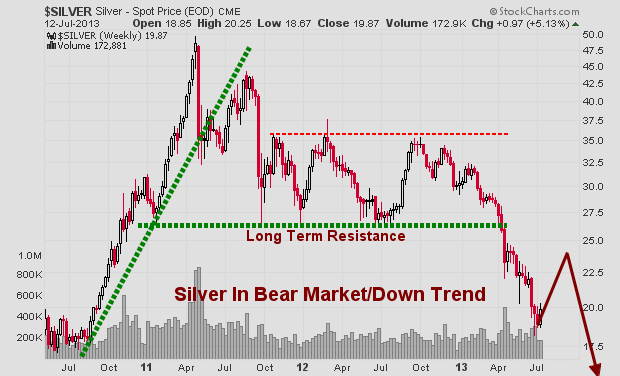
Silver Spot Price – Weekly Chart
Silver is also stuck in a similar pattern. Currently the odds still favors lower prices and for the upper resistance trend line to reject price and send it lower. But if we keep out eye on the leading indicators like gold miners, we may be able to catch a breakout or traded the rejection of resistance in the next month or so.
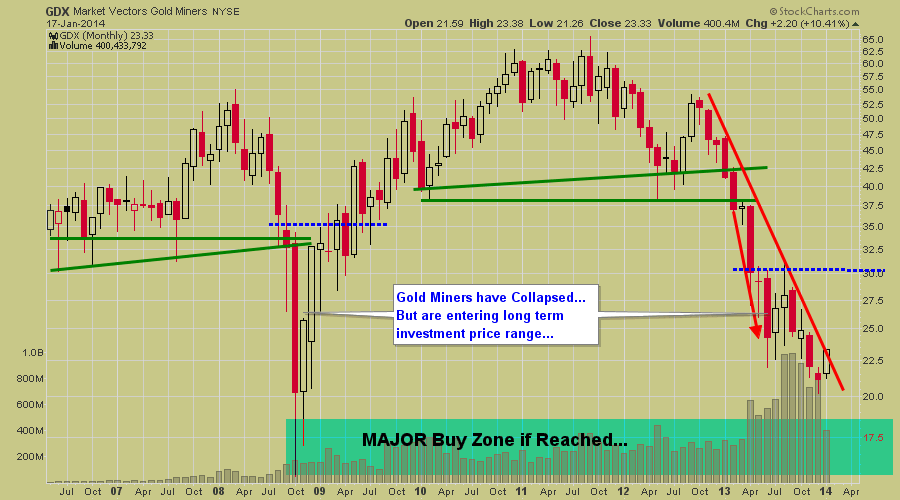
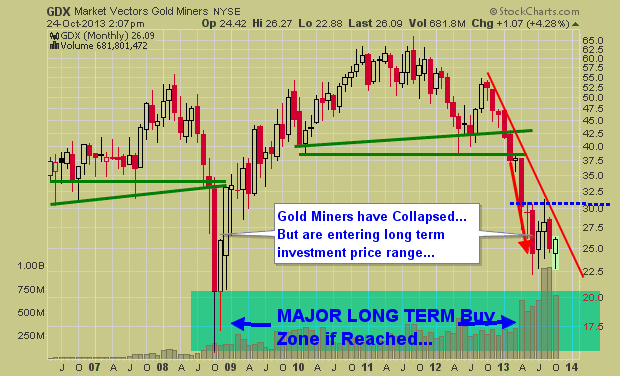
Gold Mining Stock ETF – Monthly Chart
Gold miners have a very sloppy looking chart. Price is extremely volatile and the recent price action in 2013 could go either way VERY quickly. I have a gut feeling GDX in the coming months could have a washout bottom and tag the $20 price level. While I hope I am wrong for many investors sake, if it does happen, it will be a very strong investment level to accumulate a position.
Precious Metals Bigger Picture Outlook:
In short, I remain neutral – bearish for this sector. In the next 1-3 months we are likely to see some strong price action which will be great. We need a breakout or bottoming pattern to form before we get involved at this level.
I know everyone is dying to get involved in precious metals again for another huge rally… but sometimes it’s just best to wait for the big picture chart to catch up with your bias before taking a position of size.
Get My Free Weekly Trading Sector Reports
Delivered To Your Inbox: www.GoldAndOilGuy.com
http://www.thegoldandoilguy.com/wp-content/uploads/2014/11/tgaoglogo.png00adminhttp://www.thegoldandoilguy.com/wp-content/uploads/2014/11/tgaoglogo.pngadmin2013-10-24 14:56:192014-03-04 14:05:43Precious Metals: Gold, Silver and Miners Are Trapped
During the recent weeks we have seen commodities especially precious metals continue to drop in value. Market participant sentiment has become more bearish on commodities and couple that with a rising dollar it’s no wonder why we continue to see commodities as a whole fall in value.
Money has been flowing out of bonds at record levels this summer telling us most of market participants are feeling bullish on the stock market. This shift in sentiment of the masses are typical as they move their money from the risk on safer assets (bonds & commodities) and rotate into risk-on assets like stocks. While this is a bearish (contrarian sign) stocks could easily continue to rally for an extended period of time and possibly several more months before they actually top out.
Let’s take a look at the financial market business cycle diagram:
Bond prices have been falling for months and they typically lead the stock market lower. I feel we are starting to enter the phase where stocks will soon top and head lower also. Once this starts money will naturally flow into safer assets that are more tangible like commodities.
Keep in mind this cycle is very slow moving and rotation from one phase to another takes months. This is a process not an event but it is still very tradable.
Now let’s fast forward to precious metals both gold and silver are likely to do in the next couple months. If you review the charts below you will see gold and silver bullion prices are looking primed for a bounce/rally from these deep oversold levels.
Gold Weekly Price
Silver Weekly Price
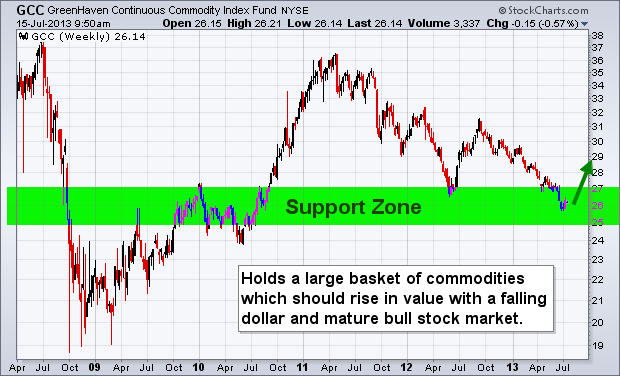
Take a look at a basket of commodities through the GCC ETF.
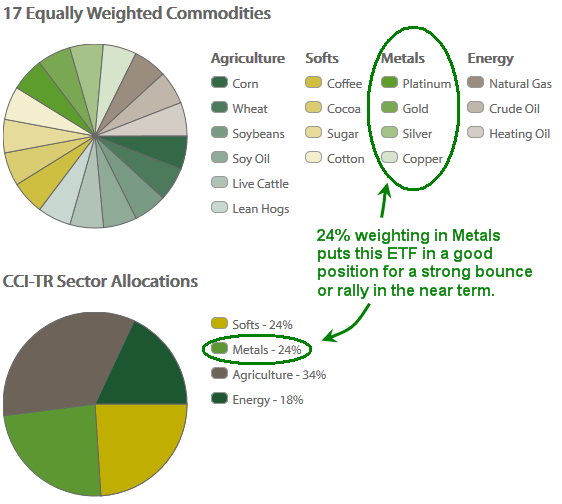
GreenHaven Continuous Commodity Index Fund (GCC) is an Exchange-Traded Fund (ETF) that provides an innovative and efficient way to deliver broad based, diversified commodity exposure. It aims to achieve this by using futures contracts to track the Thomson Reuters Equal Weight Continuous Commodity Total Return Index (CCI)†. The CCI-TR is an equal weighted index of 17 commodities plus an additional Treasury Bill yield. Because of the equal weighting, GCC offers significant exposure to grains, livestock, and soft commodities and a lower energy weighting than many of its peers. In addition, GCC is rebalanced every day in order to maintain each commodity’s weight as close to 1/17th of the total as possible.
So, knowing metals are 24% of the index it bodes well for a bounce in the overall commodity index. Keep in mind this report is only focusing on precious metals, but many other commodities look ready to rally also like natural gas.
GCC – Continuous Commodity Index Fund Weekly Trading Chart
The chart below shows a very bullish 4 year chart pattern. At the very minimum a bounce to the $29 is highly.
Commodity Basket Trading Conclusion:
In short, commodities as a whole remain in a down trend. Until they show signs of real strength I will not be trying to pick a bottom. Several commodities are starting to look oversold and ready for a bounce like sugar, coffee, copper and natural gas.
Last month I talked about how a major market top is likely to unfold during the second half of this year. I still believe this to be true. But keep in mind these major market tops which only happen every few years are a MAJOR PROCESS. They take time to form and often we will see a series of new highs followed by quick sell offs as the market gets more people long as they big money distributes their shares/contracts into the new money rotating into the market.
http://www.thegoldandoilguy.com/wp-content/uploads/2014/11/tgaoglogo.png00adminhttp://www.thegoldandoilguy.com/wp-content/uploads/2014/11/tgaoglogo.pngadmin2013-07-15 10:48:372014-03-04 15:04:16Continuous Commodity Index Points to Rally in Gold & Silver

 In 2009 I shared my big picture analysis, investment forecast and strategy in a book called “NEW WORLD ORDER ECONOMICS – What you can do to protect yourself”. In January 2009 I forecasted that the Dow Jones Industrial Average was going to make a bottom within a couple months which it did. I also predicted the price of gold to start another major rally, and for crude oil to bottom and rally for years, which were also correct.
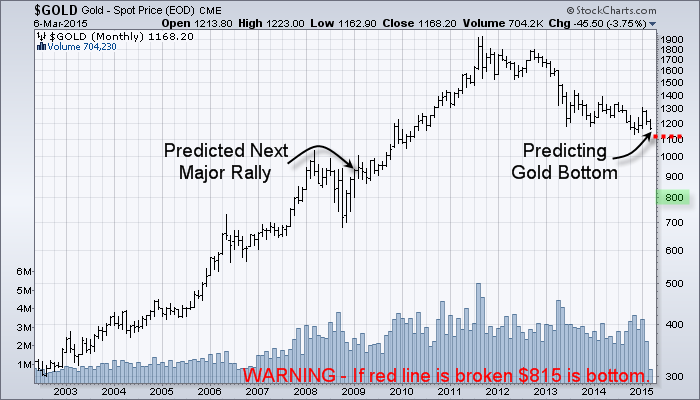


 Gold Forecast: During the past year there has been very little talk about gold, silver or gold stocks in the media. Yet the year before it was all the media could talk about and they even had the price of gold streaming live all day in the corner of the tv monitor.