Over the past couple of months, gold and silver have been uneventful. In this report I have posted weekly charts to show the larger trend of gold and silver. Also I have provided small charts of the US and Canadian gold stock funds GDX and XGD.

Because this report has weekly charts, which are a slow and dull time frame to follow, I have added another one of my Kitco Spot Gold Overlay trades, which is a short day trade to liven things up.

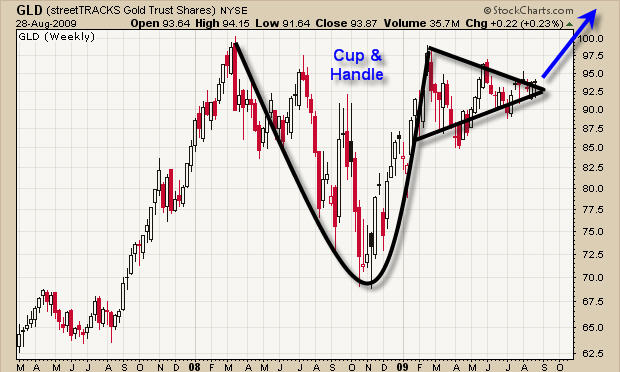
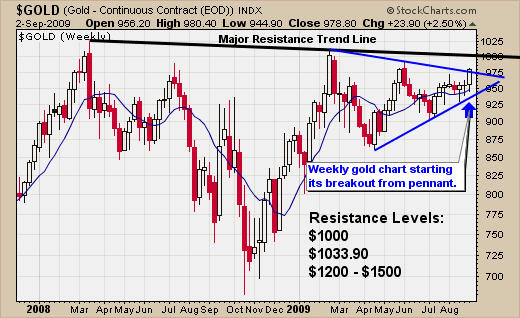
GLD ETF – Gold Bullion Price Action – Weekly Chart
I spoke with a few members last week, who wanted me to change my analysis for gold, which I agree with. So I would like to address this now to keep everyone on the same path.

In previous reports I have pointed out the reverse head & shoulders pattern in this weekly chart below. But to be honest, it is not a reverse head & shoulders, which everyone is saying it to be.

Why is gold not in a reverse H & S pattern? Because a reverse H & S pattern is just that, it means the price will reverse from the previous trend. A reverse H & S happens after a downtrend, which forms a bottom and the trend is not moving higher.

Gold has been moving higher, which you can see in 2007 and this large pattern is more like a Cup & Handle pattern – extremely bullish.

Trading Spot Gold Chart - Weekly

Trading Spot Gold Chart - Weekly

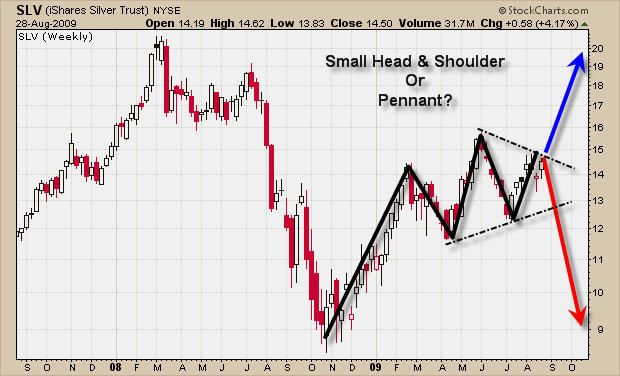
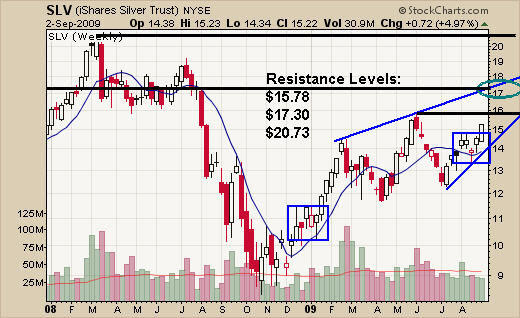
SLV ETF – Silver Bullion Price Action – Weekly Chart
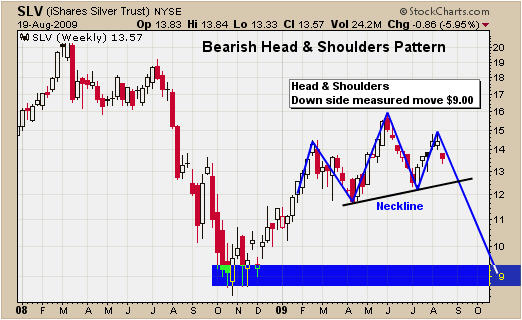
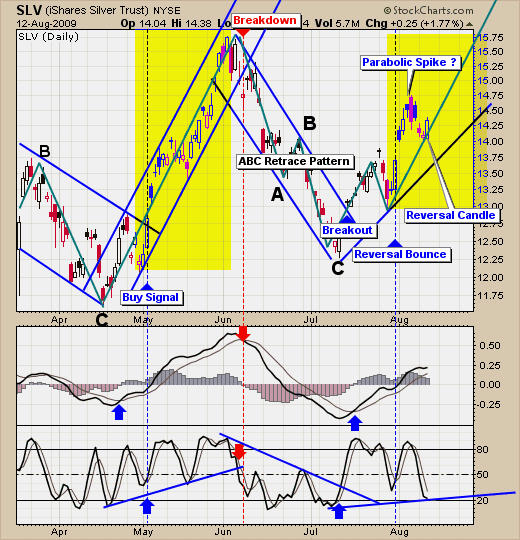
Silver is trading a little different than gold. As you can see the price is trading much lower than the 2008 high. There are also two small patterns forming, which are a small head and shoulders top or a bullish pennant.

Last Friday we saw gold and silver prices jump, but until we get a low risk entry point, I continue to watch these commodities move inside their large weekly price patterns.

Spot Silver Chart - Weekly

Spot Silver Chart - Weekly

US & Canadian Gold Stock Funds
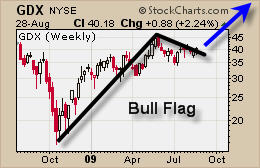
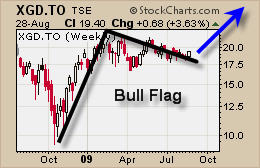
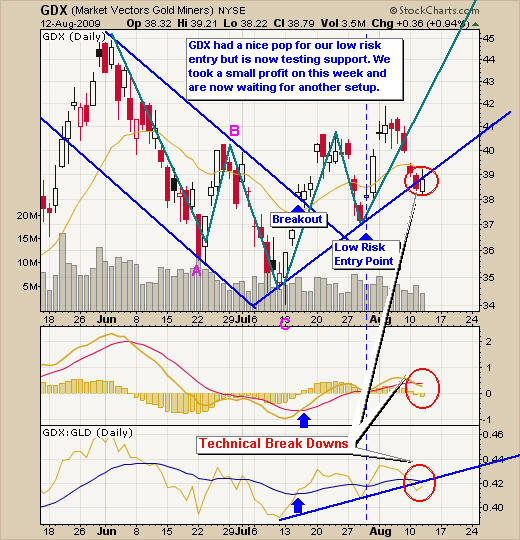
These small charts show how bullish the price action is this year for gold stocks. But the exciting part, which is tough to see here, is that the Canadian fund is starting to show bullish price action. When both the US and Canadian gold funds are moving together, it means there will most likely be some tradable moves in the near future. Let’s keep focused and ready to take action in the coming weeks, as these bull flags near the end of their cycle.

US Trading Gold Stocks

US Trading Gold Stocks


Canadian Trading Gold Stocks

Canadian Trading Gold Stocks

Day Trading Spot Gold – Day Trading GLD ETF
I will keep this short because I have written about this once before and below is the link to read my gold trading strategy in detail.

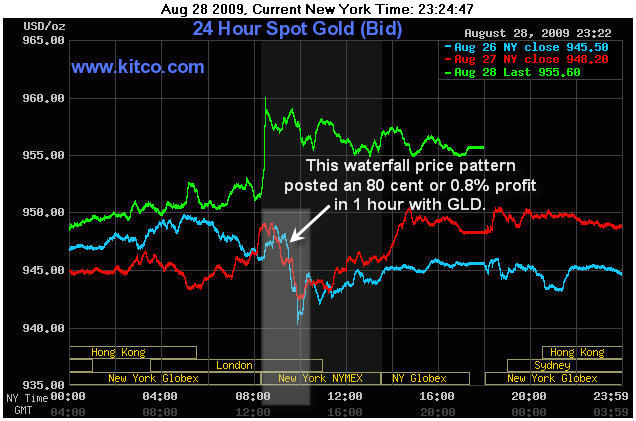
Day trading spot gold using the real-time kitco overlay chart is what I use to identify a possible day trade. The shaded box below shows a simple waterfall sell off and when I see that price action, I will generally take a position the next day around that time for a short trade in GLD.

I did not think to save this kitco chart until the following day so the waterfall price action was miniaturized because of Fridays rally. Also I would like to note this waterfall pattern happened 3 times in a row last week and I took advantage of them.

My Basic Strategy
Gold tends to move similar to what it did the previous day and traders know this, which is why the patterns starts 5-30 minutes earlier the following day, as we anticipate the move. Moves tend to repeat for up to 3 days. So you identify a sizable move and take action on it the following two days, as long as the rest of the day trades similar to the previous days. I like to scale into positions and once I see it going my way I add one final position to increase my exposure.

I am sure some of you are wondering how I traded GLD at 8am ET?
I trade with an online broker that allows me to trade pre-market and post market hours. Not very often these setups happen before 9:30am ET but last week it did.

Important note:
Once you see the price of gold making opposite moves of the previous day, minimize your position or don’t take the trade. As you can see in this chart below, the red line is starting to move the opposite way of the previous day (baby blue line) and later in the afternoon it was completely the opposite. This is a warning that there is a shift in the buyers/sellers and you can see the next day prices spiked higher in the opposite direction.

Day Trading Spot Gold - Day Trading GLD ETF

Day Trading Spot Gold - Day Trading GLD ETF

Read my previous Gold Day Trading Guide:
http://www.thegoldandoilguy.com/spot-gold-price-charts/

Technical Gold Trading Conclusion:
Overall precious metals are trending sideways in their bullish patterns and we are waiting for some low risk entry points.

During slow trading times, which we are currently in, I like to look for other profitable positions to satisfy my need to trade. As a full time trader, it is important to have a few styles of trading, which allow you to profit in any market condition. My main focus is on the commodity ETF’s, with low risk setups, but I also day trade GLD when opportunities arise and I also trade extremely over bought/oversold index plays using the leveraged ETF’s and focusing on my Active Trading Partners stocks trades, which provides profitable trades week after week. Combining these trading styles allow me to pull money from the market week after week without forcing any positions. I just let perfect setups unfold and I take advantage of them.

Soon I will be providing these gold day trades and index trades for members, which I think is very exciting. If you would like to receive my free weekly trading reports please visit my website at: www.GoldAndOilGuy.com

Chris Vermeulen

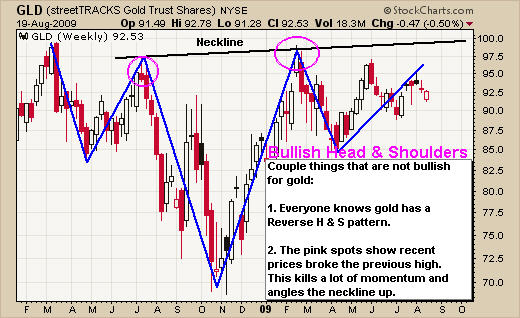
Everyone is talking about gold shooting to the moon because of the massive reverse head & shoulders pattern forming, not to mention the economy isn’t as good as some of us would like it to be?. I put together this quick report to show the bearish side of things for once.

Bearish Points for Gold & Silver:
• Silver looks to be forming a H&S pattern
• Gold made a new high in March and quickly sold off
• Gold’s neckline is angled up which makes for a weaker breakout if it occurs
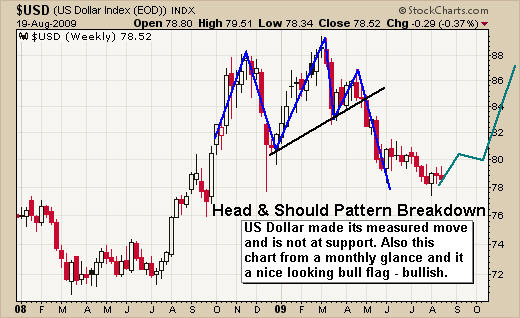
• The US Dollar looks ready for big rally.

SLV ETF – Weekly Chart
Silver is a great performer but we may have to start looking at shorting precious metals in the coming months if prices start breaking down.
1SilverHeadAndShoulders


GLD ETF – Weekly Chart

I like to be bullish on precious metals but these charts don’t provide much comfort. I will admit there are bunch of different ways to draw this gold chart which can make it look very bullish. But we cannot forget that the market will hurt the most individuals possible and we must be ready for these moves when they happen. Most traders think gold is going to breakout to the up side because of the economy and the famous Gold Reverse H&S pattern. But if everyone thinks this already wouldn’t everyone already be in gold? Who is going to buy gold to take it to the next level??

Also I want to point out that this reverse H&S has a neckline angled up which in my opinion is not a good sign. It shows the price was allowed to move above the previous pink high to suck in traders/investors as they panic to buy the breakout. Soon after buying gold they get taken to the cleaners as price plummeted. I just know from day trading that this type of head & shoulders pattern is not as accurate to trade and I avoid them (price patterns perform the same in all time frames).
2GoldHeadAndShoulders

US Dollar – Weekly Chart
Take a quick look at the US dollar. It formed a very nice H&S pattern and broke down to the measured move area quickly. Also this chart looks like a large bull flag and could start to move higher from this support level in the coming months. If this happens we will see precious metal prices drop.
3USDHeadAndShoulders

Technical Trader Conclusion:
The precious metals market is under pressure from the US dollar and some major resistance levels. Overall silver is underperforming gold and I look at silver as leading indicator. We are currently in cash waiting for a low risk setup for gold, silver, oil and natural gas.

If you would like to receive my free weekly trading newsletter please visit my site: www.GoldAndOilGuy.com

Chris Vermeulen

I hope everyone had a great weekend and is now ready for another week of trading. I have put together a few simple charts to show you what we could see with prices in the near term. While I do not predict future price movements (because it is impossible to always be correct), I do like to know what could happen and be ready to take action when something significant occurs.

The five charts below quickly summarize what I am seeing in the market currently.

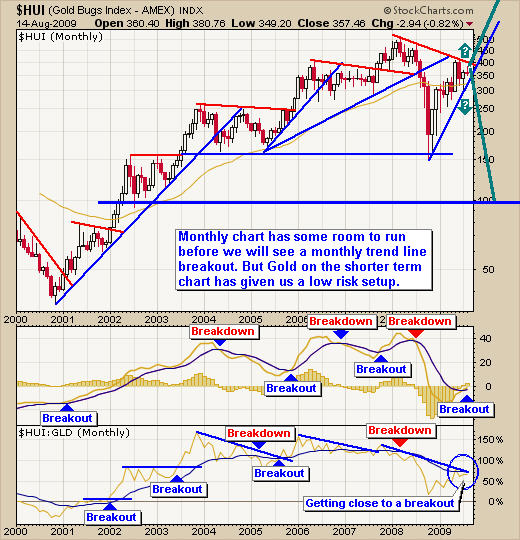
Gold Stocks – HUI Monthly Chart

Gold stocks have been performing very well this year. As you can see from the chart stocks are getting squeezed into the apex, which generally creates explosive moves. We could be months away according to this chart so don’t get trigger happy just yet.

A breakout to the upside will most likely trigger a very large rally. But if prices break down then I expect to see gold stocks pull back to new yearly low.

Gold Bullion Market

Gold Bullion Market

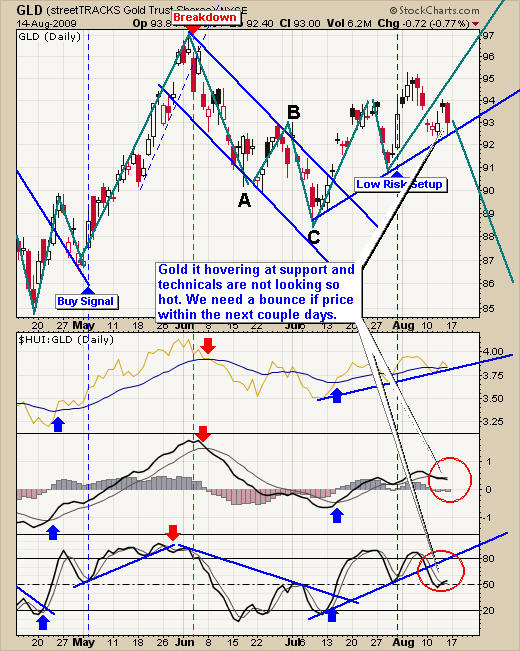
GLD Gold ETF – Gold Bullion Prices – Daily Chart

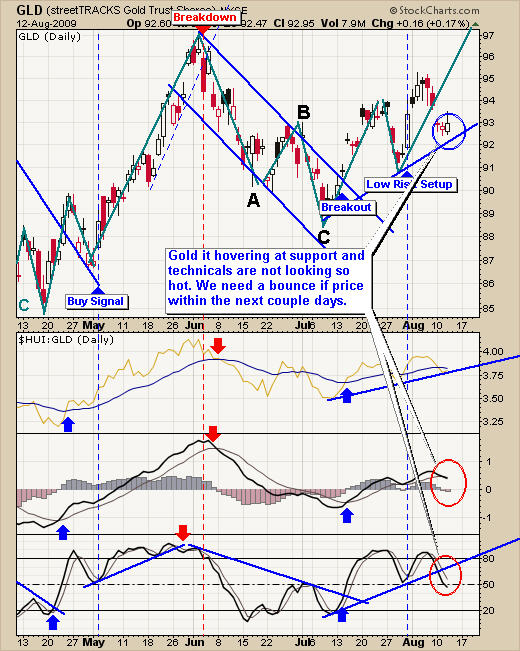
Gold has been trying to move higher the past 4 weeks and is having a tough time. With any luck gold will bounce higher Tuesday or Wednesday starting a new rally higher. If prices do not hold, up I figure we will see a sharp price drop which could go all the way back down to the $800 level within a couple months. I am currently long gold and will continue to hold it until I see a technical breakdown on the chart.

GLD ETF Trading Signals

GLD ETF Trading Signals

SLV Silver ETF – Silver Bullion Prices – Daily Chart

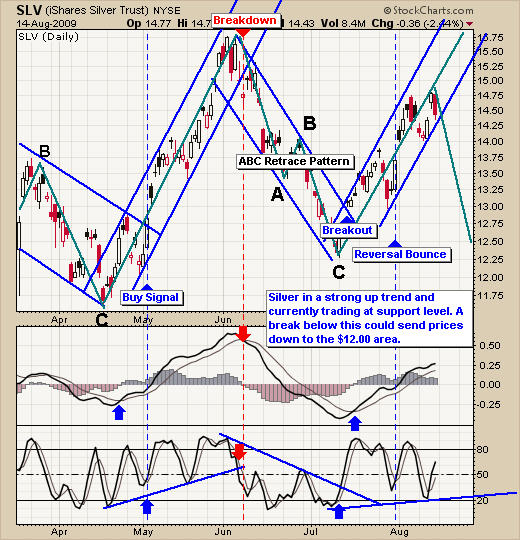
Silver is in the same situation as gol. It’s pointing to higher prices but a breakdown will most likely trigger a sharp sell off. I currently own silver and will be looking to exit below the $14.00 level.

SLV Silver ETF Trading Signal Newsletter

SLV Silver ETF Trading Signal Newsletter

UNG Natural Gas fund – Natural Gas Prices – Daily Chart

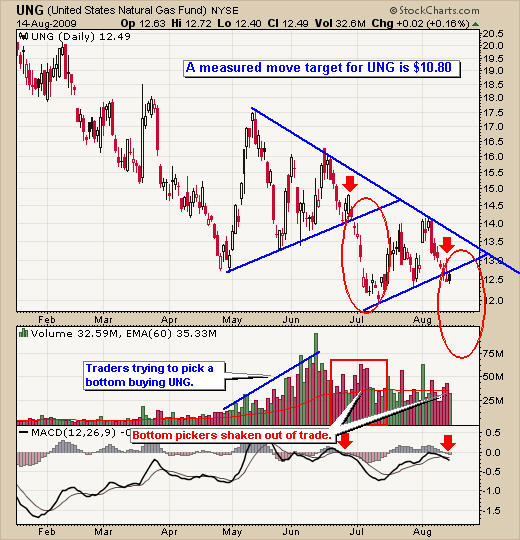
Nat Gas looks to be breaking down once again on rising volume. We could see another waterfall type drop this week.

UNG Fund Trading Signals

UNG Fund Trading Signals

USO Crude Oil Fund – Crude Oil Prices – Daily Chart

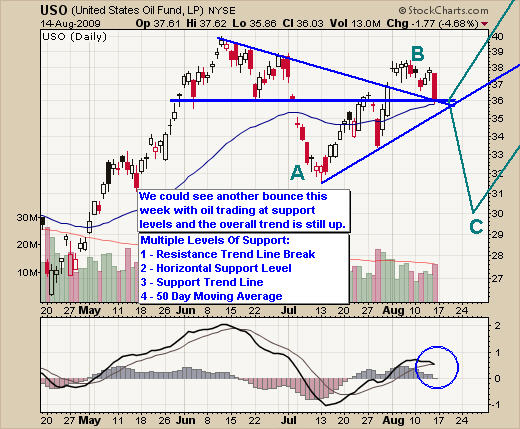
Crude oil had a big pullback Friday which could make for a great short term intraday play on Monday. Sharp price drops like this will generally have bargain hunters (buyers) step in the following day to push the price higher. Also I pointed out that oil is trading at 4 different support levels. This could give prices an intraday pop or possibly start a new leg higher in the coming days.

I continue to wait for a low risk setup in oil, which is possible that we get a setup this week. Only time will tell but I will keep you posted.

USO Crude Oil Fund Trading Signals

USO Crude Oil Fund Trading Signals

Technical Traders Conclusion:

Gold stocks, gold bullion and silver are trading at support levels. The overall trend is up so there is more of a chance that we will see a bounce from here. But the market always throws in a curve ball so be prepared for locking in gains or cutting losses quickly if we see prices slide lower.

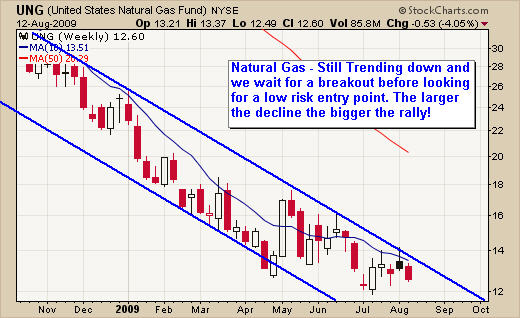
Natural Gas continues to have selling pressure and looks to be having a technical breakdown as of last Friday. This could be a nice play for those aggressive traders who want to take advantage of a 1-3 day breakdown in price.

Light Crude Oil is in a similar situation as gold and silver. Currently trading at support and could go either way, but the odds are in favor for a bounce.

I will update again on Wednesday night, if you would like to receive these quick technical trading reports to your inbox Free please visit my website: www.GoldAndOilGuy.com .

Chris Vermeulen

by Jeff Clark, Editor of BIG GOLD

October 27, 2008 was the gold mining sector’s Black Monday, the day nearly every stock hit rock bottom. Hindsight makes it plain they got caught in the violent deleveraging that sucked down every equities market in the world.

The broader markets were of course making year-to-date lows at the same time, and unlike gold stocks, they continued falling after a short intermission. In fact, the Dow fell 2,000 points after Obama was elected. In sharp contrast, the mining stocks went on a tear. Between November ’08 and January ’09, many of our BIG GOLD picks made substantial gains, rising anywhere from 45% to 149%.

This good news isn’t the whole story, of course; many mining stocks saw percentage losses greater than the broader market averages during the Big Selloff. But given the fact that gold stocks started rebounding while the broader markets continued lower, the BIG GOLD portfolio ended the year down 24% while the S&P lost 38%. We were also glad to see our portfolio responded better than the HUI; the broad-based mining index lost 32% on the year. Meanwhile, the demand for physical gold and silver was surging, likely attributed to investors who’d been spooked by the broad meltdown.

We held on to our shares throughout the selloff and advised our readers to do the same – and subsequently watched our stocks rebound mightily. And we fully expect these kinds of surges to repeat as gold pushes higher. Keep in mind that the real mania is yet to come. Once inflation responds to the Federal Reserve’s ongoing monetary foolishness, gold will need a space suit and our miners oxygen masks.

A key point to remember going forward is that gold mining shares constitute a minute fraction of the global equities market, and a small shift in investor interest toward our sector can move gold stocks sharply higher in a big hurry. The market cap of the fifteen largest gold producers in the world — combined — is a paltry $125 billion. That’s barely more than a single company such as General Electric, at $116B; much less than Microsoft ($175B); and waaay less than Exxon Mobil at $400B.

Miners have also had a temporary respite from high energy costs due to the collapse in the price of crude oil. Energy is one of the biggest expenses a miner has to carry. As energy prices came down, the cost of producing gold also declined, fattening the bottom line. Oil is likely to get back to and then beyond $143 per barrel at some point, but not for a while. We doubt it will top $75 this year, which is enormously helpful for our companies.

Recently, gold stocks have outperformed bullion, a trend we’re keeping an eye on and one we’re confident will continue in the future, especially when we see the certain emergence of serious inflation and the dollar resumes its downtrend.

So… what to do now?

What we hope you’ve been doing all along. Our general rules: If you’re already fully committed to this sector, stay the course; you will be well rewarded.

For those with money still to invest, accumulate well-run, sound companies on weakness. Volatility will continue; we expect days and weeks marked by retracement in the prices of even the best companies. The dips will be your buying opportunities. Place below-market bids and let the price come to you. Take positions with half or so of the funds you’ve allotted for this sector, then fill out your portfolio with whatever bargains come your way.

Whether you’re already full-up with gold stocks or are just getting started, you should be well positioned before the all-out mania for gold stocks hits.

The Quandary of Timing

It may surprise some to hear that we are not “all-in” yet with our portfolio. Why? Because our attitude is one of caution, and because we know that our big gains since October could get clawed back, partly or wholly, by another reversal – which would lead to another buying opportunity we wouldn’t want to miss.

But caution can be expensive when the market runs away from you. What if the train has already left the station? In that case, those waiting on a pullback will be disappointed. Just as all below-market bids placed on October 28 of last year went unfilled, so could today’s, or tomorrow’s.

Looking as little as a year out, our money is confidently on our stocks going higher – much higher. We expect the government’s assorted “stimulus” packages to fail to deliver as advertised, and usher in high inflation. This will push gold and gold stocks much higher.

But the question is, if the broader markets head lower, will gold stocks follow them down or ride on gold’s coattails?

That question leaves you in a quandary only if you’re looking at the short term. Or if you get emotional about this stuff. Those with no stomach left after the gut-wrenching selloff into last October probably shouldn’t deviate from the cautious strategy outlined above. If you’re one of those who see the big picture and ignore the gyrations along the way – which is what Doug Casey does – then you’re drawn to the idea of placing a bet when you judge that the odds are in your favor. It’s when you see the price of something is far less than its value that you can have the confidence to load up, whether that’s today or perhaps later this summer.

Whether you buy today or wait in hopes of a pullback, we believe you’ll be looking at profits a year from now. In the big picture, our stocks are still deeply undervalued, even after so many of them have doubled off their lows. But could they retreat again? In a general market pullback, definitely. Could they tread water for a while? Certainly. And could they leave present levels in the dust and double again from here? Absolutely.

There are times when one must put away the crystal ball and simply prepare for more than one scenario. This is one of them. Whether you respond more conservatively or more aggressively, keep your eye on the endgame. We think you’ll be glad you did.

Prudent precious metals strategies for conservative investors – that’s what BIG GOLD is all about. And now that the gold price is going up again, you shouldn’t wait to jump on the bandwagon. Read in our latest report why super-low interest rates mean we could see $1,500/oz gold this year – click here to learn more.
Thursday Night Trading Charts
I have put together a short update just so you can see were we stand for gold, silver and oil at these current price levels.

Trading Report & Charts: http://www.thegoldandoilguy.com/PreciousMetalsTradingNewsletterApril23.php

Just to let you know the e-book which Jerry Grenough & I put together on New World Order Economics, What You Can Do To Protect Yourself – Crisis Investing For 2009 is now available in hard copy.

Hard Copy Book:
http://www.thegoldandoilguy.com/eBook-CrisisInvestingFor2009.php

ENERGIES: June crude oil closed up $0.58 at $49.43 a
barrel today. Prices closed near mid-range today. Crude oil
bears still have the near-term technical advantage. The
next downside price objective for the crude oil bears is to
produce a close below solid technical support at $44.00.

PRESCIOUS METALS: June gold futures closed up $14.50 at $907.00
today. Prices closed nearer the session high again today on
short covering and fresh speculative buying and amid a
weaker U.S. dollar. Prices did hit a fresh three-week high
today as bulls and bears are back on a level near-term
technical playing field. Prices are still in a two-month-
old downtrend on the daily bar chart, however.

May silver futures closed up 49.0 cents at $12.795 an ounce
today. Prices closed near the session high today on short
covering and fresh speculative buying. Bulls gained some
fresh upside near-term technical momentum today as bulls
and bears are back on a level near-term technical playing
field.

Chris Vermeulen
www.TheGoldAndOilGuy.com

PRESS RELEASE – FACT SHEET ON:

NEW WORLD ORDER ECONOMICS

WHAT YOU CAN DO TO PROTECT YOURSELF – Crisis Investing in 2009

Book Title: As above

Publisher: Taylor Forensics

Price: $ 24.95

Type of Book: eBook

Crisis Investing in 2009 Webpage and Provided by Chris Vermeulen – TheGoldAndOilGuy:

J.T. Grenough – New World Order Economics – Crisis Investing in 2009

Insert from Introduction:

INTRODUCTION FROM THE AUTHOR – Jerry Grenough

“There’s no shortcut to any destination worth going.” UNKNOWN

I wrote this book (New World Order Economics – What You Can Do To Protect Yourself) for a major demographic section of the country – investors who are concerned about their future and their holdings. At recent dinners (anniversaries and weddings I’ve attended) with large groups of people, the most talked-about topic is the economy and investments. Everyone is concerned without exception. This book is in-depth and leading edge material and a must-have for anyone with any size of portfolio.

I’ve seen a dearth of material on the market and very few people have a one-stop all-inclusive source of material on international, non-traditional investing that can protect them quite well from the current shock and awe of Wall Street. This book will be a must-have, a necessity – for economic survival as the next seven-nine years of this L-shaped credit bubble goes through stages until we reach the far side.

I thought of the title and just to see if it had been requested (via Google), I entered the first keywords of the title and found to my amazement 18,200,000 people who have entered these exact key words in a search. I’m not talking search results but the number of people who have searched with these words – New World Order Economics. If you enter New World Order Economic you have even a more amazing discovery – 28,700,000 people have searched using that nomenclature. That tells me there is an absolutely gigantic number of people out there who are looking for answers.

This book covers:

Ø Oil & Geopolitics

Ø Gold Shares Around The World

Ø Hard Currencies & International Currency Funds

Ø A Resource Chapter on Gold, Silver, Mining & Energy

Ø Offshore Real Estate Investing – Safe Havens

Ø Hedge and Short Fund Investing Strategies

Ø Gold Funds and Exchange Traded Funds

Ø Creative Non-Paradigm Planning

I have not found any other books that allow the investor to safely re-balance their portfolio from their home office, without leaving there. It is written as an eBook, for ease of search ability (just enter Ctrl F and you can find any search term or topic you want), and for ease of research ability – since investing is a continuous process this book has over seventy key links to major sites you will need from time to time for updates. It also is formatted to allow printing if you wish.

The target audience is American investors. However, the book may appeal to the British and European audience as well. The old axiom of “buy and hold” obviously just doesn’t cut it any more.

I’ve previously published a 90,000 word nonfiction book (copyright now owned by Thomson Reuters) I wrote for ‘scholarly’ purposes and not for royalties, designed for reading by corporate CEOs. I currently hold position at a large privately-held conglomerate dealing with Corporate Risks & Investment Risks in terms of corporate treasury holdings and various other areas. I was previously with First American as a Regional Audit Director under the recently passed Sarbanes Oxley legislation.

I am not an Investment Advisor and thus have no self-interests. I’m a writer and a researcher and that’s what you need right now.

Author: JT Grenough

Publication Date: March 2, 2009

Email contact: TaylorForensics@aol.com

Ordering Procedure: From the web page: Upon receipt of a check or money order for $ 12.95 accompanied by the email address of the individual, we email the PDF eBook the same week. The book is priced reasonably and delivery is in a streamlined format.

Author’s Bio:

JT Grenough has also written a book “Protecting Your Company Against Civil and Criminal Liability” and holds position as Assistant Director of Internal Audit for a privately-held conglomerate. He can be reached at TaylorForensics@aol.com.

Rising Commodities, Falling Stocks & Risk Reward Ratio

Trading Risk/Reward

The past few months have been absolutely crazy in the financial markets. Financial advisors and banks are taking a beating from both the market condition and clients as individuals around the world are losing 30+ of their investments. We have seen oil prices drop over $110 per barrel from the high (73% decline), and the US dollar tumbled down to 71 and rebounded to 88 (23% gain) all in the mater of months.

Risk Management is what is needed if we want to stay in the game over the long term. Follow strict risk/reward rules is a must so that we don’t not get caught chasing stocks and funds only to have them turn around on us a few days later.

Focusing on keeping risk low for potential trades is crucial for turning a profit over the long run. In short I look for a basket of indicators including candle patterns and volume to be in favor when buying or selling a stock or fund. When a fund generates a buy signal I wait for a low risk entry point near my support or resistance level depending if I am looking to go long or short. I need to see a perfect setup so that the odds are favoring my side. Only then will I take a stab at the market. The biggest issue with this is that I do miss a lot of good trades, but the key here is that most of my trades are profitable and that is what makes it so powerful. I would rather make 20 trades a year, than 150 trades and make the same profits.

This Weeks Analysis on Gold

Gold continued its push higher last week getting a lot of investors and traders all excited. The daily chart does look strong and it is currently on a buy signal. But buying at this level is much too high of a risk.  The price of gold is trading at the top of its 4 month trading range which previously led to a 20% selloff in bullion. Our support trend line is 10% away from the price of gold making it out of reach still. I trade reversals when risk is only 3% from my stop/support price.

Daily Gold GLD Chart


Gold Stocks

Gold stocks have been struggling to move higher and last Friday gold made a nice move higher while gold stocks sold down. My last article talked about how trading gold (GLD) may be a better investment then gold stocks right now simply because of the bearish broad market. The broad market looks like it’s about to make another leg lower and when the broad market sells off, it pulls all stocks with it. The daily chart of the HUI Gold Bugs Index shows precious metal stocks moving sideways while gold pushed higher. When gold stocks start to underperform the price of gold I tighten my stops and mentally prepare myself for gold to pull back. The smart money always seems to move in and out of stocks faster than the commodity which is a topic I mentioned in a previous report as well.

Gold Bugs Index Daily Chart


Crude Oil Analysis

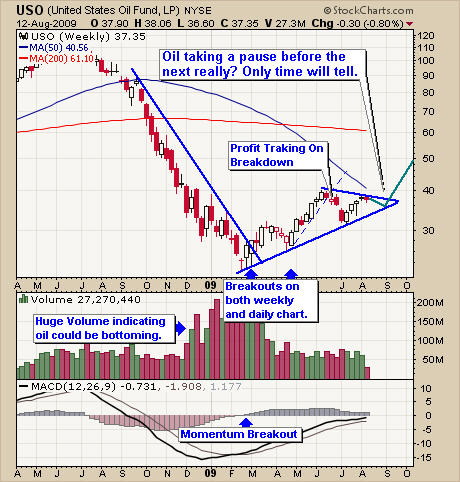
Crude Oil has been under continuous selling pressure for the past 7 months and this is the first buy signal I have had for it since it topped back in July 2008. The weekly chart is very close to a buy signal. If you look at the weekly chart of USO crude oil fund you will see that volume has shot through the roof which generally indicates a turning point. Also the MACD indicator is about to cross which will put this fund on a buy signal if things go well all of next week. The support trend line is trending up slightly and the down trend line is holding the price inside a small triangle. If the price breaks out and all my indicators are putting the odds in favor of a long trade, then we will be looking for a buy point on the weekly chart in the next few weeks. The weekly trading signals are good for intermediate and long term traders.  

Crude Oil (USO) Weekly Trading Chart

Conclusion:

The broad markets continued to move lower last week as it remains in a long term bear market. For those looking to take advantage of gold, silver and oil movements I recommend sticking with the commodity funds as they can increase in value while the broad market is selling off. The daily chart of the hui gold bugs index shows this clearly as gold stocks in general are underperforming the price of gold right now. There is an opportunity for oil to make a move higher if things come together in the next couple of weeks but until then we will be patient and let the trade come to us.

If you have any questions please feel free to send me an email. My passion is to help others and for us all to make money together with little down side risk.

I look forward to hearing from you soon!

Chris Vermeulen

The Gold and Oil Guy

Chris Vermeulen

GOLD TRADING

April gold closed sharply higher on Friday and above December’s high crossing at 892.20 thereby renewing the rally off October’s low. The high-range close sets the stage for a steady to higher opening on Monday. Stochastics and the RSI are bullish signaling that sideways to higher prices are possible near-term. If April extends this week’s rally, October’s high crossing at 938.20 is the next upside target. Closes below the 10-day moving average crossing at 842.60 would confirm that a short-term top has been posted. First resistance is today’s high crossing at 905.50. Second resistance is October’s high crossing at 938.20. First support is today’s low crossing at 853.80. Second support is the 10-day moving average crossing at 842.60.

Gold Trading Signals – www.TheGoldAndOilGuy.com

SILVER TRADING

March silver closed higher on Friday and above the upper boundary of this fall’s trading range crossing at 11.770. The high-range close sets the stage for a steady to higher opening on Monday. Stochastics and the RSI are bullish signaling that sideways to higher prices are possible near-term. If March extends this week’s rally, the reaction high crossing at 12.430 is the next upside target. Closes below the 20-day moving average crossing at 10.047 would temper the near-term friendly outlook in the market. First resistance is today’s high crossing at 12.075. Second resistance is the reaction high crossing at 12.430. First support is the 20-day moving average crossing at 10.047. Second support is last Thursday’s low crossing at 10.320.  

CRUDE OIL TRADING

March crude oil closed higher on Friday and above the 20-day moving average crossing at 45.09 signaling that a short-term low has been posted. The high-range close sets the stage for a steady to higher opening on Monday. Stochastics and the RSI are turning bullish signaling that sideways to higher prices are possible near-term. If March extends today’s rally, this month’s high crossing at 54.74 is the next upside target. Closes below December’s low crossing at 38.00 would open the door for a possible test of psychological support crossing at 30.00 later this winter. First resistance is today’s high crossing at 47.00. Second
resistance is this month high crossing at 54.74. First support is Tuesday’s low crossing at 39.11. Second support is December’s low crossing at 38.00.

Gold Trading Signals – www.TheGoldAndOilGuy.com
Chris Vermeulen