The two most popular investments a few years ago have been dormant and out of the spot light. But from looking at the price of both gold and oil charts their time to shine may be closer than one may thing.

Seasonal charts allow us to look at what the average price for an investment does during a specific time of the year. The gold and oil seasonal charts below clearly show that we are entering a time which price tends to drift higher.

While these chart help with the overall bias of the market keep in mind they are not great at timing moves and should always be coupled with the daily and weekly underlying commodity charts.

Now, let’s take a quick look at what the god father of technical/market analysis shows in terms of market cycles and where I feel we are trading… As I mentioned last week, a picture says a thousand words so why write when I can show it visually.


John Murphy’s Business Cycle:

JMCycle

Mature Stock Market:

cycletop

Commodity Index Looks Bullish and Should Rise:

GCC

Gold & Silver Seasonality, Price Charts w/ Analysis:

 Precious Metals like gold and silver are nearing a bounce and possible major rally in the second half of this year.

GoldSeason

cycletop GCC GoldSeason i2y8euv0


Crude Oil Seasonality, Price Chart w/ Analysis:

Crude oil has been a tough one to trade in the last year. The recent 15 candles have formed a bullish pattern and with the next few months on the seasonal chart favoring higher prices it has been leaning towards the bullish side.

OilSeason

oil1


Commodity, Gold & Oil Cycle and Seasonality Conclusion:

In short, I feel the equities market is nearing a significant top in the next couple weeks. If this is the case money will soon start flowing into commodities in general as more of the safe haven play. To support this outlook I am also factoring in a falling US dollar. Based on the weekly dollar index chart it looks as though a sharp drop in value is beginning. This will naturally lift the price of commodities especially gold and silver.

It is very important to remember that once a full blown bear market is in place stocks and commodities including gold and silver will fall together. I feel we are beginning to enter a time with precious metals will climb but it may not be as much as you think before selling takes control again.

Final thought, This could be VERY bullish for the Canadian Stock Market (Toronto Stock Exchange) as it is a commodity rich index. While the US may have a pullback or crash Canadian stocks may hold up better in terms of percentage points.

FATHERS DAY SPECIAL: 25% Off Membership Today!

Get My Daily Video, Updates & Alerts Here: www.TheGoldAndOilGuy.com

Chris Vermeulen

How to trade technology stocks or the technology sector moving forward may not be that complicated. This report shows you where the big technology stocks are likely to go in the coming week or two. This is based strictly on technical analysis not fundamentals as fundamentals typically lag the market drastically.

If you have been following my analysis for some time you will recall the detailed report on AAPL and RIMM shares last year when I called the top in Apple shares and the bottom for RIMM (BBRY). In that report I walked you through the stages which stocks go through and where each of these stocks were trading at then. Be sure to review the charts quickly here: http://www.thegoldandoilguy.com/collapse-of-apple-rise-of-the-blackberries-stock-market-cycle/

In this week’s report I talk about the technology sector in more detail using the tech giants like Apple, Google, Yahoo, BBRY, and the XLK tech sector exchange traded fund. A picture says a thousand words so here are a few thousand words in picture format with my analysis and thinking as of this week.

Keep in mind that the market changes each day so forecasts and outlooks can flip within a couple days so nothing is set in stone and subject to change.

YAHOO – Daily Chart

Yahoo is in an uptrend with strong share accumulation. It continues to form bullish price patterns and points to higher prices in the coming week.

yhoo1

Research In-Motion/Back Berry WEEKLY Chart:

This is a weekly chart so things move much slower. But overall the pattern on BBRY is very bullish and if the broad market does not start a correction this stock price should test $30 per share this summer.

BBRY1


Apple Daily Chart:

Apple topped out months ago but is now starting to look ready for a bounce. It is forming a possible stage 1 base, and an inverse head & Shoulders pattern. Both point to higher prices and a gap window fill which is the next higher volume resistance zone.

aapl1


XLK – Technology Sector Exchange Traded Fund

While I like the potential of individual stocks you are subject to individual news etc… which is a little to risky for my blood but my trading partner specializes in this type of trading and has been making a killing this year with his subscribers at www.ActiveTradingPartners.com. The more conservative trader can focus on a basket of technology stocks using the XLK ETF which shows higher prices in the next week or two also.

Another way to play this is through options which is technically the least risky trading strategy there is when done correctly. You can see from these results options are VERY powerful – Options Trading

xlk1


Technology Trading Conclusion:

In short, I like how the technology sector is looking for a continued move higher. Keep in mind the report I did a week ago talking about the intermediate cycle topping out for the SP500 soon. Stocks may just reach their recent highs then roll over in a big way. So any gains should be protected with partial profit taking and a protective stop.

Get My Thoughts & Ideas Every Day Delivered to Your Inbox: www.thegoldandoilguy.com/signup.php

Chris Vermeulen

It has been a very long couple of years for the precious metal bugs. The price of gold, silver and their related mining stocks have bucked the broad market up trend and instead have been sinking to the bottom in terms of performance.

Earlier this week I posted a detailed report on the broad stock market and how it looks as though it‘s uptrend will be coming to an end sooner than later. The good news is that precious metals have the exact flip side of that outlook. They appear to be bottoming as they churn at support zones.

While metals and miners remain in a down trend it is important to recognize and prepare for a reversal in the coming weeks or months. Let’s take a look at the charts for a visual of where price is currently trading along with my analysis overlaid.

Weekly Price of Gold Futures:

Gold has been under heavy selling pressure this year and it still may not be over. The technical patterns on the chart show continued weakness down to the $1300USD per once which would cleanse the market of remaining long positions before price rockets towards $1600+ per ounce.

There is a second major support zone drawn on the chart which is a worst case scenario. But this would likely on happen if US equities start another major leg higher and rally through the summer.

PriceOfGold


Weekly Price of Silver Futures:

Silver is a little different than gold in terms of where it stands from a technical analysis point of view. The recent 10% dip in price which shows on the chart as a long lower candle stick wick took place on very light volume. This to me shows the majority of weak positions have been shaken out of silver. Gold has not done this yet and it typically happens before a bottom is put in.

While I figure gold will make one more minor new low, silver I feel will drift sideways to lower during until gold works the bugs out of the chart.

PriceOfSilver


Silver Mining Stock ETF – Weekly Chart:

Silver miners are oversold and trading at both horizontal support and its down support trendline. Volume remains light meaning traders and investors are not that interested in them down where and it should just be a matter of time (weeks/months) before they build a basing pattern and start to rally.

SilverMiningStocksETF


Gold Mining Stock ETF – Weekly Chart:

Gold mining stocks continue to be sold by investors with volume rising and price falls. Fear remains in control but that may not last much longer.

GOldMiningStocksETF

Gold Junior Mining Stock ETF – Weekly Chart:

Gold junior miners are in the same boat with the big boys. Overall gold and gold miners are still being sold while silver and silver stocks are firming up.

GoldJuniorMiningStocksETF


Precious Metals Trading Conclusion:

In the coming weeks we should see the broad stock market top out and for gold miners along with precious metals bottom. There are some decent gains to be had in this sector for the second half of the year but it will remain very dicey at best.

If selling in the broad market becomes intense and triggers a full blown bear market money will be pulled out of most investments as cash is king. Gold is likely to hold up the best in terms of percentage points but mining stocks will get sucked down along with all other stocks for a period of time. This scenario is not likely to be of any issue for a few months yet but it’s something to remember.

Get My Daily Precious Metals Report Each Morning And Profit!
www.TheGoldAndOilGuy.com
Chris Vermeulen

Over the past couple week’s investors and traders have been growing increasingly bearish for the US stock market. While I too also feel this rally is getting long in the teeth there is no reason to exit long positions and start shorting.

My followers know I do not pick tops and I do not pick bottoms. This I explained in great detail in my previous report. There are more cons to that tactic and on several different levels (timing, volatility, emotions, lack of experience, addiction) than there are pro’s.

Keeping things simple, short and to the point here is my thinking for today and this week on the broad market. Remember my analysis is 100% technical based using price, volume, cycles, volatility, momentum and sentiment. I try not to let any emotions, gut feel, or bias flow into my projections. I say “TRY” because I am only human and at times when the market and emotions are flying high they still take control of me but that is few and far between.

So let’s get to the charts shall we!

SP500 Index Trading Daily Chart – SPY Exchange Traded Fund

The SP500 index continues to hold up within its rising trend channel and the recent pullback is bullish. Remember the trend is your friend and it can continue for very long periods of times ranging from days, weeks, and even months…

SP500Uptrend


The US Stock Market MUSCLE Indexes

The charts below show and explain my thinking… But in short we need these two indexes to be strong if we want to see another major leg higher in the SPY, or to at least test the recent highs.

Today the market opened slightly higher and push up in the first 30 minutes with strong volume. Overall the market looks as though it needs a day pause/pullback before taking another run higher.

Small cap stocks are the ULTIMATE Risk On play and generate ridiculous gains in very short periods of time. I focus on these with my trading partner exclusively at ActiveTradingPartners.com where we have been making a killing on trades like: NUGT up 21% in 1 day and IOC up 11% in 2 days
USLeaders


Bullish Index Price, Volume & Candles

The SP500 has been very predictable the past couple weeks for both intraday trading during key reversal times in the market when price has pullback to a support zone, and also for swing trading. Last week we myself and followers bought SSO ETF when the market pulled back and we exited the next day for a 3.5% profit.

Yesterday was a perfect intraday example with the SP500 bottoming out at my 11:30am morning reversal time zone with price trading at support. Price then rallied into the close posting a 12 point gain on the SP500 futures for a simple momentum play pocketing $600.

1130


US Stock Market Mid-Week Conclusion:

In short, I still like stocks as the place to be and will not get bearish until proven wrong. Once price reverses and the technical clearly paint a bearish picture with price, volume, momentum, cycles and sentiment will I start shorting the bounces.

This week is a pivotal one for the stock market so expect increased volatility and possibly lower lows still until the counter-trend flushes the weak position out before moving higher.

If you like my simple, clean and profitable market analysis join my NEWSLETTER: www.thegoldandoilguy.com/signup.php

Chris Vermeulen

Timing stock market tops and bottoms is risky business and we all know the more the more risk we take the more potential gain would could also made. Correctly timing a top or bottom for any investment is flat out exciting not to mention financially rewarding. But this high risk trading tactic does come with some major issues which you must FULLY understand so that you can protect your capital and self-confidence.

On May 13th I wrote a special report on how to spot market tops just before they happen and how to do it with a very high probability of success. I also explain the major pit falls to be aware of so you stay on the right side of the market.

I recommend you read this special report now: http://www.thegoldandoilguy.com/how-to-spot-time-stock-market-tops/

That special report truly showed you what was going to happen a few weeks before it did. Much like how this report shows you what is likely to happen in June.

Looking at the market with my YOU ARE HERE type of using cycles, volume, price patterns and momentum to forecast what is likely to unfold in the coming weeks. Depending on the time frame used for my analysis I can figure out with a high probability where price will be in a few minutes, hours or days also.

Mall Market Directory – You Are Here

Stock market tops are tough to trade and time. That is because there are so many things happening in the media and emotions running wild that it’s tough to get a grasp on what you should really be focusing on to keep a level head trade around it.

Market tops are typically not an event but rather a progression that takes much longer than most individuals expect. I still find myself jumping the gun at times and I know this and have been through this process hundreds of times in various investments. The human brain is a powerful tool but emotions can force you to override your rules/strategy still.

U-R-Hear

Stop Fighting! – Bulls & Bears are BOTH Correct at this Stage

It does not matter where you go to get your stock market news and reports… Everyone is arguing their bullish or bearish case more than EVERY. There is a reason for this and it’s because the SP500, DJIA, RUT and NASDAQ appear to be entering a cycle top. What does this mean? It means the uptrend is almost over from a technical analyst point of view, and those who are have been bearish for a long time feel the market topping out more now than ever in their gut that this is the top.

Keeping it simple removing news, economic data, emotions and biases we are left with one thing which is technical analysis. This is based on price alone and that is important to remember because the only thing that pays you money for an investment is when price moves in your favor. Believe it or not price only has blips on the charts here and there which is based off news, economic data etc… In the big picture stock prices tend to lead economic data by several months and in some cases years.

So the big question is this… If price action is the only thing that pays you when trading why bother worrying about all the other opinions, news out there. That stuff only adds to the confusion and in most cases gets you on the wrong side of the market.

Timing the Market Top Conclusion:

In short, from a technical point of view the SP500 remains in an uptrend. But according to technical analysis the upside momentum is starting to slow. If we get a few more down days then the trend will flip and be down but it has not yet happened.

When the trend does reverse down you must remember that 80% of the time price will bounce back up to test near the recent highs before truly rolling over and collapsing. Think of it like a zombie movie. Just when you think you killed one it comes back to life for one last scare before its dead.

Just to touch on stock market bottoms so you do not get confused. Stock market bottoms are little different than tops so they are traded differently. I will cover them when the time comes.

Trading the market is not easy during this type of condition, which is why members and myself got long SSO on the 23rd and two days later sold out for a 3.5% gain. I am now looking to reload this week for another bounce/rally play but only time will tell if we get another setup.

Download my FREE eBook on Controlling Your Trades, Money & Emotions: http://www.thegoldandoilguy.com/trade-money-emotions.php

Chris Vermeulen

Precious metals and their related mining stocks continue to underperform the broad market. This year’s heavy volume breakdown below key support has many investors and trader’s spooked creating to a steady stream of selling pressure for gold and silver bullion and mining stocks.

While the technical charts are telling me prices are trying to bottom we must be willing to wait for price to provide low risk entry points before getting involved. Precious metals are like any other investment in respect to trading and investing in them. There are times when you should be long, times to be in cash and times to be short (benefit from falling prices). Right now and for the last twelve months when looking at precious metals cash has been king.

Since 2011 when gold and silver started to correct the best position has been to move to cash or to sell/write options until the next trend resumes. This is something I have been doing with my trading partner who focuses solely on Options Trading who closed three winning positions last week for big gains.

In 2008 we had a similar breakdown in price washing the market clean of investors who were long precious metals. If you compare the last two breakdowns they look very similar. If price holds true then we will see higher prices unfold at the end of 2013.

The key here is for the price to move and hold above the major resistance line. A breakout would trigger a rally in gold to $2600 – $3500 per ounce. With that being said gold and silver may be starting a bear market. Depending what the price does when the major resistance zone is touched, my outlook may change from bullish to bearish. Remember, no one can predict the market with 100% accuracy and each day, week and month that passes changes the outlook going forward.

The chart below is on I drew up on May 3rd. I was going to get a fresh chart and put my analysis on it but to be honest my price forecast/analysis has been spot on thus far and there is no need to update.

LongTermWeeklyGold

Gold Daily Technical Chart Showing Bottoming Process:

Major technical damage has been done to the chart of gold. Gold is trying to put in a bottom but still needs more time. I feel gold will make a new low in the coming month then bottom as drawn on the chart below.

Gold27

Silver Daily Technical Chart Showing Bottoming Process:

Silver is in a similar as gold. The major difference between gold and silver is that silver dropped 10% early one morning this month which had very light volume. The fact that silver hit my $20 per ounce level and it was on light volume has me thinking silver has now bottomed.

But, silver may flounder at these prices or near the recent lows until its big sister (gold) puts in a bottom.

SIlver27

Gold Mining Stocks Monthly Investing Zone Chart:

Gold mining stocks broke down a couple months ago and continue to sell off on strong volume. If precious metals continue to move lower then mining stocks will continue their journey lower.

This updated chart which I originally drew in February warning of a breakdown below the green support trend lines would signal a collapse in stock prices, which is exactly what has/is taking place. While I do not try to pick bottoms (catch falling knives) I do like to watch for them so I am prepared for new positions when the time and chart turn bullish or provide a low risk probing entry point.

While I focus more on analysis, forecasts and ETF trading another one of my trading partners who focuses on Trading Stocks and 3x Leveraged ETF’s has been cleaning up with gold miners.

GDX27

Gold, Silver and Mining Stocks Conclusion:

Precious metals continue to be trending down and while they look to be trying to bottom it is important to remember that some of the biggest percent moves take place in the last 10% of a trend. So we may be close to a bottom on the time scale but there could be sharply lower prices yet.

The time will come when another major signal forms and when it does we will be getting involved. The exciting this is that it could be just around the corner. So if you want to keep current and take advantage of the next major moves in the market be sure to join our newsletters.

Join My Newsletter Memorial Day Special 50% Discount: http://www.TheGoldAndOilGuy.com/

Chris Vermeulen


Watch today’s trading video covering setups unfolding in the market for today and next week.

Get Trade Alerts Now: http://www.thegoldandoilguy.com/signup.php

Since the middle of April everyone and including their grandmother seems to have been building a short position in the equities market and we know picking tops or bottoms fighting the major underlying trend is risky business but most individuals cannot resist.

The rush one gets trying to pick a major top or bottom is flat out exciting and that is what makes it so darn addicting and irresistible. If you have ever nailed a market top or bottom then you know just how much money can be made. That one big win naturally draws you back to keep doing it much like how a casino works. The chemicals released in the brain during these extremely exciting times are strong enough that even the most focused traders fall victim to breaking rules and trying these type of bets/trades.

So if are going to try to pick a top you better be sure the charts and odds are leaning in your favor as much as possible before starting to build a position.

Below are a few charts with my analysis and thoughts overlaid showing you some of the things I look at when thinking about a counter trend trade like picking a top within a bull market.

Utility Stocks vs SP500 Index Daily Performance Chart:

The SPY and XLU performance chart below clearly shows how the majority of traders move out of the slow moving defensive stocks (utilities – XLU) and starts to put their money into more risky stocks. This helps boost the broad market. I see the same thing in bonds and gold this month which is a sign that a market top is nearing.

That being said when a market tops it is generally a process which takes time. Most traders think tops area one day event but most of the times it takes weeks to unfold as the upward momentum slows and the big smart money players slowly hand off their long positions to the greedy emotion drove traders.

Look at the chart below and notice the first red box during September and October. As you can see it took nearly 6 weeks for that top to form before actually falling off. That same thing could easily happen again this time, though I do feel it will be more violent this time around.

SPYXLU


SPY ETF Trading Chart Shows Instability and Resistance:

Using simple trend line analysis we see the equities market is trading at resistance and sideways or lower prices are more likely in the next week or two.

SPYResistance


Stocks Trading Above 150 Day Moving Average Chart:

This chart because it’s based on a very long term moving average (150sma) is a slow mover and does not work well for timing traded. But with that said it does clearly warn you when stocks are getting a little overpriced and sellers could start at any time.

General rule is not to invest money on the long side when this chart is above the 75% level. Rather wait for a pullback below it.

BarC150


Stocks Trading Above 20 Day Moving Average Chart:

This chart is based on the 20 day moving average which moves quickly. Because it reacts quicker to recent price action it can be a great help in timing an entry point for a market top or bottom. It does not pin point the day/top it does give you a one or two week window of when price should start to correct. You can view this chart below live but without my analysis here: http://www.thetechnicaltraders.com/stock-market-momentum/

BarC20


How to Spot and Time Stock Market Tops Conclusion:

As we all know or will soon find out, trading is one of the toughest businesses or and one of the most expensive hobbies that one will try to master. Hence the 95-99% failure rate of individuals who try to understand how the market functions, position management, how to control their own emotions and to create/follow a winning strategy.

With over 8000 public traded stocks, exchange traded funds, options, bonds, commodities, futures, forex, currencies etc… to pick from its easy to get overwhelmed and just start doing more or less random trades without a proven, documented rule based strategy. This type of trading results in frustration, loss of money and the eventual closure of a trading account. During this process most individuals will also lose friends, family and in many cased self-confidence.

So the next time you think about betting against the trend to pick a top or a bottom you better make darn sure you have waited well beyond the first day you feel like the market is topping out. Stocks trading over the 150 and 20 day moving averages should be in the upper reversal zones and money should be flowing out of bonds and other safe haven/defensive stocks to fuel the last rally/surge higher in the broad market.

Also I would like to note that I do follow the index futures and volume very closely on both the intraday and daily charts. This is where the big money does a lot of trading. Knowing when futures contracts are being sold or bought with heavy volume is very important data in helping time tops and bottoms more accurately. And the more experience you have in trading also plays a large part in your success in trading tops and bottoms.

Download my FREE eBook on Controlling Your Trades, Money & Emotions: http://www.thegoldandoilguy.com/trade-money-emotions.php

Chris Vermeulen

By Futures Portal

Chris Vermeulen www.TheGoldAndOilGuy.com a full time trader shares
his experience of trading futures and ETFs.
——————————————————–

You call yourself the “Gold and Oil Guy”, are the gold and oil sectors are your specialties?

I follow gold and oil closely and give my analysis, thoughts and trades ideas to my followers each morning before the market opens. While I follow them closely the SP500 is my baby and what I prefer to trade. I found that emotions run wild in the stock market and once you understand what state of mind the majority of traders are in, then you are able to accurately track and forecast future moves 1-3 days in advance.

How did you get started trading?

I started years ago in college trading from my laptop. It didn’t take long before I decided this was what I was meant to do for a living. I have never stopped since. I work with several financial websites and professional traders each week and trade each day either managing swing trades or taking a day trades.

What instruments do you trade the most?

Depending on the risk and type of trade (swing, momentum or day trade) I jump between trading ES Mini Futures, 1x ETFs, 2x ETFs and 3X ETFs. I prefer index trading specifically the SP500 as that has been my main focus for day one. It’s better to be really GOOD AT ONE THING than average at a bunch of things. This strategy has many benefits to it including less time searching for trade setups, less stress, lower risk levels etc…

How did you choose the time frames you trade on?

Choosing the time frames to trade took many years of trial and error. But I did eventually find a couple time frames which have proved to be VERY accurate when trading the SP500 specifically. Money flows in and out of the market in waves (cycles) and once I realized these cycles and could identify fear and greed in the market place finding and timing trades was the difference between night and day.
The really exciting thing about the SP500 and its cycles/timeframes is that I can trade full time and have trades almost every other day or site back and wait for the longer term swing trades and enjoy time with my family, friends and exercise. I have built a trading system that automatically breaths with the market using current volatility levels, various cycles, buy/sell volume levels and momentum and it alerts me in pre-market trading each day if I a buy, sell or position adjustment is to be made. The time frames I focus on are the daily, 30 minute, 10 minute and 3 minute.

Do you trade leveraged instruments? Do you trade them differently from non-leveraged investments?

I trade all types of instruments based around the SP500. In short, the more leverage I use the smaller the position I take and the shorter term the trade is.

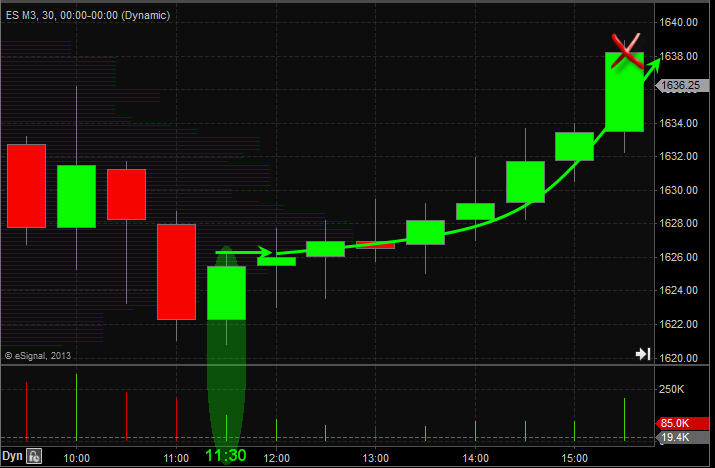
For example I will trade the ES mini futures for day trades which are always closed out at the end of the day.

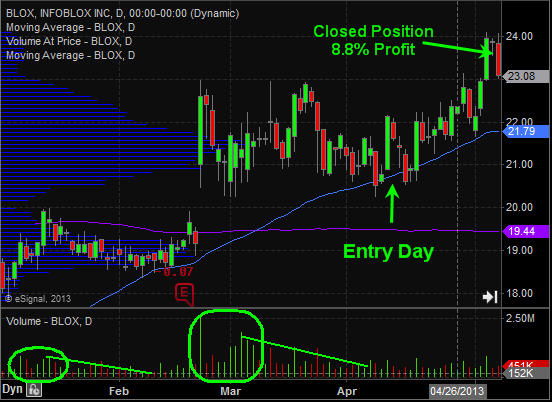
Momentum trades which last 1-3 days I will use a 2x or 3x ETF like SSO or SPXU to get more juice from a play but maintain a healthy risk level as overnight trading and price gaps cut both ways.

Swing Trades I take the largest positions in up to 50% of my trading account in a single position using a 1x ETF like the SPY. These trades can last up to 4 months at times.

I do at times make things a little more complicated when trading with a strong trend. Sometimes when I get a swing trade buy signal I will buy a position using the 1x ETF. If in the next 3 days I get lower prices of more than 1% against me while the uptrend remains alive I will add more of a position using a 2x and 3x ETF also. Once the market bounces back a little I close out the leveraged positions to a quick gain and continue to ride the swing trade. I do this same thing in down trends when I am on a hot streak and in the zone with the SP500.

What has been your biggest hurdle becoming a full time trader?

The toughest part of trading for me is keeping laser-beam focus on my strategy as it is mandatory for success. I work with, talk to and read a lot of market opinions of other traders each day and it can cloud my judgment causing me to break my own rules.

In your opinion, what do most traders don’t realize about the “game” of trading?

Most traders/investors do not understand risk/reward for positions. I would say 90% of people I talk with take much too large of positions in investments which carry very high risk. Also they do not use protective stops based of technical analysis/risk tolerances. Those are the two main things, but this list could go on and on… There are a lot of moving parts in the market and each must be closely monitored, managed and understood clearly.

Again, It’s better to be really GOOD AT ONE THING than average at a bunch of things meaning you should be jumping around trading random stocks, sectors, commodities and investment types like options, equities, forex etc… Just learn one, master it and then expand.

Without revealing your proprietary method, could you please tell us what tools you use for trading? Any specific indicators?

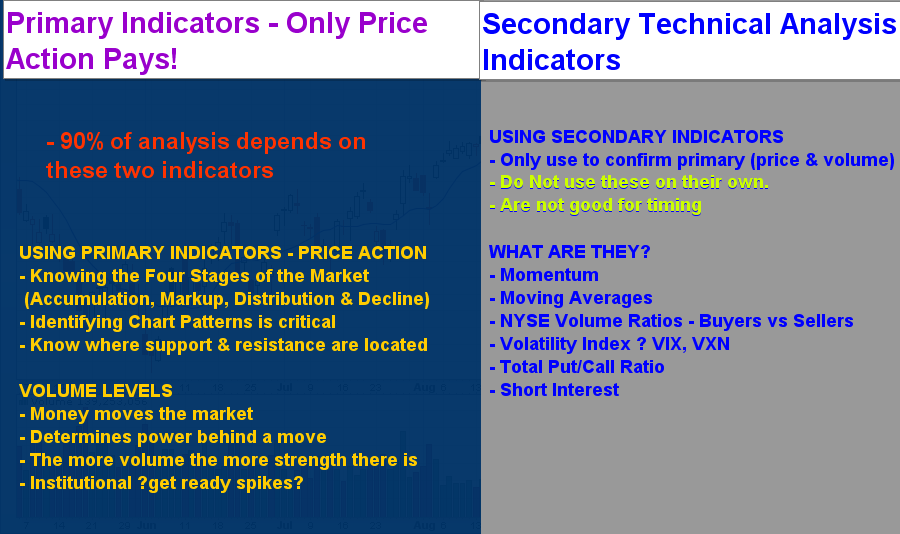
I am a technical trader so I focus 100% on Price, Volume and Momentum. News, economic data and rumors mean absolutely nothing to me. The only thing that pays traders is price action so that is what I follow. It’s simple supply and demand. High volume means there is power behind a move and momentum is how fast the price is moving on various time frames.

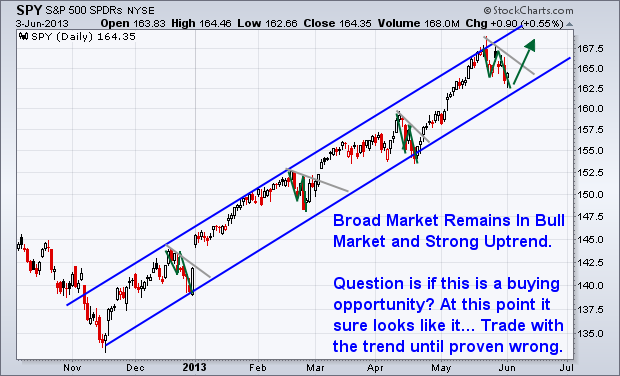
As long as you trade with the daily trend direction forget about picking market tops or bottoms you instantly have the odds in your favor. Problem is people always want to try and outsmart the market by going against the trend and trying to pick these tops and bottoms.
As for the indicators I use. Again they are simple and based off price, volume and momentum. Each of my indicators has been customized for the SP500 and is unique. I do like stochastics and bollingerbands but they each need to be tuned for the underlying investment to provide a trading edge.

What advice would you give new traders to start on the right foot?

I would tell a new trader to spend a lot of time thinking about what their ideal/dream lifestyle would be like if they could choose. Do you want to be looking at the computer and trading every day? Or do you want to always be in positions and actively managing them on a weekly basis so you can enjoy life little more? Or A mix of both?

Then you need to figure out what you would like to trade. Stocks, Options, ETFs, Futures, or currencies?
Once you know these things then you should spend a lot of time looking for a successful trading doing EXACTLY what you want and do everything in your power and never give up to learn, master and live that lifestyle. Learning to trade is not cheap. You either lose a lot of money or spend a lot of money to fast track things… either way it’s going to cost you thousands of dollars.

Personally I do a hybrid with laser-beam focus. I focus on only one investment (SP500). And I have learned and created my own trading system so I can day trade, momentum trade and swing it. This give me total freedom as I can spend 20 minutes a day looking at the market to manage my swing trade if needed and then walk away. Or can be replying to emails and see a setup unfolding on the intraday chart and take a quick trade and pocket a few hundred bucks on a day trade.

Final question is about drawdowns. How do you handle them in your trading?

Drawdowns are simple really… Depending on the type of investment you are trading the percentage amount will vary. But the same rule should apply. You should have a maximum loss per trade set so that you never blow your account up. Hopefully your protective stop is set way before that level is ever reached but sometimes price moves beyond normal volatility levels.

My general rule is to never lose more than 1% of my account in a trade. So once I spot a setup and then calculate where my stop should be and figure out how much capital to put to work so that if my stop is hit I do not lose more than 1% of my trading account. Because I focus on the SP500 the volatility is low compared to trading individual stocks so moves in price as easy to digest and reduces fear/stress when in a position.

Chris, thank you very much for sharing your experience with us and our readers.
Best of luck on everything.

FuturesPortal.com Editorial

Many investors and traders make the same mistakes assuming that one needs a complex trading system to consistently profit from the stock market. On the contrary, some of the top performing strategies are the ones with the least amount of moving parts and are simple. Because their simplicity they can be easily and consistently followed.

The methodologies we use for timing the market, picking stocks and option trades are very simple because we focus mainly on price, volume and momentum. These three indicators are the key to success. When these are used together you are able time your entries and exits during key turning points, clearly define risk and reward levels while maintaining a clear unbiased state of mind which allows one to trade almost emotionless.

As my Trading System Mastery coach (Brian McAboy) taught me, if you do not have a detailed trading plan which a five year old could trade, then you do not have a solid strategy and will have unnecessary losses and emotional stress.

So here are a couple tips to keep things simple and emotionless:

slide1


sLide2


Our recent trade in Infoblox Inc. (BLOX) with our ActiveTradingPartners Newsletter:
This stock was flashing several signals (price, volume and momentum) that a bounce or rally was likely going to happen within a few weeks. This is a good example of a swing trade based purely on our main indicators.

BLOX


Our Broad Market Outlook:

Current stock market prices are starting to warn us that a market correction is near. You can read more about this in detail in our last report “Stocks Preparing for a Pullback, Buy Bas News, Sell the Good”.

We all know the market works with the saying:
“If the market doesn’t shake you out, it will wait you out”.

How does this work? Simple really, during down trends and just before a market bottom we tend to see capitulation spikes in selling. These scare the last of the long positions out of the market and suck in the greedy shorts after the move has already been made.

During an uptrend which is what we are in now the market makes spike highs designed to scare out the shorts and get greedy long traders to buy more. Once again after the move has already been made and likely near the market top.

If you are the type of trader who always tries to pick tops and bottoms against the current trend then you may like to know this little tip… The largest percent moves typically happen during the last 75% of the trend. What does this mean? It means when you take your position against the trend trying to pick the dead top or bottom you are most likely going to get be caught on the wrong side of the market in a big way.

Most traders I know based on recent emails have been short the market for 1-3 weeks and many keep emailing me that they are adding more shorts each day because they feel the market is going to top. So me being a contrarian by nature in terms of what the masses are doing, if everyone is still holding on to their shorts we likely have not seen the top just yet. Another 1-2% jump from here should be enough to shake them out though…

If you like this article join my free newsletter to receive more timely trading insight at: www.TheGoldAndOilGuy.com

Chris Vermeulen