
BBRY Chart Of The Week
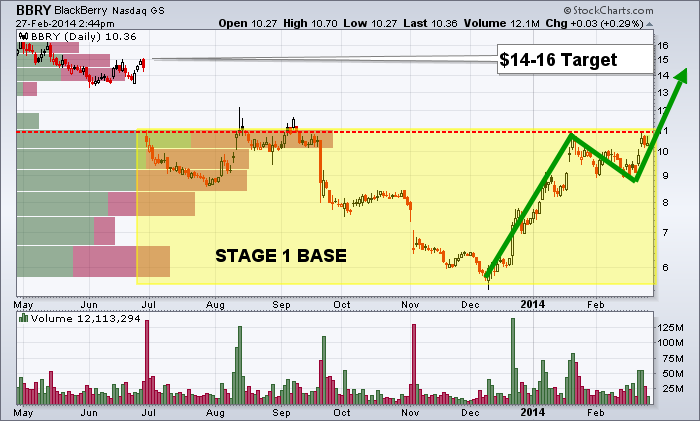
I point out the BBRY (black berry chart). The last time it made this pattern (Stage 1 Base) we saw a quick 54% jump in price. This stock has bucked the broad market trends many times in the past. Meaning, if the SP500 rallied it would trade sideways or low, and during market sell offs we have seen it rally. While it is volatile I like it because its correlation to the broad market is low. I did buy a small 2% ($2000) position in it yesterday as a little momentum trade.

